Valfurva Airbnb Market Analysis 2025: Short Term Rental Data & Vacation Rental Statistics in Lombardy, Italy
Is Airbnb profitable in Valfurva in 2025? Explore comprehensive Airbnb analytics for Valfurva, Lombardy, Italy to uncover income potential. This 2025 STR market report for Valfurva, based on AirROI data from April 2024 to March 2025, reveals key trends in the niche market of 67 active listings.
Whether you're considering an Airbnb investment in Valfurva, optimizing your existing vacation rental, or exploring rental arbitrage opportunities, understanding the Valfurva Airbnb data is crucial. Navigating the high regulation landscape is key to maximizing your short term rental income potential. Let's dive into the specifics.
Key Valfurva Airbnb Performance Metrics Overview
Monthly Airbnb Revenue Variations & Income Potential in Valfurva (2025)
Understanding the monthly revenue variations for Airbnb listings in Valfurva is key to maximizing your short term rental income potential. Seasonality significantly impacts earnings. Our analysis, based on data from the past 12 months, shows that the peak revenue month for STRs in Valfurva is typically August, while October often presents the lowest earnings, highlighting opportunities for strategic pricing adjustments during shoulder and low seasons. Explore the typical Airbnb income in Valfurva across different performance tiers:
- Best-in-class properties (Top 10%) achieve $3,497+ monthly, often utilizing dynamic pricing and superior guest experiences.
- Strong performing properties (Top 25%) earn $2,078 or more, indicating effective management and desirable locations/amenities.
- Typical properties (Median) generate around $1,284 per month, representing the average market performance.
- Entry-level properties (Bottom 25%) see earnings around $675, often with potential for optimization.
Average Monthly Airbnb Earnings Trend in Valfurva
Valfurva Airbnb Occupancy Rate Trends (2025)
Maximize your bookings by understanding the Valfurva STR occupancy trends. Seasonal demand shifts significantly influence how often properties are booked. Typically, Augustsees the highest demand (peak season occupancy), while May experiences the lowest (low season). Effective strategies, like adjusting minimum stays or offering promotions, can boost occupancy during slower periods. Here's how different property tiers perform in Valfurva:
- Best-in-class properties (Top 10%) achieve 72%+ occupancy, indicating high desirability and potentially optimized availability.
- Strong performing properties (Top 25%) maintain 49% or higher occupancy, suggesting good market fit and guest satisfaction.
- Typical properties (Median) have an occupancy rate around 30%.
- Entry-level properties (Bottom 25%) average 16% occupancy, potentially facing higher vacancy.
Average Monthly Occupancy Rate Trend in Valfurva
Average Daily Rate (ADR) Airbnb Trends in Valfurva (2025)
Effective short term rental pricing strategy in Valfurva involves understanding monthly ADR fluctuations. The Average Daily Rate (ADR) for Airbnb in Valfurva typically peaks in February and dips lowest during September. Leveraging Airbnb dynamic pricing tools or strategies based on this seasonality can significantly boost revenue. Here's a look at the typical nightly rates achieved:
- Best-in-class properties (Top 10%) command rates of $258+ per night, often due to premium features or locations.
- Strong performing properties (Top 25%) achieve nightly rates of $179 or more.
- Typical properties (Median) charge around $130 per night.
- Entry-level properties (Bottom 25%) earn around $108 per night.
Average Daily Rate (ADR) Trend by Month in Valfurva
Get Live Valfurva Market Intelligence 👇

Explore Real-time Analytics
Airbnb Seasonality Analysis & Trends in Valfurva (2025)
Peak Season (August, July, February)
- Revenue averages $2,507 per month
- Occupancy rates average 54.5%
- Daily rates average $177
Shoulder Season
- Revenue averages $1,605 per month
- Occupancy maintains around 30.0%
- Daily rates hold near $171
Low Season (May, September, October)
- Revenue drops to average $1,231 per month
- Occupancy decreases to average 22.9%
- Daily rates adjust to average $160
Seasonality Insights for Valfurva
- The Airbnb seasonality in Valfurva shows highly seasonal trends requiring careful strategy. While the sections above show seasonal averages, it's also insightful to look at the extremes:
- During the high season, the absolute peak month showcases Valfurva's highest earning potential, with monthly revenues capable of climbing to $3,107, occupancy reaching a high of 61.4%, and ADRs peaking at $184.
- Conversely, the slowest single month of the year, typically falling within the low season, marks the market's lowest point. In this month, revenue might dip to $1,103, occupancy could drop to 16.8%, and ADRs may adjust down to $156.
- Understanding both the seasonal averages and these monthly peaks and troughs in revenue, occupancy, and ADR is crucial for maximizing your Airbnb profit potential in Valfurva.
Seasonal Strategies for Maximizing Profit
- Peak Season: Maximize revenue through premium pricing and potentially longer minimum stays. Ensure high availability.
- Low Season: Offer competitive pricing, special promotions (e.g., extended stay discounts), and flexible cancellation policies. Target off-season travelers like remote workers or budget-conscious guests.
- Shoulder Seasons: Implement dynamic pricing that balances peak and low rates. Target weekend travelers or specific events. Offer slightly more flexible terms than peak season.
- Regularly analyze your own performance against these Valfurva seasonality benchmarks and adjust your pricing and availability strategy accordingly.
Best Areas for Airbnb Investment in Valfurva (2025)
Exploring the top neighborhoods for short-term rentals in Valfurva? This section highlights key areas, outlining why they are attractive for hosts and guests, along with notable local attractions. Consider these locations based on your target guest profile and investment strategy.
| Neighborhood / Area | Why Host Here? (Target Guests & Appeal) | Key Attractions & Landmarks |
|---|---|---|
| Bormio | Famous thermal spa town known for its skiing and wellness offerings. Ideal for tourists looking for winter sports and relaxation in hot springs. | Bormio Ski Resort, Bagni di Bormio Spa, Bormio Historic Centre, Stelvio National Park, Bormio 2000 Cable Car |
| Livigno | Popular ski destination and tax-free zone offering a vibrant nightlife. Great for winter sports enthusiasts and shoppers. | Livigno Ski Resort, Lake Livigno, Carosello 3000, Mottolino Fun Mountain, Livigno's boutiques |
| Valdidentro | Less crowded than Bormio, offers a tranquil setting with easy access to ski resorts. Perfect for families seeking nature and outdoor activities. | Isolaccia Ski Area, Cimino Peak, Valdidentro hiking trails, Grosio Rock Engravings, Natural Parks of Alpi Retiche |
| Santa Caterina Valfurva | Charming mountain village close to ski slopes, appealing for nature lovers and outdoor adventurers. | Santa Caterina Ski Resort, Valfurva Natural Park, hiking trails, local alpine cuisine, spectacular mountain views |
| Cedegolo | Quieter alternative to more popular ski resorts, attracts those looking for peace and a strong connection to nature. | Cima di Valleggio, Valle di Corteno trails, historic local churches, traditional mountain villages, hiking routes |
| Tirano | Gateway to the Alps with rich history and beautiful scenery. Attracts guests interested in heritage and culture as well as outdoor activities. | Benedictine Monastery of Tirano, Bernina Express departure point, Valtellina Valley, historic center of Tirano, wine tasting tours |
| Sondrio | Cultural and economic center of Valtellina, offers a mix of history, nature and gastronomy. Ideal for guests looking for a blend of urban and outdoor experiences. | Piazza Garibaldi, Sondrio's Wine Road, Palazzo Sertoli, Castel Masegra, Valtellina ski resorts |
| Madesimo | Known for its skiing and summer hiking, Madesimo offers picturesque views and a cozy alpine feel, great for year-round tourism. | Madesimo Ski Resort, Val di Mello, Madesimo hiking trails, local culinary experiences, mountain biking routes |
Understanding Airbnb License Requirements & STR Laws in Valfurva (2025)
Yes, Valfurva, Lombardy, Italy enforces high STR regulations. Obtaining a license and ensuring compliance is almost certainly required according to current 2025 STR laws. Always verify the latest short term rental regulations and Airbnb license requirements directly with local government authorities for Valfurva to ensure full compliance before hosting.
(Source: AirROI data, 2025, based on 72% licensed listings)
Top Performing Airbnb Properties in Valfurva (2025)
Benchmark your potential! Explore examples of top-performing Airbnb properties in Valfurvabased on Trailing Twelve Month (TTM) revenue. Analyze their characteristics, revenue, occupancy rate, and ADR to understand what drives success in this market.

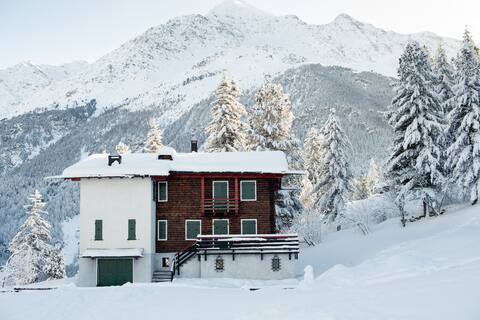
BAITA PÒZ 🌲 Alpine Cabin with ample outdoor space
Entire Place • 5 bedrooms
QC House - Chalet with Sauna
Entire Place • 7 bedrooms
BRAND NEW apartment just a stone's throw from Bormio!
Entire Place • 1 bedroom
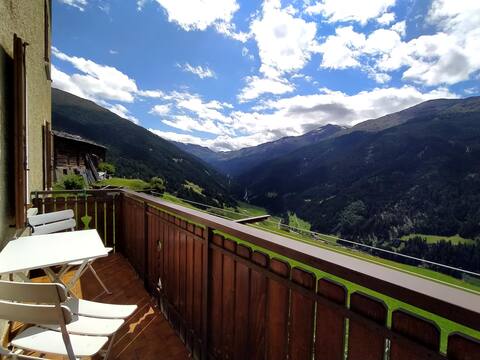
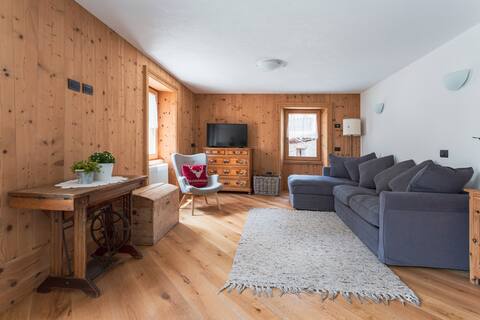
Romantic flat with a view on the mountains
Entire Place • 2 bedrooms

Lovely apartment 4 guests
Entire Place • 1 bedroom

Apartment attic "Il bosco dei larici"
Entire Place • 3 bedrooms
Note: Performance varies based on location, size, amenities, seasonality, and management quality. Data reflects the past 12 months.
Top Performing Airbnb Hosts in Valfurva (2025)
Learn from the best! This table showcases top-performing Airbnb hosts in Valfurva based on the number of properties managed and estimated total revenue over the past year. Analyze their scale and performance metrics.
| Host Name | Properties | Grossing Revenue | Stay Reviews | Avg Rating |
|---|---|---|---|---|
| Elena | 1 | $85,615 | 32 | 4.88/5.0 |
| Miriam | 4 | $83,301 | 131 | 4.90/5.0 |
| Mary E Giovy | 9 | $77,236 | 164 | 4.40/5.0 |
| Valerio | 4 | $65,483 | 38 | 4.15/5.0 |
| Vittoria | 1 | $53,504 | 8 | 4.88/5.0 |
| Giordano | 3 | $51,836 | 145 | 4.98/5.0 |
| Claudia | 3 | $41,836 | 65 | 4.89/5.0 |
| Cristian | 1 | $31,668 | 79 | 4.91/5.0 |
| Ilaria | 1 | $30,431 | 150 | 4.96/5.0 |
| Francesca | 2 | $26,291 | 47 | 5.00/5.0 |
Analyzing the strategies of top hosts, such as their property selection, pricing, and guest communication, can offer valuable lessons for optimizing your own Airbnb operations in Valfurva.
Dive Deeper: Advanced Valfurva STR Market Data (2025)
Ready to unlock more insights? AirROI provides access to advanced metrics and comprehensive Airbnb data for Valfurva. Explore detailed analytics beyond this report to refine your investment strategy, optimize pricing, and maximize your vacation rental profits.
Explore Advanced MetricsValfurva Short-Term Rental Market Composition (2025): Property & Room Types
Room Type Distribution
Property Type Distribution
Market Composition Insights for Valfurva
- The Valfurva Airbnb market composition is heavily skewed towards Entire Home/Apt listings, which make up 97% of the 67 active rentals. This indicates strong guest preference for privacy and space.
- Looking at the property type distribution in Valfurva, Apartment/Condo properties are the most common (89.6%), reflecting the local real estate landscape.
- Smaller segments like house (combined 3.0%) offer potential for unique stay experiences.
Valfurva Airbnb Room Capacity Analysis (2025): Bedroom Distribution
Distribution of Listings by Number of Bedrooms
Room Capacity Insights for Valfurva
- The dominant room capacity in Valfurva is 1 bedroom listings, making up 50.7% of the market. This suggests a strong demand for properties suitable for couples or solo travelers.
- Together, 1 bedroom and 2 bedrooms properties represent 77.6% of the active Airbnb listings in Valfurva, indicating a high concentration in these sizes.
- With over half the market (50.7%) consisting of studios or 1-bedroom units, Valfurva is particularly well-suited for individuals or couples.
Valfurva Vacation Rental Guest Capacity Trends (2025)
Distribution of Listings by Guest Capacity
Guest Capacity Insights for Valfurva
- The most common guest capacity trend in Valfurva vacation rentals is listings accommodating 4 guests (35.8%). This suggests the primary traveler segment is likely small families or groups.
- Properties designed for 4 guests and 6 guests dominate the Valfurva STR market, accounting for 52.2% of listings.
- 25.4% of properties accommodate 6+ guests, serving the market segment for larger families or group travel in Valfurva.
- On average, properties in Valfurva are equipped to host 4.2 guests.
Valfurva Airbnb Booking Patterns (2025): Available vs. Booked Days
Available Days Distribution
Booked Days Distribution
Booking Pattern Insights for Valfurva
- The most common availability pattern in Valfurva falls within the 271-366 days range, representing 53.7% of listings. This suggests many properties have significant open periods on their calendars.
- Approximately 88.0% of listings show high availability (181+ days open annually), indicating potential for increased bookings or specific owner usage patterns.
- For booked days, the 91-180 days range is most frequent in Valfurva (32.8%), reflecting common guest stay durations or potential owner blocking patterns.
- A notable 13.4% of properties secure long booking periods (181+ days booked per year), highlighting successful long-term rental strategies or significant owner usage.
Valfurva Airbnb Minimum Stay Requirements Analysis
Distribution of Listings by Minimum Night Requirement
1 Night
8 listings
12.1% of total
2 Nights
15 listings
22.7% of total
3 Nights
3 listings
4.5% of total
4-6 Nights
11 listings
16.7% of total
7-29 Nights
13 listings
19.7% of total
30+ Nights
16 listings
24.2% of total
Key Insights
- The most prevalent minimum stay requirement in Valfurva is 30+ Nights, adopted by 24.2% of listings. This highlights the market's preference for longer commitments.
- A significant segment (24.2%) caters to monthly stays (30+ nights) in Valfurva, pointing to opportunities in the extended-stay market.
Recommendations
- Align with the market by considering a 30+ Nights minimum stay, as 24.2% of Valfurva hosts use this setting.
- If feasible, allowing 1-night stays, especially midweek or during low season, could capture last-minute bookings, as only 12.1% currently do.
- Explore offering discounts for stays of 30+ nights to attract the 24.2% of the market seeking extended stays.
- Adjust minimum nights based on seasonality – potentially shorter during low season and longer during peak demand periods in Valfurva.
Valfurva Airbnb Cancellation Policy Trends Analysis (2025)
Flexible
20 listings
33.3% of total
Moderate
29 listings
48.3% of total
Strict
11 listings
18.3% of total
Cancellation Policy Insights for Valfurva
- The prevailing Airbnb cancellation policy trend in Valfurva is Moderate, used by 48.3% of listings.
- The market strongly favors guest-friendly terms, with 81.6% of listings offering Flexible or Moderate policies. This suggests guests in Valfurva may expect booking flexibility.
Recommendations for Hosts
- Consider adopting a Moderate policy to align with the 48.3% market standard in Valfurva.
- Regularly review your cancellation policy against competitors and market demand shifts in Valfurva.
Valfurva STR Booking Lead Time Analysis (2025)
Average Booking Lead Time by Month
Booking Lead Time Insights for Valfurva
- The overall average booking lead time for vacation rentals in Valfurva is 63 days.
- Guests book furthest in advance for stays during July (average 101 days), likely coinciding with peak travel demand or local events.
- The shortest booking windows occur for stays in October (average 46 days), indicating more last-minute travel plans during this time.
- Seasonally, Summer (91 days avg.) sees the longest lead times, while Fall (47 days avg.) has the shortest, reflecting typical travel planning cycles.
Recommendations for Hosts
- Use the overall average lead time (63 days) as a baseline for your pricing and availability strategy in Valfurva.
- For July stays, consider implementing length-of-stay discounts or slightly higher rates for bookings made less than 101 days out to capitalize on advance planning.
- Target marketing efforts for the Summer season well in advance (at least 91 days) to capture early planners.
- Monitor your own booking lead times against these Valfurva averages to identify opportunities for dynamic pricing adjustments.
Popular & Essential Airbnb Amenities in Valfurva (2025)
Amenity Prevalence
Amenity Insights for Valfurva
- Essential amenities in Valfurva that guests expect include: Heating, Kitchen. Lacking these (any) could significantly impact bookings.
- Popular amenities like TV, Essentials, Dishes and silverware are common but not universal. Offering these can provide a competitive edge.
- Warning: Wifi is not universally provided but is considered essential globally. Ensure reliable Wifi is offered.
Recommendations for Hosts
- Ensure your listing includes all essential amenities for Valfurva: Heating, Kitchen.
- Prioritize adding missing essentials: Heating, Kitchen.
- Consider adding popular differentiators like TV or Essentials to increase appeal.
- Highlight unique or less common amenities you offer (e.g., hot tub, dedicated workspace, EV charger) in your listing description and photos.
- Regularly check competitor amenities in Valfurva to stay competitive.
Valfurva Airbnb Guest Demographics & Profile Analysis (2025)
Guest Profile Summary for Valfurva
- The typical guest profile for Airbnb in Valfurva consists of a mix of domestic (58%) and international guests, often arriving from nearby Milan, typically belonging to the Post-2000s (Gen Z/Alpha) group (50%), primarily speaking English or Italian.
- Domestic travelers account for 58.0% of guests.
- Key international markets include Italy (58%) and Germany (6.2%).
- Top languages spoken are English (40.5%) followed by Italian (25.5%).
- A significant demographic segment is the Post-2000s (Gen Z/Alpha) group, representing 50% of guests.
Recommendations for Hosts
- Balance marketing efforts between domestic and international channels based on the guest mix.
- Tailor amenities and listing descriptions to appeal to the dominant Post-2000s (Gen Z/Alpha) demographic (e.g., highlight fast WiFi, smart home features, local guides).
- Highlight unique local experiences or amenities relevant to the primary guest profile.
- Consider seasonal promotions aligned with peak travel times for key origin markets.
Nearby Short-Term Rental Market Comparison
How does the Valfurva Airbnb market stack up against its neighbors? Compare key performance metrics like average monthly revenue, ADR, and occupancy rates in surrounding areas to understand the broader regional STR landscape.
| Market | Active Properties | Monthly Revenue | Daily Rate | Avg. Occupancy |
|---|---|---|---|---|
| Laglio | 64 | $4,873 | $463.61 | 47% |
| Bayrischzell | 30 | $4,718 | $392.87 | 42% |
| Urtijëi - St. Ulrich in Gröden - Ortisei | 163 | $4,698 | $630.45 | 40% |
| Moos in Passeier - Moso in Passiria | 17 | $4,619 | $547.60 | 27% |
| Steinberg am Rofan | 11 | $4,394 | $311.71 | 40% |
| Brenzone sul Garda | 19 | $4,128 | $335.25 | 52% |
| Bürserberg | 40 | $3,978 | $342.57 | 41% |
| Sala Comacina | 64 | $3,794 | $400.27 | 50% |
| Bellagio | 373 | $3,630 | $328.26 | 55% |
| Brand | 56 | $3,597 | $486.13 | 33% |