Valdisotto Airbnb Market Analysis 2025: Short Term Rental Data & Vacation Rental Statistics in Lombardy, Italy
Is Airbnb profitable in Valdisotto in 2025? Explore comprehensive Airbnb analytics for Valdisotto, Lombardy, Italy to uncover income potential. This 2025 STR market report for Valdisotto, based on AirROI data from April 2024 to March 2025, reveals key trends in the niche market of 136 active listings.
Whether you're considering an Airbnb investment in Valdisotto, optimizing your existing vacation rental, or exploring rental arbitrage opportunities, understanding the Valdisotto Airbnb data is crucial. Navigating the high regulation landscape is key to maximizing your short term rental income potential. Let's dive into the specifics.
Key Valdisotto Airbnb Performance Metrics Overview
Monthly Airbnb Revenue Variations & Income Potential in Valdisotto (2025)
Understanding the monthly revenue variations for Airbnb listings in Valdisotto is key to maximizing your short term rental income potential. Seasonality significantly impacts earnings. Our analysis, based on data from the past 12 months, shows that the peak revenue month for STRs in Valdisotto is typically August, while October often presents the lowest earnings, highlighting opportunities for strategic pricing adjustments during shoulder and low seasons. Explore the typical Airbnb income in Valdisotto across different performance tiers:
- Best-in-class properties (Top 10%) achieve $3,396+ monthly, often utilizing dynamic pricing and superior guest experiences.
- Strong performing properties (Top 25%) earn $2,114 or more, indicating effective management and desirable locations/amenities.
- Typical properties (Median) generate around $1,176 per month, representing the average market performance.
- Entry-level properties (Bottom 25%) see earnings around $647, often with potential for optimization.
Average Monthly Airbnb Earnings Trend in Valdisotto
Valdisotto Airbnb Occupancy Rate Trends (2025)
Maximize your bookings by understanding the Valdisotto STR occupancy trends. Seasonal demand shifts significantly influence how often properties are booked. Typically, Augustsees the highest demand (peak season occupancy), while October experiences the lowest (low season). Effective strategies, like adjusting minimum stays or offering promotions, can boost occupancy during slower periods. Here's how different property tiers perform in Valdisotto:
- Best-in-class properties (Top 10%) achieve 60%+ occupancy, indicating high desirability and potentially optimized availability.
- Strong performing properties (Top 25%) maintain 44% or higher occupancy, suggesting good market fit and guest satisfaction.
- Typical properties (Median) have an occupancy rate around 26%.
- Entry-level properties (Bottom 25%) average 14% occupancy, potentially facing higher vacancy.
Average Monthly Occupancy Rate Trend in Valdisotto
Average Daily Rate (ADR) Airbnb Trends in Valdisotto (2025)
Effective short term rental pricing strategy in Valdisotto involves understanding monthly ADR fluctuations. The Average Daily Rate (ADR) for Airbnb in Valdisotto typically peaks in February and dips lowest during November. Leveraging Airbnb dynamic pricing tools or strategies based on this seasonality can significantly boost revenue. Here's a look at the typical nightly rates achieved:
- Best-in-class properties (Top 10%) command rates of $377+ per night, often due to premium features or locations.
- Strong performing properties (Top 25%) achieve nightly rates of $211 or more.
- Typical properties (Median) charge around $140 per night.
- Entry-level properties (Bottom 25%) earn around $102 per night.
Average Daily Rate (ADR) Trend by Month in Valdisotto
Get Live Valdisotto Market Intelligence 👇

Explore Real-time Analytics
Airbnb Seasonality Analysis & Trends in Valdisotto (2025)
Peak Season (August, July, February)
- Revenue averages $2,351 per month
- Occupancy rates average 44.1%
- Daily rates average $209
Shoulder Season
- Revenue averages $1,528 per month
- Occupancy maintains around 28.0%
- Daily rates hold near $202
Low Season (March, October, November)
- Revenue drops to average $957 per month
- Occupancy decreases to average 21.6%
- Daily rates adjust to average $190
Seasonality Insights for Valdisotto
- The Airbnb seasonality in Valdisotto shows highly seasonal trends requiring careful strategy. While the sections above show seasonal averages, it's also insightful to look at the extremes:
- During the high season, the absolute peak month showcases Valdisotto's highest earning potential, with monthly revenues capable of climbing to $2,795, occupancy reaching a high of 52.7%, and ADRs peaking at $213.
- Conversely, the slowest single month of the year, typically falling within the low season, marks the market's lowest point. In this month, revenue might dip to $728, occupancy could drop to 18.8%, and ADRs may adjust down to $170.
- Understanding both the seasonal averages and these monthly peaks and troughs in revenue, occupancy, and ADR is crucial for maximizing your Airbnb profit potential in Valdisotto.
Seasonal Strategies for Maximizing Profit
- Peak Season: Maximize revenue through premium pricing and potentially longer minimum stays. Ensure high availability.
- Low Season: Offer competitive pricing, special promotions (e.g., extended stay discounts), and flexible cancellation policies. Target off-season travelers like remote workers or budget-conscious guests.
- Shoulder Seasons: Implement dynamic pricing that balances peak and low rates. Target weekend travelers or specific events. Offer slightly more flexible terms than peak season.
- Regularly analyze your own performance against these Valdisotto seasonality benchmarks and adjust your pricing and availability strategy accordingly.
Best Areas for Airbnb Investment in Valdisotto (2025)
Exploring the top neighborhoods for short-term rentals in Valdisotto? This section highlights key areas, outlining why they are attractive for hosts and guests, along with notable local attractions. Consider these locations based on your target guest profile and investment strategy.
| Neighborhood / Area | Why Host Here? (Target Guests & Appeal) | Key Attractions & Landmarks |
|---|---|---|
| Valdidentro | An attractive area near Valdisotto, it is close to the ski resorts of the Alta Valtellina region. Ideal for visitors looking for skiing and winter sports. | Livigno Ski Area, Bormio Ski Resort, Foscagno Pass, Terme di Bormio, Lake Livigno |
| Bormio | Famous for its thermal baths and ski slopes, Bormio is a classic mountain town that draws tourists year-round for skiing, hiking, and wellness. | Bormio Ski Resort, Bormio Terme, Stelvio Pass, Giardino Botanico Alpino, Bormio 2000 |
| Livigno | Known as a duty-free zone, Livigno is very popular among tourists for skiing and shopping, making it a prime location for vacation rentals. | Livigno Ski Area, Lake Livigno, Cima Piazzi Ski Resort, Duty-free shopping, Alpaca Livigno |
| Sondrio | A charming city in Valtellina, known for its stunning landscapes and wine production. Offers a different experience with cultural and gastronomic tourism. | Castello di Grumello, Valtellina vineyards, Museum of Valtellina, Pizzo dei Tre Signori, Sentiero Valtellina |
| Tirano | A picturesque town known for the Bernina Express, a scenic railway journey. It’s an access point for many outdoor activities in the Alps. | Bernina Express, Santuario della Sassella, Rhaetian Railway, Val Poschiavo, Parco delle Incisioni Rupestri |
| Santa Caterina Valfurva | A quiet mountain resort that offers excellent skiing and hiking opportunities. Perfect for nature lovers and outdoor enthusiasts. | Santa Caterina Ski Resort, Valfurva Nature Park, Chiesa di Santa Caterina, Passo Gavia, Forte Venini |
| Ponte di Legno | Another popular ski and hiking area that’s connected to the Adamello ski area, offers beautiful landscapes and is a great destination for visitors. | Ponte di Legno Ski Resort, Adamello Ski Area, Pista Paradiso, Valley Giardino, Torre di Brenta |
| Madesimo | A lesser-known gem for skiing enthusiasts, Madesimo provides excellent skiing opportunities and is popular among locals and visitors for its relaxed atmosphere. | Madesimo Ski Area, Valdardezza Trail, Lake Scuro, Montalto Ski Area, Pizzo Groppera |
Understanding Airbnb License Requirements & STR Laws in Valdisotto (2025)
Yes, Valdisotto, Lombardy, Italy enforces high STR regulations. Obtaining a license and ensuring compliance is almost certainly required according to current 2025 STR laws. Always verify the latest short term rental regulations and Airbnb license requirements directly with local government authorities for Valdisotto to ensure full compliance before hosting.
(Source: AirROI data, 2025, based on 63% licensed listings)
Top Performing Airbnb Properties in Valdisotto (2025)
Benchmark your potential! Explore examples of top-performing Airbnb properties in Valdisottobased on Trailing Twelve Month (TTM) revenue. Analyze their characteristics, revenue, occupancy rate, and ADR to understand what drives success in this market.
Aria di Casa Piazzi
Entire Place • 2 bedrooms
Residence Santa Lucia
Entire Place • 3 bedrooms

Aria di Casa Reit
Entire Place • 1 bedroom
Apartment in Bormio
Entire Place • 2 bedrooms
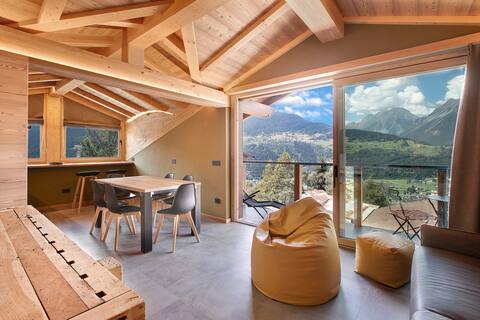
Mountain Chalet close to Bormio
Entire Place • 4 bedrooms
![[IHost Luxury Flat in Bormio] - Centrale 69](https://a0.muscache.com/im/pictures/miso/Hosting-912839762564045245/original/a532207b-2b55-41af-935d-c633fbb503d9.jpeg?im_w=480&im_format=avif)
[IHost Luxury Flat in Bormio] - Centrale 69
Entire Place • 2 bedrooms
Note: Performance varies based on location, size, amenities, seasonality, and management quality. Data reflects the past 12 months.
Top Performing Airbnb Hosts in Valdisotto (2025)
Learn from the best! This table showcases top-performing Airbnb hosts in Valdisotto based on the number of properties managed and estimated total revenue over the past year. Analyze their scale and performance metrics.
| Host Name | Properties | Grossing Revenue | Stay Reviews | Avg Rating |
|---|---|---|---|---|
| Italianway | 12 | $161,180 | 165 | 4.79/5.0 |
| Holidu | 4 | $157,745 | 156 | 4.93/5.0 |
| Lucia | 4 | $68,522 | 38 | 4.97/5.0 |
| Alessandra - Interhome Group | 3 | $64,856 | 100 | 2.98/5.0 |
| Host #557017018 | 3 | $59,252 | 0 | 0.00/5.0 |
| Ai Suma Residence | 5 | $55,446 | 97 | 4.68/5.0 |
| Marina | 1 | $52,280 | 4 | 5.00/5.0 |
| I-Host | 4 | $48,295 | 24 | 4.26/5.0 |
| Host #497563550 | 4 | $43,537 | 0 | 0.00/5.0 |
| Chalet Del Bosco | 4 | $41,197 | 435 | 4.95/5.0 |
Analyzing the strategies of top hosts, such as their property selection, pricing, and guest communication, can offer valuable lessons for optimizing your own Airbnb operations in Valdisotto.
Dive Deeper: Advanced Valdisotto STR Market Data (2025)
Ready to unlock more insights? AirROI provides access to advanced metrics and comprehensive Airbnb data for Valdisotto. Explore detailed analytics beyond this report to refine your investment strategy, optimize pricing, and maximize your vacation rental profits.
Explore Advanced MetricsValdisotto Short-Term Rental Market Composition (2025): Property & Room Types
Room Type Distribution
Property Type Distribution
Market Composition Insights for Valdisotto
- The Valdisotto Airbnb market composition is heavily skewed towards Entire Home/Apt listings, which make up 93.4% of the 136 active rentals. This indicates strong guest preference for privacy and space.
- Looking at the property type distribution in Valdisotto, Apartment/Condo properties are the most common (83.8%), reflecting the local real estate landscape.
- The presence of 5.1% Hotel/Boutique listings indicates integration with traditional hospitality.
- Smaller segments like outdoor/unique, others (combined 1.4%) offer potential for unique stay experiences.
Valdisotto Airbnb Room Capacity Analysis (2025): Bedroom Distribution
Distribution of Listings by Number of Bedrooms
Room Capacity Insights for Valdisotto
- The dominant room capacity in Valdisotto is 1 bedroom listings, making up 50.7% of the market. This suggests a strong demand for properties suitable for couples or solo travelers.
- Together, 1 bedroom and 2 bedrooms properties represent 90.4% of the active Airbnb listings in Valdisotto, indicating a high concentration in these sizes.
- With over half the market (50.7%) consisting of studios or 1-bedroom units, Valdisotto is particularly well-suited for individuals or couples.
- Listings with 3+ bedrooms (6.6%) represent a smaller niche, potentially indicating an underserved market for larger group accommodations in Valdisotto.
Valdisotto Vacation Rental Guest Capacity Trends (2025)
Distribution of Listings by Guest Capacity
Guest Capacity Insights for Valdisotto
- The most common guest capacity trend in Valdisotto vacation rentals is listings accommodating 4 guests (37.5%). This suggests the primary traveler segment is likely small families or groups.
- Properties designed for 4 guests and 6 guests dominate the Valdisotto STR market, accounting for 58.1% of listings.
- 25.7% of properties accommodate 6+ guests, serving the market segment for larger families or group travel in Valdisotto.
- On average, properties in Valdisotto are equipped to host 4.3 guests.
Valdisotto Airbnb Booking Patterns (2025): Available vs. Booked Days
Available Days Distribution
Booked Days Distribution
Booking Pattern Insights for Valdisotto
- The most common availability pattern in Valdisotto falls within the 271-366 days range, representing 68.4% of listings. This suggests many properties have significant open periods on their calendars.
- Approximately 95.6% of listings show high availability (181+ days open annually), indicating potential for increased bookings or specific owner usage patterns.
- For booked days, the 31-90 days range is most frequent in Valdisotto (47.8%), reflecting common guest stay durations or potential owner blocking patterns.
- A notable 5.8% of properties secure long booking periods (181+ days booked per year), highlighting successful long-term rental strategies or significant owner usage.
Valdisotto Airbnb Minimum Stay Requirements Analysis
Distribution of Listings by Minimum Night Requirement
1 Night
25 listings
19.5% of total
2 Nights
34 listings
26.6% of total
3 Nights
5 listings
3.9% of total
4-6 Nights
12 listings
9.4% of total
7-29 Nights
10 listings
7.8% of total
30+ Nights
42 listings
32.8% of total
Key Insights
- The most prevalent minimum stay requirement in Valdisotto is 30+ Nights, adopted by 32.8% of listings. This highlights the market's preference for longer commitments.
- A significant segment (32.8%) caters to monthly stays (30+ nights) in Valdisotto, pointing to opportunities in the extended-stay market.
Recommendations
- Align with the market by considering a 30+ Nights minimum stay, as 32.8% of Valdisotto hosts use this setting.
- If feasible, allowing 1-night stays, especially midweek or during low season, could capture last-minute bookings, as only 19.5% currently do.
- Explore offering discounts for stays of 30+ nights to attract the 32.8% of the market seeking extended stays.
- Adjust minimum nights based on seasonality – potentially shorter during low season and longer during peak demand periods in Valdisotto.
Valdisotto Airbnb Cancellation Policy Trends Analysis (2025)
Super Strict 30 Days
3 listings
2.5% of total
Super Strict 60 Days
5 listings
4.2% of total
Flexible
20 listings
16.8% of total
Moderate
64 listings
53.8% of total
Strict
27 listings
22.7% of total
Cancellation Policy Insights for Valdisotto
- The prevailing Airbnb cancellation policy trend in Valdisotto is Moderate, used by 53.8% of listings.
- The market strongly favors guest-friendly terms, with 70.6% of listings offering Flexible or Moderate policies. This suggests guests in Valdisotto may expect booking flexibility.
Recommendations for Hosts
- Consider adopting a Moderate policy to align with the 53.8% market standard in Valdisotto.
- Regularly review your cancellation policy against competitors and market demand shifts in Valdisotto.
Valdisotto STR Booking Lead Time Analysis (2025)
Average Booking Lead Time by Month
Booking Lead Time Insights for Valdisotto
- The overall average booking lead time for vacation rentals in Valdisotto is 63 days.
- Guests book furthest in advance for stays during August (average 80 days), likely coinciding with peak travel demand or local events.
- The shortest booking windows occur for stays in October (average 31 days), indicating more last-minute travel plans during this time.
- Seasonally, Summer (77 days avg.) sees the longest lead times, while Fall (40 days avg.) has the shortest, reflecting typical travel planning cycles.
Recommendations for Hosts
- Use the overall average lead time (63 days) as a baseline for your pricing and availability strategy in Valdisotto.
- For August stays, consider implementing length-of-stay discounts or slightly higher rates for bookings made less than 80 days out to capitalize on advance planning.
- Target marketing efforts for the Summer season well in advance (at least 77 days) to capture early planners.
- Monitor your own booking lead times against these Valdisotto averages to identify opportunities for dynamic pricing adjustments.
Popular & Essential Airbnb Amenities in Valdisotto (2025)
Amenity Prevalence
Amenity Insights for Valdisotto
- Essential amenities in Valdisotto that guests expect include: TV, Kitchen. Lacking these (any) could significantly impact bookings.
- Popular amenities like Heating, Hot water, Essentials are common but not universal. Offering these can provide a competitive edge.
- Warning: Wifi is not universally provided but is considered essential globally. Ensure reliable Wifi is offered.
Recommendations for Hosts
- Ensure your listing includes all essential amenities for Valdisotto: TV, Kitchen.
- Prioritize adding missing essentials: TV, Kitchen.
- Consider adding popular differentiators like Heating or Hot water to increase appeal.
- Highlight unique or less common amenities you offer (e.g., hot tub, dedicated workspace, EV charger) in your listing description and photos.
- Regularly check competitor amenities in Valdisotto to stay competitive.
Valdisotto Airbnb Guest Demographics & Profile Analysis (2025)
Guest Profile Summary for Valdisotto
- The typical guest profile for Airbnb in Valdisotto consists of a mix of domestic (56%) and international guests, often arriving from nearby Milan, typically belonging to the Post-2000s (Gen Z/Alpha) group (50%), primarily speaking English or Italian.
- Domestic travelers account for 56.3% of guests.
- Key international markets include Italy (56.3%) and United Kingdom (6.7%).
- Top languages spoken are English (39.4%) followed by Italian (24.7%).
- A significant demographic segment is the Post-2000s (Gen Z/Alpha) group, representing 50% of guests.
Recommendations for Hosts
- Balance marketing efforts between domestic and international channels based on the guest mix.
- Tailor amenities and listing descriptions to appeal to the dominant Post-2000s (Gen Z/Alpha) demographic (e.g., highlight fast WiFi, smart home features, local guides).
- Highlight unique local experiences or amenities relevant to the primary guest profile.
- Consider seasonal promotions aligned with peak travel times for key origin markets.
Nearby Short-Term Rental Market Comparison
How does the Valdisotto Airbnb market stack up against its neighbors? Compare key performance metrics like average monthly revenue, ADR, and occupancy rates in surrounding areas to understand the broader regional STR landscape.
| Market | Active Properties | Monthly Revenue | Daily Rate | Avg. Occupancy |
|---|---|---|---|---|
| Laglio | 64 | $4,873 | $463.61 | 47% |
| Bayrischzell | 30 | $4,718 | $392.87 | 42% |
| Urtijëi - St. Ulrich in Gröden - Ortisei | 163 | $4,698 | $630.45 | 40% |
| Moos in Passeier - Moso in Passiria | 17 | $4,619 | $547.60 | 27% |
| Steinberg am Rofan | 11 | $4,394 | $311.71 | 40% |
| Brenzone sul Garda | 19 | $4,128 | $335.25 | 52% |
| Bürserberg | 40 | $3,978 | $342.57 | 41% |
| Sala Comacina | 64 | $3,794 | $400.27 | 50% |
| Bellagio | 373 | $3,630 | $328.26 | 55% |
| Brand | 56 | $3,597 | $486.13 | 33% |