Tignale Airbnb Market Analysis 2025: Short Term Rental Data & Vacation Rental Statistics in Lombardy, Italy
Is Airbnb profitable in Tignale in 2025? Explore comprehensive Airbnb analytics for Tignale, Lombardy, Italy to uncover income potential. This 2025 STR market report for Tignale, based on AirROI data from April 2024 to March 2025, reveals key trends in the market of 202 active listings.
Whether you're considering an Airbnb investment in Tignale, optimizing your existing vacation rental, or exploring rental arbitrage opportunities, understanding the Tignale Airbnb data is crucial. Navigating the high regulation landscape is key to maximizing your short term rental income potential. Let's dive into the specifics.
Key Tignale Airbnb Performance Metrics Overview
Monthly Airbnb Revenue Variations & Income Potential in Tignale (2025)
Understanding the monthly revenue variations for Airbnb listings in Tignale is key to maximizing your short term rental income potential. Seasonality significantly impacts earnings. Our analysis, based on data from the past 12 months, shows that the peak revenue month for STRs in Tignale is typically August, while February often presents the lowest earnings, highlighting opportunities for strategic pricing adjustments during shoulder and low seasons. Explore the typical Airbnb income in Tignale across different performance tiers:
- Best-in-class properties (Top 10%) achieve $3,338+ monthly, often utilizing dynamic pricing and superior guest experiences.
- Strong performing properties (Top 25%) earn $2,126 or more, indicating effective management and desirable locations/amenities.
- Typical properties (Median) generate around $1,234 per month, representing the average market performance.
- Entry-level properties (Bottom 25%) see earnings around $609, often with potential for optimization.
Average Monthly Airbnb Earnings Trend in Tignale
Tignale Airbnb Occupancy Rate Trends (2025)
Maximize your bookings by understanding the Tignale STR occupancy trends. Seasonal demand shifts significantly influence how often properties are booked. Typically, Augustsees the highest demand (peak season occupancy), while March experiences the lowest (low season). Effective strategies, like adjusting minimum stays or offering promotions, can boost occupancy during slower periods. Here's how different property tiers perform in Tignale:
- Best-in-class properties (Top 10%) achieve 73%+ occupancy, indicating high desirability and potentially optimized availability.
- Strong performing properties (Top 25%) maintain 52% or higher occupancy, suggesting good market fit and guest satisfaction.
- Typical properties (Median) have an occupancy rate around 32%.
- Entry-level properties (Bottom 25%) average 14% occupancy, potentially facing higher vacancy.
Average Monthly Occupancy Rate Trend in Tignale
Average Daily Rate (ADR) Airbnb Trends in Tignale (2025)
Effective short term rental pricing strategy in Tignale involves understanding monthly ADR fluctuations. The Average Daily Rate (ADR) for Airbnb in Tignale typically peaks in August and dips lowest during April. Leveraging Airbnb dynamic pricing tools or strategies based on this seasonality can significantly boost revenue. Here's a look at the typical nightly rates achieved:
- Best-in-class properties (Top 10%) command rates of $246+ per night, often due to premium features or locations.
- Strong performing properties (Top 25%) achieve nightly rates of $153 or more.
- Typical properties (Median) charge around $111 per night.
- Entry-level properties (Bottom 25%) earn around $89 per night.
Average Daily Rate (ADR) Trend by Month in Tignale
Get Live Tignale Market Intelligence 👇

Explore Real-time Analytics
Airbnb Seasonality Analysis & Trends in Tignale (2025)
Peak Season (August, July, June)
- Revenue averages $2,890 per month
- Occupancy rates average 53.3%
- Daily rates average $172
Shoulder Season
- Revenue averages $1,511 per month
- Occupancy maintains around 35.2%
- Daily rates hold near $148
Low Season (February, March, December)
- Revenue drops to average $747 per month
- Occupancy decreases to average 19.9%
- Daily rates adjust to average $146
Seasonality Insights for Tignale
- The Airbnb seasonality in Tignale shows highly seasonal trends requiring careful strategy. While the sections above show seasonal averages, it's also insightful to look at the extremes:
- During the high season, the absolute peak month showcases Tignale's highest earning potential, with monthly revenues capable of climbing to $3,306, occupancy reaching a high of 62.1%, and ADRs peaking at $179.
- Conversely, the slowest single month of the year, typically falling within the low season, marks the market's lowest point. In this month, revenue might dip to $693, occupancy could drop to 18.2%, and ADRs may adjust down to $141.
- Understanding both the seasonal averages and these monthly peaks and troughs in revenue, occupancy, and ADR is crucial for maximizing your Airbnb profit potential in Tignale.
Seasonal Strategies for Maximizing Profit
- Peak Season: Maximize revenue through premium pricing and potentially longer minimum stays. Ensure high availability.
- Low Season: Offer competitive pricing, special promotions (e.g., extended stay discounts), and flexible cancellation policies. Target off-season travelers like remote workers or budget-conscious guests.
- Shoulder Seasons: Implement dynamic pricing that balances peak and low rates. Target weekend travelers or specific events. Offer slightly more flexible terms than peak season.
- Regularly analyze your own performance against these Tignale seasonality benchmarks and adjust your pricing and availability strategy accordingly.
Best Areas for Airbnb Investment in Tignale (2025)
Exploring the top neighborhoods for short-term rentals in Tignale? This section highlights key areas, outlining why they are attractive for hosts and guests, along with notable local attractions. Consider these locations based on your target guest profile and investment strategy.
| Neighborhood / Area | Why Host Here? (Target Guests & Appeal) | Key Attractions & Landmarks |
|---|---|---|
| Pieve di Tignale | Charming village with stunning views of Lake Garda, popular for its scenic beauty and tranquility. Attracts visitors looking for a peaceful retreat and nature activities. | Chiesa di San Pietro, Sentiero del Ponale, Lake Garda, Nature trails, Local restaurants |
| Tignale | Situated high above Lake Garda, known for its picturesque landscapes and hiking opportunities. A great spot for outdoor enthusiasts and families. | Parco Alto Garda Bresciano, Local markets, Hiking trails, Cafes with lake views, Tignale Castle |
| Boca di Tignale | This picturesque area offers direct access to the lake and stunning natural scenery. Ideal for watersports enthusiasts and tourists seeking relaxation by the water. | Beach access, Watersports, Scenic viewpoints, Rural landscapes, Local cuisine |
| Gardola | The largest settlement in Tignale, Gardola boasts a rich history and offers various amenities. It’s great for visitors who want a mix of culture and nature. | Historical sites, Church of San Lorenzo, Local shops, Restaurants, Cultural events |
| Tignale's Nature Park | A beautiful nature park that provides a serene environment for hiking, biking, and exploring the local flora and fauna. | Hiking trails, Wildlife viewing, Picnic areas, Biking routes, Nature photography spots |
| Local Vineyards | Tignale and surrounding areas are known for their wineries, attracting wine enthusiasts and those interested in local gastronomy. | Vineyard tours, Wine tastings, Local dishes, Culinary workshops, Beautiful landscapes |
| Lakeside Promenade | The promenade along Lake Garda is perfect for leisurely strolls, dining, and enjoying the sun. It's a popular spot for tourists throughout the year. | Walking paths, Lakeside restaurants, Scenic views, Boat tours, Sunbathing spots |
| Nearby Towns (like Limone sul Garda) | Just a short distance from Tignale, these charming towns offer additional attractions and cultural experiences for visitors. | Limone sul Garda, Historical landmarks, Craft shops, Local festivals, Scenic drives |
Understanding Airbnb License Requirements & STR Laws in Tignale (2025)
Yes, Tignale, Lombardy, Italy enforces high STR regulations. Obtaining a license and ensuring compliance is almost certainly required according to current 2025 STR laws. Always verify the latest short term rental regulations and Airbnb license requirements directly with local government authorities for Tignale to ensure full compliance before hosting.
(Source: AirROI data, 2025, based on 69% licensed listings)
Top Performing Airbnb Properties in Tignale (2025)
Benchmark your potential! Explore examples of top-performing Airbnb properties in Tignalebased on Trailing Twelve Month (TTM) revenue. Analyze their characteristics, revenue, occupancy rate, and ADR to understand what drives success in this market.
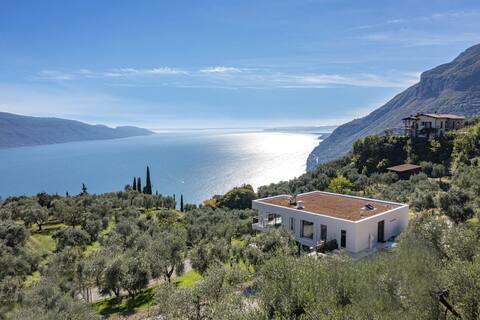
Villa with a breathtaking lake view in Tignale
Entire Place • 4 bedrooms

Villa Pineta
Entire Place • 6 bedrooms
Rustic Spanish 1
Entire Place • 2 bedrooms

La casa delle Rondini. 017185-LNI-00006
Entire Place • 4 bedrooms

Verdeulivo Relax Home-FrantoioTrilo lake view apartment
Entire Place • 2 bedrooms
Villa Ada
Entire Place • 5 bedrooms
Note: Performance varies based on location, size, amenities, seasonality, and management quality. Data reflects the past 12 months.
Top Performing Airbnb Hosts in Tignale (2025)
Learn from the best! This table showcases top-performing Airbnb hosts in Tignale based on the number of properties managed and estimated total revenue over the past year. Analyze their scale and performance metrics.
| Host Name | Properties | Grossing Revenue | Stay Reviews | Avg Rating |
|---|---|---|---|---|
| Marcella | 39 | $486,644 | 307 | 3.82/5.0 |
| Anna & Cristina | 16 | $258,069 | 290 | 4.84/5.0 |
| Isabella & Family | 7 | $185,972 | 300 | 4.19/5.0 |
| Elga | 12 | $154,939 | 85 | 3.42/5.0 |
| Villa Oliva | 1 | $84,506 | 3 | 5.00/5.0 |
| Daniela | 5 | $84,071 | 131 | 3.89/5.0 |
| Holidu | 2 | $81,909 | 26 | 4.62/5.0 |
| Ferienhausvermittlung Anita Wo | 10 | $66,791 | 24 | 2.23/5.0 |
| BnB Borgo | 4 | $61,230 | 43 | 4.98/5.0 |
| Carlo | 5 | $60,174 | 322 | 4.86/5.0 |
Analyzing the strategies of top hosts, such as their property selection, pricing, and guest communication, can offer valuable lessons for optimizing your own Airbnb operations in Tignale.
Dive Deeper: Advanced Tignale STR Market Data (2025)
Ready to unlock more insights? AirROI provides access to advanced metrics and comprehensive Airbnb data for Tignale. Explore detailed analytics beyond this report to refine your investment strategy, optimize pricing, and maximize your vacation rental profits.
Explore Advanced MetricsTignale Short-Term Rental Market Composition (2025): Property & Room Types
Room Type Distribution
Property Type Distribution
Market Composition Insights for Tignale
- The Tignale Airbnb market composition is heavily skewed towards Entire Home/Apt listings, which make up 98% of the 202 active rentals. This indicates strong guest preference for privacy and space.
- Looking at the property type distribution in Tignale, Apartment/Condo properties are the most common (81.7%), reflecting the local real estate landscape.
- Houses represent a significant 17.3% portion, catering likely to families or larger groups.
- Smaller segments like others, outdoor/unique (combined 1.0%) offer potential for unique stay experiences.
Tignale Airbnb Room Capacity Analysis (2025): Bedroom Distribution
Distribution of Listings by Number of Bedrooms
Room Capacity Insights for Tignale
- The dominant room capacity in Tignale is 2 bedrooms listings, making up 53.5% of the market. This suggests a strong demand for properties suitable for couples or solo travelers.
- Together, 2 bedrooms and 1 bedroom properties represent 86.2% of the active Airbnb listings in Tignale, indicating a high concentration in these sizes.
Tignale Vacation Rental Guest Capacity Trends (2025)
Distribution of Listings by Guest Capacity
Guest Capacity Insights for Tignale
- The most common guest capacity trend in Tignale vacation rentals is listings accommodating 4 guests (49.5%). This suggests the primary traveler segment is likely small families or groups.
- Properties designed for 4 guests and 6 guests dominate the Tignale STR market, accounting for 68.3% of listings.
- 24.8% of properties accommodate 6+ guests, serving the market segment for larger families or group travel in Tignale.
- On average, properties in Tignale are equipped to host 4.4 guests.
Tignale Airbnb Booking Patterns (2025): Available vs. Booked Days
Available Days Distribution
Booked Days Distribution
Booking Pattern Insights for Tignale
- The most common availability pattern in Tignale falls within the 271-366 days range, representing 59.9% of listings. This suggests many properties have significant open periods on their calendars.
- Approximately 90.1% of listings show high availability (181+ days open annually), indicating potential for increased bookings or specific owner usage patterns.
- For booked days, the 31-90 days range is most frequent in Tignale (33.2%), reflecting common guest stay durations or potential owner blocking patterns.
- A notable 11.4% of properties secure long booking periods (181+ days booked per year), highlighting successful long-term rental strategies or significant owner usage.
Tignale Airbnb Minimum Stay Requirements Analysis
Distribution of Listings by Minimum Night Requirement
1 Night
76 listings
40.6% of total
2 Nights
7 listings
3.7% of total
3 Nights
20 listings
10.7% of total
4-6 Nights
45 listings
24.1% of total
7-29 Nights
25 listings
13.4% of total
30+ Nights
14 listings
7.5% of total
Key Insights
- The most prevalent minimum stay requirement in Tignale is 1 Night, adopted by 40.6% of listings. This highlights the market's preference for shorter, flexible bookings.
Recommendations
- Align with the market by considering a 1 Night minimum stay, as 40.6% of Tignale hosts use this setting.
- Explore offering discounts for stays of 30+ nights to attract the 7.5% of the market seeking extended stays.
- Adjust minimum nights based on seasonality – potentially shorter during low season and longer during peak demand periods in Tignale.
Tignale Airbnb Cancellation Policy Trends Analysis (2025)
Super Strict 30 Days
27 listings
16.2% of total
Super Strict 60 Days
39 listings
23.4% of total
Flexible
17 listings
10.2% of total
Moderate
50 listings
29.9% of total
Strict
34 listings
20.4% of total
Cancellation Policy Insights for Tignale
- The prevailing Airbnb cancellation policy trend in Tignale is Moderate, used by 29.9% of listings.
- There's a relatively balanced mix between guest-friendly (40.1%) and stricter (20.4%) policies, offering choices for different guest needs.
Recommendations for Hosts
- Consider adopting a Moderate policy to align with the 29.9% market standard in Tignale.
- Regularly review your cancellation policy against competitors and market demand shifts in Tignale.
Tignale STR Booking Lead Time Analysis (2025)
Average Booking Lead Time by Month
Booking Lead Time Insights for Tignale
- The overall average booking lead time for vacation rentals in Tignale is 103 days.
- Guests book furthest in advance for stays during July (average 140 days), likely coinciding with peak travel demand or local events.
- The shortest booking windows occur for stays in March (average 63 days), indicating more last-minute travel plans during this time.
- Seasonally, Summer (129 days avg.) sees the longest lead times, while Winter (87 days avg.) has the shortest, reflecting typical travel planning cycles.
Recommendations for Hosts
- Use the overall average lead time (103 days) as a baseline for your pricing and availability strategy in Tignale.
- For July stays, consider implementing length-of-stay discounts or slightly higher rates for bookings made less than 140 days out to capitalize on advance planning.
- Target marketing efforts for the Summer season well in advance (at least 129 days) to capture early planners.
- Monitor your own booking lead times against these Tignale averages to identify opportunities for dynamic pricing adjustments.
Popular & Essential Airbnb Amenities in Tignale (2025)
Amenity Prevalence
Amenity Insights for Tignale
- Essential amenities in Tignale that guests expect include: Wifi, Kitchen, TV. Lacking these (any) could significantly impact bookings.
- Popular amenities like Refrigerator, Dishes and silverware, Heating are common but not universal. Offering these can provide a competitive edge.
Recommendations for Hosts
- Ensure your listing includes all essential amenities for Tignale: Wifi, Kitchen, TV.
- Prioritize adding missing essentials: Wifi, Kitchen, TV.
- Consider adding popular differentiators like Refrigerator or Dishes and silverware to increase appeal.
- Highlight unique or less common amenities you offer (e.g., hot tub, dedicated workspace, EV charger) in your listing description and photos.
- Regularly check competitor amenities in Tignale to stay competitive.
Tignale Airbnb Guest Demographics & Profile Analysis (2025)
Guest Profile Summary for Tignale
- The typical guest profile for Airbnb in Tignale consists of predominantly international visitors (96%), with top international origins including France, typically belonging to the Post-2000s (Gen Z/Alpha) group (50%), primarily speaking English or German.
- Domestic travelers account for 4.1% of guests.
- Key international markets include Germany (54.8%) and France (6.9%).
- Top languages spoken are English (39.7%) followed by German (27%).
- A significant demographic segment is the Post-2000s (Gen Z/Alpha) group, representing 50% of guests.
Recommendations for Hosts
- Focus marketing internationally, particularly towards travelers from France.
- Tailor amenities and listing descriptions to appeal to the dominant Post-2000s (Gen Z/Alpha) demographic (e.g., highlight fast WiFi, smart home features, local guides).
- Highlight unique local experiences or amenities relevant to the primary guest profile.
- Consider seasonal promotions aligned with peak travel times for key origin markets.
Nearby Short-Term Rental Market Comparison
How does the Tignale Airbnb market stack up against its neighbors? Compare key performance metrics like average monthly revenue, ADR, and occupancy rates in surrounding areas to understand the broader regional STR landscape.
| Market | Active Properties | Monthly Revenue | Daily Rate | Avg. Occupancy |
|---|---|---|---|---|
| Laglio | 64 | $4,873 | $463.61 | 47% |
| Urtijëi - St. Ulrich in Gröden - Ortisei | 163 | $4,698 | $630.45 | 40% |
| Moos in Passeier - Moso in Passiria | 17 | $4,619 | $547.60 | 27% |
| Brenzone sul Garda | 19 | $4,128 | $335.25 | 52% |
| Portofino | 68 | $4,086 | $454.35 | 44% |
| Sala Comacina | 64 | $3,794 | $400.27 | 50% |
| Bellagio | 373 | $3,630 | $328.26 | 55% |
| Oliveto Lario | 99 | $3,509 | $327.42 | 55% |
| Varenna | 216 | $3,419 | $272.27 | 56% |
| Carate Urio | 71 | $3,379 | $331.90 | 44% |