San Giuliano Milanese Airbnb Market Analysis 2025: Short Term Rental Data & Vacation Rental Statistics in Lombardy, Italy
Is Airbnb profitable in San Giuliano Milanese in 2025? Explore comprehensive Airbnb analytics for San Giuliano Milanese, Lombardy, Italy to uncover income potential. This 2025 STR market report for San Giuliano Milanese, based on AirROI data from April 2024 to March 2025, reveals key trends in the niche market of 35 active listings.
Whether you're considering an Airbnb investment in San Giuliano Milanese, optimizing your existing vacation rental, or exploring rental arbitrage opportunities, understanding the San Giuliano Milanese Airbnb data is crucial. Navigating the high regulation landscape is key to maximizing your short term rental income potential. Let's dive into the specifics.
Key San Giuliano Milanese Airbnb Performance Metrics Overview
Monthly Airbnb Revenue Variations & Income Potential in San Giuliano Milanese (2025)
Understanding the monthly revenue variations for Airbnb listings in San Giuliano Milanese is key to maximizing your short term rental income potential. Seasonality significantly impacts earnings. Our analysis, based on data from the past 12 months, shows that the peak revenue month for STRs in San Giuliano Milanese is typically May, while February often presents the lowest earnings, highlighting opportunities for strategic pricing adjustments during shoulder and low seasons. Explore the typical Airbnb income in San Giuliano Milanese across different performance tiers:
- Best-in-class properties (Top 10%) achieve $2,643+ monthly, often utilizing dynamic pricing and superior guest experiences.
- Strong performing properties (Top 25%) earn $2,100 or more, indicating effective management and desirable locations/amenities.
- Typical properties (Median) generate around $1,278 per month, representing the average market performance.
- Entry-level properties (Bottom 25%) see earnings around $617, often with potential for optimization.
Average Monthly Airbnb Earnings Trend in San Giuliano Milanese
San Giuliano Milanese Airbnb Occupancy Rate Trends (2025)
Maximize your bookings by understanding the San Giuliano Milanese STR occupancy trends. Seasonal demand shifts significantly influence how often properties are booked. Typically, Maysees the highest demand (peak season occupancy), while March experiences the lowest (low season). Effective strategies, like adjusting minimum stays or offering promotions, can boost occupancy during slower periods. Here's how different property tiers perform in San Giuliano Milanese:
- Best-in-class properties (Top 10%) achieve 79%+ occupancy, indicating high desirability and potentially optimized availability.
- Strong performing properties (Top 25%) maintain 65% or higher occupancy, suggesting good market fit and guest satisfaction.
- Typical properties (Median) have an occupancy rate around 41%.
- Entry-level properties (Bottom 25%) average 22% occupancy, potentially facing higher vacancy.
Average Monthly Occupancy Rate Trend in San Giuliano Milanese
Average Daily Rate (ADR) Airbnb Trends in San Giuliano Milanese (2025)
Effective short term rental pricing strategy in San Giuliano Milanese involves understanding monthly ADR fluctuations. The Average Daily Rate (ADR) for Airbnb in San Giuliano Milanese typically peaks in November and dips lowest during September. Leveraging Airbnb dynamic pricing tools or strategies based on this seasonality can significantly boost revenue. Here's a look at the typical nightly rates achieved:
- Best-in-class properties (Top 10%) command rates of $136+ per night, often due to premium features or locations.
- Strong performing properties (Top 25%) achieve nightly rates of $98 or more.
- Typical properties (Median) charge around $82 per night.
- Entry-level properties (Bottom 25%) earn around $66 per night.
Average Daily Rate (ADR) Trend by Month in San Giuliano Milanese
Get Live San Giuliano Milanese Market Intelligence 👇

Explore Real-time Analytics
Airbnb Seasonality Analysis & Trends in San Giuliano Milanese (2025)
Peak Season (May, June, April)
- Revenue averages $2,068 per month
- Occupancy rates average 47.5%
- Daily rates average $90
Shoulder Season
- Revenue averages $1,426 per month
- Occupancy maintains around 45.7%
- Daily rates hold near $101
Low Season (February, March, September)
- Revenue drops to average $1,177 per month
- Occupancy decreases to average 38.3%
- Daily rates adjust to average $102
Seasonality Insights for San Giuliano Milanese
- The Airbnb seasonality in San Giuliano Milanese shows highly seasonal trends requiring careful strategy. While the sections above show seasonal averages, it's also insightful to look at the extremes:
- During the high season, the absolute peak month showcases San Giuliano Milanese's highest earning potential, with monthly revenues capable of climbing to $2,483, occupancy reaching a high of 58.5%, and ADRs peaking at $116.
- Conversely, the slowest single month of the year, typically falling within the low season, marks the market's lowest point. In this month, revenue might dip to $1,131, occupancy could drop to 32.5%, and ADRs may adjust down to $88.
- Understanding both the seasonal averages and these monthly peaks and troughs in revenue, occupancy, and ADR is crucial for maximizing your Airbnb profit potential in San Giuliano Milanese.
Seasonal Strategies for Maximizing Profit
- Peak Season: Maximize revenue through premium pricing and potentially longer minimum stays. Ensure high availability.
- Low Season: Offer competitive pricing, special promotions (e.g., extended stay discounts), and flexible cancellation policies. Target off-season travelers like remote workers or budget-conscious guests.
- Shoulder Seasons: Implement dynamic pricing that balances peak and low rates. Target weekend travelers or specific events. Offer slightly more flexible terms than peak season.
- Regularly analyze your own performance against these San Giuliano Milanese seasonality benchmarks and adjust your pricing and availability strategy accordingly.
Best Areas for Airbnb Investment in San Giuliano Milanese (2025)
Exploring the top neighborhoods for short-term rentals in San Giuliano Milanese? This section highlights key areas, outlining why they are attractive for hosts and guests, along with notable local attractions. Consider these locations based on your target guest profile and investment strategy.
| Neighborhood / Area | Why Host Here? (Target Guests & Appeal) | Key Attractions & Landmarks |
|---|---|---|
| Centro Storico | The heart of San Giuliano Milanese, offering historical sites and easy access to public transport. Ideal for visitors wanting a taste of local culture and cuisine, with a variety of shops and restaurants. | Piazza della Repubblica, San Giuliano Church, Local eateries, Public parks, Transport links to Milan |
| San Giuliano Parco | A charming area with green spaces and parks, perfect for families and nature lovers. Known for its tranquility while still being close to the city center. | Parco del Lambro, Playgrounds, Walking trails, Sporting facilities, Picnic areas |
| Via Roma | A bustling commercial street with shops, cafes, and amenities. A perfect spot for guests looking for convenience and vibrant city life. | Shops and boutiques, Local markets, Cafes, Restaurants, Public transport access |
| Cascina Fagnana | A lovely suburban area with a traditional Italian feel. Attractive for longer stays with a blend of modernity and heritage, appealing to families and remote workers. | Cascina Fagnana, Local vineyards, Quiet streets, Community events, Nature walks |
| Viale Europa | A modern area with newer developments and easy access to main roads. Ideal for business travelers and those seeking a suburban experience close to the city. | Shopping centers, Business hubs, Restaurants, Parks, Public transport |
| San Carlo | A quieter residential neighborhood ideal for longer Airbnb stays. Guests appreciate the local community feel and easy transport links into Milan. | Local parks, Quiet streets, Community centers, Transport links, Various local shops |
| Scalo di Porta Romana | With infrastructural expansions, this area is gaining popularity among tourists seeking urban proximity while enjoying a more local ambiance. | New transport connections, Shopping facilities, Restaurants, Cultural attractions, Green spaces |
| Via Garibaldi | A historic street lined with restaurants and cultural landmarks. Ideal for tourists who want to immerse themselves in local history and experience authentic cuisine. | Historic buildings, Local restaurants, Art installations, Tourist information centers, Public transport access |
Understanding Airbnb License Requirements & STR Laws in San Giuliano Milanese (2025)
Yes, San Giuliano Milanese, Lombardy, Italy enforces high STR regulations. Obtaining a license and ensuring compliance is almost certainly required according to current 2025 STR laws. Always verify the latest short term rental regulations and Airbnb license requirements directly with local government authorities for San Giuliano Milanese to ensure full compliance before hosting.
(Source: AirROI data, 2025, based on 40% licensed listings)
Top Performing Airbnb Properties in San Giuliano Milanese (2025)
Benchmark your potential! Explore examples of top-performing Airbnb properties in San Giuliano Milanesebased on Trailing Twelve Month (TTM) revenue. Analyze their characteristics, revenue, occupancy rate, and ADR to understand what drives success in this market.
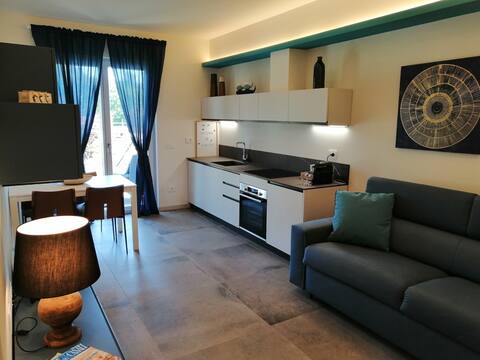
![[San Donato Hospital - Milano Linate Airport]](https://a0.muscache.com/im/pictures/miso/Hosting-1145528215208187285/original/ed4ef047-7e8e-4ba7-b75f-efa7866daafe.jpeg?im_w=480&im_format=avif)
[San Donato Hospital - Milano Linate Airport]
Entire Place • N/A
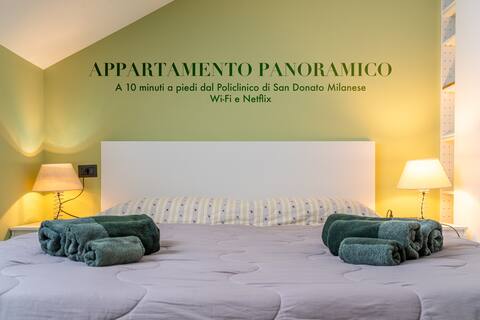
NEW apartment with private garden
Entire Place • 1 bedroom
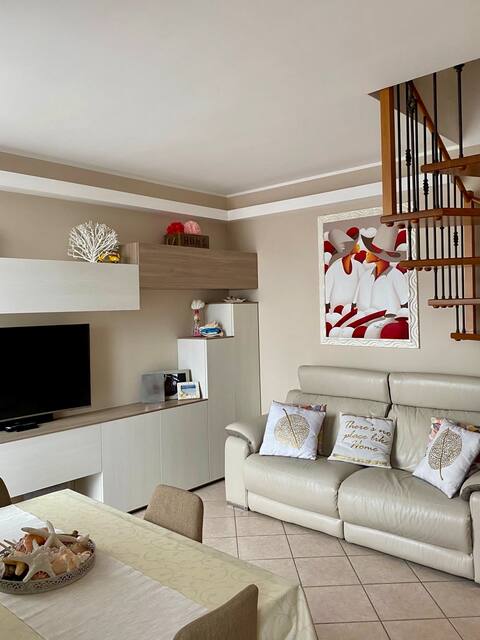
Scenic apartment
Entire Place • 2 bedrooms
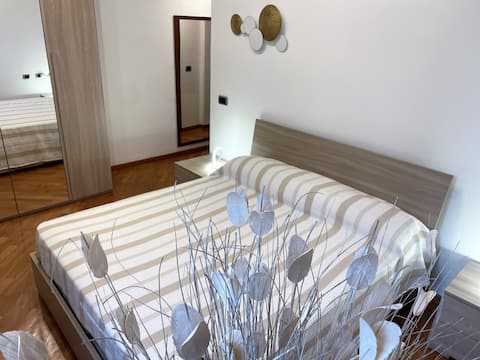
PACY - Park City Home
Entire Place • 2 bedrooms
Apartment S. Giuliano M. se Piazza Brivio
Entire Place • 1 bedroom

casavacanza lucrezia 2
Entire Place • 1 bedroom
Note: Performance varies based on location, size, amenities, seasonality, and management quality. Data reflects the past 12 months.
Top Performing Airbnb Hosts in San Giuliano Milanese (2025)
Learn from the best! This table showcases top-performing Airbnb hosts in San Giuliano Milanese based on the number of properties managed and estimated total revenue over the past year. Analyze their scale and performance metrics.
| Host Name | Properties | Grossing Revenue | Stay Reviews | Avg Rating |
|---|---|---|---|---|
| Host #297581962 | 1 | $38,548 | 7 | 5.00/5.0 |
| Barbara | 1 | $25,545 | 52 | 4.92/5.0 |
| Fausto | 1 | $23,635 | 8 | 5.00/5.0 |
| Paolo | 1 | $23,278 | 9 | 4.89/5.0 |
| Fa.Sa. | 1 | $23,181 | 6 | 4.67/5.0 |
| Frank | 1 | $22,455 | 26 | 4.65/5.0 |
| Antonello | 1 | $19,144 | 180 | 4.93/5.0 |
| Host #66020906 | 2 | $17,963 | 22 | 2.38/5.0 |
| Silvia | 1 | $17,606 | 22 | 4.91/5.0 |
| Nicoletta | 1 | $17,282 | 5 | 5.00/5.0 |
Analyzing the strategies of top hosts, such as their property selection, pricing, and guest communication, can offer valuable lessons for optimizing your own Airbnb operations in San Giuliano Milanese.
Dive Deeper: Advanced San Giuliano Milanese STR Market Data (2025)
Ready to unlock more insights? AirROI provides access to advanced metrics and comprehensive Airbnb data for San Giuliano Milanese. Explore detailed analytics beyond this report to refine your investment strategy, optimize pricing, and maximize your vacation rental profits.
Explore Advanced MetricsSan Giuliano Milanese Short-Term Rental Market Composition (2025): Property & Room Types
Room Type Distribution
Property Type Distribution
Market Composition Insights for San Giuliano Milanese
- The San Giuliano Milanese Airbnb market composition is heavily skewed towards Entire Home/Apt listings, which make up 77.1% of the 35 active rentals. This indicates strong guest preference for privacy and space.
- Looking at the property type distribution in San Giuliano Milanese, Apartment/Condo properties are the most common (82.9%), reflecting the local real estate landscape.
- Smaller segments like hotel/boutique (combined 2.9%) offer potential for unique stay experiences.
San Giuliano Milanese Airbnb Room Capacity Analysis (2025): Bedroom Distribution
Distribution of Listings by Number of Bedrooms
Room Capacity Insights for San Giuliano Milanese
- The dominant room capacity in San Giuliano Milanese is 1 bedroom listings, making up 60% of the market. This suggests a strong demand for properties suitable for couples or solo travelers.
- Together, 1 bedroom and 2 bedrooms properties represent 91.4% of the active Airbnb listings in San Giuliano Milanese, indicating a high concentration in these sizes.
- With over half the market (60%) consisting of studios or 1-bedroom units, San Giuliano Milanese is particularly well-suited for individuals or couples.
- Listings with 3+ bedrooms (2.9%) represent a smaller niche, potentially indicating an underserved market for larger group accommodations in San Giuliano Milanese.
San Giuliano Milanese Vacation Rental Guest Capacity Trends (2025)
Distribution of Listings by Guest Capacity
Guest Capacity Insights for San Giuliano Milanese
- The most common guest capacity trend in San Giuliano Milanese vacation rentals is listings accommodating 2 guests (31.4%). This suggests the primary traveler segment is likely couples or solo travelers.
- Properties designed for 2 guests and 4 guests dominate the San Giuliano Milanese STR market, accounting for 57.1% of listings.
- On average, properties in San Giuliano Milanese are equipped to host 3.1 guests.
San Giuliano Milanese Airbnb Booking Patterns (2025): Available vs. Booked Days
Available Days Distribution
Booked Days Distribution
Booking Pattern Insights for San Giuliano Milanese
- The most common availability pattern in San Giuliano Milanese falls within the 271-366 days range, representing 48.6% of listings. This suggests many properties have significant open periods on their calendars.
- Approximately 80.0% of listings show high availability (181+ days open annually), indicating potential for increased bookings or specific owner usage patterns.
- For booked days, the 31-90 days range is most frequent in San Giuliano Milanese (25.7%), reflecting common guest stay durations or potential owner blocking patterns.
- A notable 25.8% of properties secure long booking periods (181+ days booked per year), highlighting successful long-term rental strategies or significant owner usage.
San Giuliano Milanese Airbnb Minimum Stay Requirements Analysis
Distribution of Listings by Minimum Night Requirement
1 Night
9 listings
34.6% of total
2 Nights
9 listings
34.6% of total
3 Nights
1 listings
3.8% of total
7-29 Nights
6 listings
23.1% of total
30+ Nights
1 listings
3.8% of total
Key Insights
- The most prevalent minimum stay requirement in San Giuliano Milanese is 1 Night, adopted by 34.6% of listings. This highlights the market's preference for shorter, flexible bookings.
- A strong majority (69.2%) of the San Giuliano Milanese Airbnb data shows acceptance of very short stays (1-2 nights), indicating a dynamic, high-turnover market.
Recommendations
- Align with the market by considering a 1 Night minimum stay, as 34.6% of San Giuliano Milanese hosts use this setting.
- Adjust minimum nights based on seasonality – potentially shorter during low season and longer during peak demand periods in San Giuliano Milanese.
San Giuliano Milanese Airbnb Cancellation Policy Trends Analysis (2025)
Flexible
10 listings
43.5% of total
Moderate
10 listings
43.5% of total
Strict
3 listings
13% of total
Cancellation Policy Insights for San Giuliano Milanese
- The prevailing Airbnb cancellation policy trend in San Giuliano Milanese is Flexible, used by 43.5% of listings.
- The market strongly favors guest-friendly terms, with 87.0% of listings offering Flexible or Moderate policies. This suggests guests in San Giuliano Milanese may expect booking flexibility.
Recommendations for Hosts
- Consider adopting a Flexible policy to align with the 43.5% market standard in San Giuliano Milanese.
- Using a Strict policy might deter some guests, as only 13% of listings use it. Evaluate if potential revenue protection outweighs possible lower booking rates.
- Regularly review your cancellation policy against competitors and market demand shifts in San Giuliano Milanese.
San Giuliano Milanese STR Booking Lead Time Analysis (2025)
Average Booking Lead Time by Month
Booking Lead Time Insights for San Giuliano Milanese
- The overall average booking lead time for vacation rentals in San Giuliano Milanese is 38 days.
- Guests book furthest in advance for stays during April (average 56 days), likely coinciding with peak travel demand or local events.
- The shortest booking windows occur for stays in June (average 23 days), indicating more last-minute travel plans during this time.
- Seasonally, Spring (45 days avg.) sees the longest lead times, while Summer (28 days avg.) has the shortest, reflecting typical travel planning cycles.
Recommendations for Hosts
- Use the overall average lead time (38 days) as a baseline for your pricing and availability strategy in San Giuliano Milanese.
- For April stays, consider implementing length-of-stay discounts or slightly higher rates for bookings made less than 56 days out to capitalize on advance planning.
- Target marketing efforts for the Spring season well in advance (at least 45 days) to capture early planners.
- Monitor your own booking lead times against these San Giuliano Milanese averages to identify opportunities for dynamic pricing adjustments.
Popular & Essential Airbnb Amenities in San Giuliano Milanese (2025)
Amenity Prevalence
Amenity Insights for San Giuliano Milanese
- Essential amenities in San Giuliano Milanese that guests expect include: Heating, TV. Lacking these (any) could significantly impact bookings.
- Popular amenities like Kitchen, Hot water, Essentials are common but not universal. Offering these can provide a competitive edge.
- Warning: Wifi is not universally provided but is considered essential globally. Ensure reliable Wifi is offered.
Recommendations for Hosts
- Ensure your listing includes all essential amenities for San Giuliano Milanese: Heating, TV.
- Consider adding popular differentiators like Kitchen or Hot water to increase appeal.
- Highlight unique or less common amenities you offer (e.g., hot tub, dedicated workspace, EV charger) in your listing description and photos.
- Regularly check competitor amenities in San Giuliano Milanese to stay competitive.
San Giuliano Milanese Airbnb Guest Demographics & Profile Analysis (2025)
Guest Profile Summary for San Giuliano Milanese
- The typical guest profile for Airbnb in San Giuliano Milanese consists of a mix of domestic (38%) and international guests, with top international origins including France, typically belonging to the Post-2000s (Gen Z/Alpha) group (50%), primarily speaking English or Italian.
- Domestic travelers account for 37.9% of guests.
- Key international markets include Italy (37.9%) and France (14.2%).
- Top languages spoken are English (34.3%) followed by Italian (22.5%).
- A significant demographic segment is the Post-2000s (Gen Z/Alpha) group, representing 50% of guests.
Recommendations for Hosts
- Focus marketing internationally, particularly towards travelers from France.
- Tailor amenities and listing descriptions to appeal to the dominant Post-2000s (Gen Z/Alpha) demographic (e.g., highlight fast WiFi, smart home features, local guides).
- Highlight unique local experiences or amenities relevant to the primary guest profile.
- Consider seasonal promotions aligned with peak travel times for key origin markets.
Nearby Short-Term Rental Market Comparison
How does the San Giuliano Milanese Airbnb market stack up against its neighbors? Compare key performance metrics like average monthly revenue, ADR, and occupancy rates in surrounding areas to understand the broader regional STR landscape.
| Market | Active Properties | Monthly Revenue | Daily Rate | Avg. Occupancy |
|---|---|---|---|---|
| Grindelwald | 489 | $4,921 | $345.40 | 57% |
| Laglio | 64 | $4,873 | $463.61 | 47% |
| Brienz (BE) | 141 | $4,353 | $294.17 | 55% |
| Alpnach | 11 | $4,227 | $234.19 | 49% |
| Brenzone sul Garda | 19 | $4,128 | $335.25 | 52% |
| Portofino | 68 | $4,086 | $454.35 | 44% |
| Sala Comacina | 64 | $3,794 | $400.27 | 50% |
| Sachseln | 15 | $3,742 | $262.18 | 56% |
| Cossano Belbo | 13 | $3,632 | $284.21 | 42% |
| Bellagio | 373 | $3,630 | $328.26 | 55% |