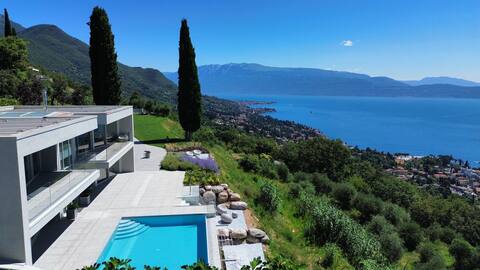
Salò Airbnb Market Analysis 2025: Short Term Rental Data & Vacation Rental Statistics in Lombardy, Italy
Is Airbnb profitable in Salò in 2025? Explore comprehensive Airbnb analytics for Salò, Lombardy, Italy to uncover income potential. This 2025 STR market report for Salò, based on AirROI data from April 2024 to March 2025, reveals key trends in the market of 227 active listings.
Whether you're considering an Airbnb investment in Salò, optimizing your existing vacation rental, or exploring rental arbitrage opportunities, understanding the Salò Airbnb data is crucial. Navigating the high regulation landscape is key to maximizing your short term rental income potential. Let's dive into the specifics.
Key Salò Airbnb Performance Metrics Overview
Monthly Airbnb Revenue Variations & Income Potential in Salò (2025)
Understanding the monthly revenue variations for Airbnb listings in Salò is key to maximizing your short term rental income potential. Seasonality significantly impacts earnings. Our analysis, based on data from the past 12 months, shows that the peak revenue month for STRs in Salò is typically August, while March often presents the lowest earnings, highlighting opportunities for strategic pricing adjustments during shoulder and low seasons. Explore the typical Airbnb income in Salò across different performance tiers:
- Best-in-class properties (Top 10%) achieve $5,939+ monthly, often utilizing dynamic pricing and superior guest experiences.
- Strong performing properties (Top 25%) earn $3,291 or more, indicating effective management and desirable locations/amenities.
- Typical properties (Median) generate around $1,835 per month, representing the average market performance.
- Entry-level properties (Bottom 25%) see earnings around $890, often with potential for optimization.
Average Monthly Airbnb Earnings Trend in Salò
Salò Airbnb Occupancy Rate Trends (2025)
Maximize your bookings by understanding the Salò STR occupancy trends. Seasonal demand shifts significantly influence how often properties are booked. Typically, Augustsees the highest demand (peak season occupancy), while March experiences the lowest (low season). Effective strategies, like adjusting minimum stays or offering promotions, can boost occupancy during slower periods. Here's how different property tiers perform in Salò:
- Best-in-class properties (Top 10%) achieve 74%+ occupancy, indicating high desirability and potentially optimized availability.
- Strong performing properties (Top 25%) maintain 54% or higher occupancy, suggesting good market fit and guest satisfaction.
- Typical properties (Median) have an occupancy rate around 34%.
- Entry-level properties (Bottom 25%) average 16% occupancy, potentially facing higher vacancy.
Average Monthly Occupancy Rate Trend in Salò
Average Daily Rate (ADR) Airbnb Trends in Salò (2025)
Effective short term rental pricing strategy in Salò involves understanding monthly ADR fluctuations. The Average Daily Rate (ADR) for Airbnb in Salò typically peaks in July and dips lowest during March. Leveraging Airbnb dynamic pricing tools or strategies based on this seasonality can significantly boost revenue. Here's a look at the typical nightly rates achieved:
- Best-in-class properties (Top 10%) command rates of $534+ per night, often due to premium features or locations.
- Strong performing properties (Top 25%) achieve nightly rates of $224 or more.
- Typical properties (Median) charge around $148 per night.
- Entry-level properties (Bottom 25%) earn around $111 per night.
Average Daily Rate (ADR) Trend by Month in Salò
Get Live Salò Market Intelligence 👇

Explore Real-time Analytics
Airbnb Seasonality Analysis & Trends in Salò (2025)
Peak Season (August, July, June)
- Revenue averages $4,841 per month
- Occupancy rates average 55.4%
- Daily rates average $273
Shoulder Season
- Revenue averages $2,790 per month
- Occupancy maintains around 35.4%
- Daily rates hold near $240
Low Season (January, February, March)
- Revenue drops to average $1,498 per month
- Occupancy decreases to average 22.5%
- Daily rates adjust to average $238
Seasonality Insights for Salò
- The Airbnb seasonality in Salò shows highly seasonal trends requiring careful strategy. While the sections above show seasonal averages, it's also insightful to look at the extremes:
- During the high season, the absolute peak month showcases Salò's highest earning potential, with monthly revenues capable of climbing to $5,578, occupancy reaching a high of 64.1%, and ADRs peaking at $282.
- Conversely, the slowest single month of the year, typically falling within the low season, marks the market's lowest point. In this month, revenue might dip to $1,338, occupancy could drop to 21.1%, and ADRs may adjust down to $230.
- Understanding both the seasonal averages and these monthly peaks and troughs in revenue, occupancy, and ADR is crucial for maximizing your Airbnb profit potential in Salò.
Seasonal Strategies for Maximizing Profit
- Peak Season: Maximize revenue through premium pricing and potentially longer minimum stays. Ensure high availability.
- Low Season: Offer competitive pricing, special promotions (e.g., extended stay discounts), and flexible cancellation policies. Target off-season travelers like remote workers or budget-conscious guests.
- Shoulder Seasons: Implement dynamic pricing that balances peak and low rates. Target weekend travelers or specific events. Offer slightly more flexible terms than peak season.
- Regularly analyze your own performance against these Salò seasonality benchmarks and adjust your pricing and availability strategy accordingly.
Best Areas for Airbnb Investment in Salò (2025)
Exploring the top neighborhoods for short-term rentals in Salò? This section highlights key areas, outlining why they are attractive for hosts and guests, along with notable local attractions. Consider these locations based on your target guest profile and investment strategy.
| Neighborhood / Area | Why Host Here? (Target Guests & Appeal) | Key Attractions & Landmarks |
|---|---|---|
| Centro Storico | The historical center of Salò offers a picturesque setting with charming streets, historic buildings, and proximity to the lakeshore. Ideal for tourists who want to explore the local culture and history. | Piazza della Vittoria, Duomo di Salò, Lungolago, Museo di Salò, Palazzo della Podestà |
| Lungolago | This lakeside area is perfect for those seeking scenic views and outdoor activities. It attracts visitors looking for relaxation, dining, and water sports on Lake Garda. | Lakeside promenade, Beaches, Boat rentals, Restaurants along the lake, Water sports facilities |
| Salò Beaches | Salò has several beautiful beaches that are popular among both locals and tourists, making it a great location for vacation rentals during the summer season. | Spiaggia del Sasso, Spiaggia di Rive, Lido di Salò, Beach clubs, Water activities |
| Monte Castello | This area provides panoramic views of Lake Garda and the surrounding hills, attracting nature lovers and hikers looking for outdoor adventures and beautiful scenery. | Hiking trails, Castello di Baone, Natural parks, Breathtaking viewpoints |
| Via Zanardelli | A vibrant street lined with shops, cafes, and restaurants that is frequented by both locals and tourists. Great for those who want to experience the local shopping and dining scene. | Boutiques, Cafes, Gelaterias, Local restaurants, Art galleries |
| San Felice del Benaco | A nearby town offering a more tranquil atmosphere and charming streets. Ideal for guests seeking peace and less crowded spots while being close to Salò. | Charming old town, Beaches, Path of the Olives, Quiet promenades |
| Gardone Riviera | Known for its beautiful botanical gardens and stunning villas, this area attracts visitors interested in culture and nature. Nice for those looking for more upscale accommodations. | Vittoriale degli Italiani, Botanical gardens, Lakeside walks, Cultural events |
| Spa Areas | Salò and the surrounding areas have several spas and wellness centers, appealing to travelers seeking relaxation and rejuvenation. Perfect for wellness retreats and getaways. | Spa resorts, Wellness centers, Relaxation therapies, Yoga retreats, Health-focused cafes |
Understanding Airbnb License Requirements & STR Laws in Salò (2025)
Yes, Salò, Lombardy, Italy enforces high STR regulations. Obtaining a license and ensuring compliance is almost certainly required according to current 2025 STR laws. Always verify the latest short term rental regulations and Airbnb license requirements directly with local government authorities for Salò to ensure full compliance before hosting.
(Source: AirROI data, 2025, based on 81% licensed listings)
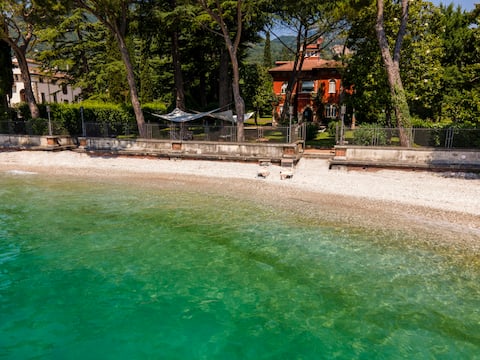
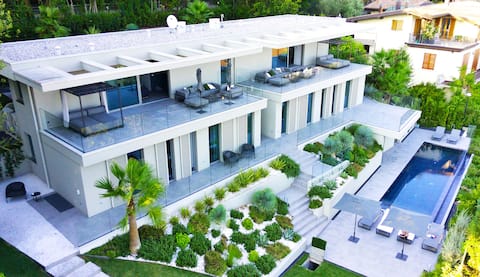
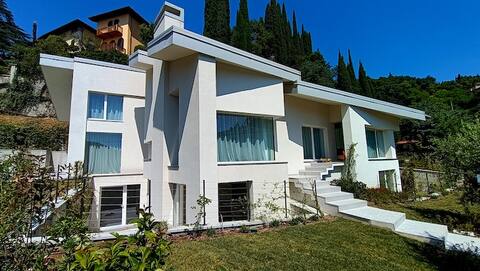
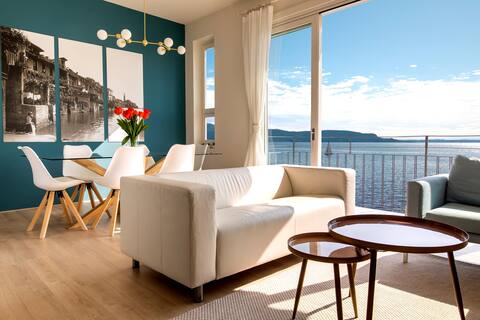
Top Performing Airbnb Properties in Salò (2025)
Benchmark your potential! Explore examples of top-performing Airbnb properties in Salòbased on Trailing Twelve Month (TTM) revenue. Analyze their characteristics, revenue, occupancy rate, and ADR to understand what drives success in this market.
Villa Titynino
Entire Place • 6 bedrooms
Villa Acquariva Garda Pool & Spa
Entire Place • 2 bedrooms

Villa Ondina - with private beach-enclosed garden
Entire Place • 4 bedrooms
Villa Prince Garda
Entire Place • 6 bedrooms
Deluxe XL Apartment with Lake View
Entire Place • 3 bedrooms
infinity villa salò
Entire Place • 4 bedrooms
Note: Performance varies based on location, size, amenities, seasonality, and management quality. Data reflects the past 12 months.
Top Performing Airbnb Hosts in Salò (2025)
Learn from the best! This table showcases top-performing Airbnb hosts in Salò based on the number of properties managed and estimated total revenue over the past year. Analyze their scale and performance metrics.
| Host Name | Properties | Grossing Revenue | Stay Reviews | Avg Rating |
|---|---|---|---|---|
| Laura | 6 | $630,972 | 154 | 4.91/5.0 |
| Selene | 3 | $282,056 | 132 | 4.98/5.0 |
| Roberto | 8 | $191,461 | 397 | 4.80/5.0 |
| Enrico | 1 | $191,112 | 9 | 5.00/5.0 |
| Booking Garda Lake | 8 | $175,174 | 49 | 4.22/5.0 |
| Matteo | 1 | $139,310 | 9 | 5.00/5.0 |
| Massimo | 3 | $127,998 | 208 | 4.86/5.0 |
| Bianca | 1 | $120,933 | 3 | 5.00/5.0 |
| My Garda Holiday | 1 | $120,430 | 12 | 5.00/5.0 |
| Maurizio | 5 | $115,318 | 146 | 4.91/5.0 |
Analyzing the strategies of top hosts, such as their property selection, pricing, and guest communication, can offer valuable lessons for optimizing your own Airbnb operations in Salò.
Dive Deeper: Advanced Salò STR Market Data (2025)
Ready to unlock more insights? AirROI provides access to advanced metrics and comprehensive Airbnb data for Salò. Explore detailed analytics beyond this report to refine your investment strategy, optimize pricing, and maximize your vacation rental profits.
Explore Advanced MetricsSalò Short-Term Rental Market Composition (2025): Property & Room Types
Room Type Distribution
Property Type Distribution
Market Composition Insights for Salò
- The Salò Airbnb market composition is heavily skewed towards Entire Home/Apt listings, which make up 94.7% of the 227 active rentals. This indicates strong guest preference for privacy and space.
- Looking at the property type distribution in Salò, Apartment/Condo properties are the most common (70.9%), reflecting the local real estate landscape.
- Houses represent a significant 22.5% portion, catering likely to families or larger groups.
- Smaller segments like hotel/boutique, outdoor/unique (combined 6.6%) offer potential for unique stay experiences.
Salò Airbnb Room Capacity Analysis (2025): Bedroom Distribution
Distribution of Listings by Number of Bedrooms
Room Capacity Insights for Salò
- The dominant room capacity in Salò is 2 bedrooms listings, making up 37.9% of the market. This suggests a strong demand for properties suitable for couples or solo travelers.
- Together, 2 bedrooms and 1 bedroom properties represent 75.8% of the active Airbnb listings in Salò, indicating a high concentration in these sizes.
- A significant 20.3% of listings offer 3+ bedrooms, catering to larger groups and families seeking more space in Salò.
Salò Vacation Rental Guest Capacity Trends (2025)
Distribution of Listings by Guest Capacity
Guest Capacity Insights for Salò
- The most common guest capacity trend in Salò vacation rentals is listings accommodating 4 guests (33%). This suggests the primary traveler segment is likely small families or groups.
- Properties designed for 4 guests and 2 guests dominate the Salò STR market, accounting for 49.3% of listings.
- 28.6% of properties accommodate 6+ guests, serving the market segment for larger families or group travel in Salò.
- On average, properties in Salò are equipped to host 4.4 guests.
Salò Airbnb Booking Patterns (2025): Available vs. Booked Days
Available Days Distribution
Booked Days Distribution
Booking Pattern Insights for Salò
- The most common availability pattern in Salò falls within the 271-366 days range, representing 47.6% of listings. This suggests many properties have significant open periods on their calendars.
- Approximately 85.9% of listings show high availability (181+ days open annually), indicating potential for increased bookings or specific owner usage patterns.
- For booked days, the 91-180 days range is most frequent in Salò (38.3%), reflecting common guest stay durations or potential owner blocking patterns.
- A notable 16.3% of properties secure long booking periods (181+ days booked per year), highlighting successful long-term rental strategies or significant owner usage.
Salò Airbnb Minimum Stay Requirements Analysis
Distribution of Listings by Minimum Night Requirement
1 Night
35 listings
16% of total
2 Nights
42 listings
19.2% of total
3 Nights
41 listings
18.7% of total
4-6 Nights
48 listings
21.9% of total
7-29 Nights
22 listings
10% of total
30+ Nights
31 listings
14.2% of total
Key Insights
- The most prevalent minimum stay requirement in Salò is 4-6 Nights, adopted by 21.9% of listings. This highlights the market's preference for longer commitments.
- A significant segment (14.2%) caters to monthly stays (30+ nights) in Salò, pointing to opportunities in the extended-stay market.
Recommendations
- Align with the market by considering a 4-6 Nights minimum stay, as 21.9% of Salò hosts use this setting.
- If feasible, allowing 1-night stays, especially midweek or during low season, could capture last-minute bookings, as only 16% currently do.
- Explore offering discounts for stays of 30+ nights to attract the 14.2% of the market seeking extended stays.
- Adjust minimum nights based on seasonality – potentially shorter during low season and longer during peak demand periods in Salò.
Salò Airbnb Cancellation Policy Trends Analysis (2025)
Super Strict 60 Days
8 listings
3.9% of total
Super Strict 30 Days
17 listings
8.3% of total
Flexible
20 listings
9.8% of total
Moderate
83 listings
40.5% of total
Strict
77 listings
37.6% of total
Cancellation Policy Insights for Salò
- The prevailing Airbnb cancellation policy trend in Salò is Moderate, used by 40.5% of listings.
- There's a relatively balanced mix between guest-friendly (50.3%) and stricter (37.6%) policies, offering choices for different guest needs.
Recommendations for Hosts
- Consider adopting a Moderate policy to align with the 40.5% market standard in Salò.
- With 37.6% using Strict terms, this is a viable option in Salò, particularly for high-value properties or during peak demand periods.
- Regularly review your cancellation policy against competitors and market demand shifts in Salò.
Salò STR Booking Lead Time Analysis (2025)
Average Booking Lead Time by Month
Booking Lead Time Insights for Salò
- The overall average booking lead time for vacation rentals in Salò is 68 days.
- Guests book furthest in advance for stays during June (average 104 days), likely coinciding with peak travel demand or local events.
- The shortest booking windows occur for stays in January (average 47 days), indicating more last-minute travel plans during this time.
- Seasonally, Summer (99 days avg.) sees the longest lead times, while Winter (50 days avg.) has the shortest, reflecting typical travel planning cycles.
Recommendations for Hosts
- Use the overall average lead time (68 days) as a baseline for your pricing and availability strategy in Salò.
- For June stays, consider implementing length-of-stay discounts or slightly higher rates for bookings made less than 104 days out to capitalize on advance planning.
- Target marketing efforts for the Summer season well in advance (at least 99 days) to capture early planners.
- Monitor your own booking lead times against these Salò averages to identify opportunities for dynamic pricing adjustments.
Popular & Essential Airbnb Amenities in Salò (2025)
Amenity Prevalence
Amenity Insights for Salò
- Popular amenities like Wifi, Kitchen, Heating are common but not universal. Offering these can provide a competitive edge.
- Warning: Wifi is not universally provided but is considered essential globally. Ensure reliable Wifi is offered.
Recommendations for Hosts
- Consider adding popular differentiators like Wifi or Kitchen to increase appeal.
- Highlight unique or less common amenities you offer (e.g., hot tub, dedicated workspace, EV charger) in your listing description and photos.
- Regularly check competitor amenities in Salò to stay competitive.
Salò Airbnb Guest Demographics & Profile Analysis (2025)
Guest Profile Summary for Salò
- The typical guest profile for Airbnb in Salò consists of predominantly international visitors (92%), with top international origins including United Kingdom, typically belonging to the Post-2000s (Gen Z/Alpha) group (50%), primarily speaking English or German.
- Domestic travelers account for 7.7% of guests.
- Key international markets include Germany (36.9%) and United Kingdom (10.3%).
- Top languages spoken are English (40.6%) followed by German (22.5%).
- A significant demographic segment is the Post-2000s (Gen Z/Alpha) group, representing 50% of guests.
Recommendations for Hosts
- Focus marketing internationally, particularly towards travelers from United Kingdom.
- Tailor amenities and listing descriptions to appeal to the dominant Post-2000s (Gen Z/Alpha) demographic (e.g., highlight fast WiFi, smart home features, local guides).
- Highlight unique local experiences or amenities relevant to the primary guest profile.
- Consider seasonal promotions aligned with peak travel times for key origin markets.
Nearby Short-Term Rental Market Comparison
How does the Salò Airbnb market stack up against its neighbors? Compare key performance metrics like average monthly revenue, ADR, and occupancy rates in surrounding areas to understand the broader regional STR landscape.
| Market | Active Properties | Monthly Revenue | Daily Rate | Avg. Occupancy |
|---|---|---|---|---|
| Laglio | 64 | $4,873 | $463.61 | 47% |
| Urtijëi - St. Ulrich in Gröden - Ortisei | 163 | $4,698 | $630.45 | 40% |
| Moos in Passeier - Moso in Passiria | 17 | $4,619 | $547.60 | 27% |
| Brenzone sul Garda | 19 | $4,128 | $335.25 | 52% |
| Portofino | 68 | $4,086 | $454.35 | 44% |
| Sala Comacina | 64 | $3,794 | $400.27 | 50% |
| Bellagio | 373 | $3,630 | $328.26 | 55% |
| Oliveto Lario | 99 | $3,509 | $327.42 | 55% |
| Varenna | 216 | $3,419 | $272.27 | 56% |
| Carate Urio | 71 | $3,379 | $331.90 | 44% |