Ranzanico Airbnb Market Analysis 2025: Short Term Rental Data & Vacation Rental Statistics in Lombardy, Italy
Is Airbnb profitable in Ranzanico in 2025? Explore comprehensive Airbnb analytics for Ranzanico, Lombardy, Italy to uncover income potential. This 2025 STR market report for Ranzanico, based on AirROI data from April 2024 to March 2025, reveals key trends in the niche market of 26 active listings.
Whether you're considering an Airbnb investment in Ranzanico, optimizing your existing vacation rental, or exploring rental arbitrage opportunities, understanding the Ranzanico Airbnb data is crucial. Navigating the high regulation landscape is key to maximizing your short term rental income potential. Let's dive into the specifics.
Key Ranzanico Airbnb Performance Metrics Overview
Monthly Airbnb Revenue Variations & Income Potential in Ranzanico (2025)
Understanding the monthly revenue variations for Airbnb listings in Ranzanico is key to maximizing your short term rental income potential. Seasonality significantly impacts earnings. Our analysis, based on data from the past 12 months, shows that the peak revenue month for STRs in Ranzanico is typically August, while February often presents the lowest earnings, highlighting opportunities for strategic pricing adjustments during shoulder and low seasons. Explore the typical Airbnb income in Ranzanico across different performance tiers:
- Best-in-class properties (Top 10%) achieve $3,075+ monthly, often utilizing dynamic pricing and superior guest experiences.
- Strong performing properties (Top 25%) earn $2,019 or more, indicating effective management and desirable locations/amenities.
- Typical properties (Median) generate around $1,264 per month, representing the average market performance.
- Entry-level properties (Bottom 25%) see earnings around $705, often with potential for optimization.
Average Monthly Airbnb Earnings Trend in Ranzanico
Ranzanico Airbnb Occupancy Rate Trends (2025)
Maximize your bookings by understanding the Ranzanico STR occupancy trends. Seasonal demand shifts significantly influence how often properties are booked. Typically, Augustsees the highest demand (peak season occupancy), while February experiences the lowest (low season). Effective strategies, like adjusting minimum stays or offering promotions, can boost occupancy during slower periods. Here's how different property tiers perform in Ranzanico:
- Best-in-class properties (Top 10%) achieve 78%+ occupancy, indicating high desirability and potentially optimized availability.
- Strong performing properties (Top 25%) maintain 46% or higher occupancy, suggesting good market fit and guest satisfaction.
- Typical properties (Median) have an occupancy rate around 25%.
- Entry-level properties (Bottom 25%) average 13% occupancy, potentially facing higher vacancy.
Average Monthly Occupancy Rate Trend in Ranzanico
Average Daily Rate (ADR) Airbnb Trends in Ranzanico (2025)
Effective short term rental pricing strategy in Ranzanico involves understanding monthly ADR fluctuations. The Average Daily Rate (ADR) for Airbnb in Ranzanico typically peaks in December and dips lowest during April. Leveraging Airbnb dynamic pricing tools or strategies based on this seasonality can significantly boost revenue. Here's a look at the typical nightly rates achieved:
- Best-in-class properties (Top 10%) command rates of $251+ per night, often due to premium features or locations.
- Strong performing properties (Top 25%) achieve nightly rates of $163 or more.
- Typical properties (Median) charge around $98 per night.
- Entry-level properties (Bottom 25%) earn around $82 per night.
Average Daily Rate (ADR) Trend by Month in Ranzanico
Get Live Ranzanico Market Intelligence 👇

Explore Real-time Analytics
Airbnb Seasonality Analysis & Trends in Ranzanico (2025)
Peak Season (August, July, June)
- Revenue averages $2,458 per month
- Occupancy rates average 50.0%
- Daily rates average $144
Shoulder Season
- Revenue averages $1,341 per month
- Occupancy maintains around 28.5%
- Daily rates hold near $137
Low Season (February, March, November)
- Revenue drops to average $861 per month
- Occupancy decreases to average 27.1%
- Daily rates adjust to average $131
Seasonality Insights for Ranzanico
- The Airbnb seasonality in Ranzanico shows highly seasonal trends requiring careful strategy. While the sections above show seasonal averages, it's also insightful to look at the extremes:
- During the high season, the absolute peak month showcases Ranzanico's highest earning potential, with monthly revenues capable of climbing to $2,857, occupancy reaching a high of 56.2%, and ADRs peaking at $150.
- Conversely, the slowest single month of the year, typically falling within the low season, marks the market's lowest point. In this month, revenue might dip to $675, occupancy could drop to 23.2%, and ADRs may adjust down to $129.
- Understanding both the seasonal averages and these monthly peaks and troughs in revenue, occupancy, and ADR is crucial for maximizing your Airbnb profit potential in Ranzanico.
Seasonal Strategies for Maximizing Profit
- Peak Season: Maximize revenue through premium pricing and potentially longer minimum stays. Ensure high availability.
- Low Season: Offer competitive pricing, special promotions (e.g., extended stay discounts), and flexible cancellation policies. Target off-season travelers like remote workers or budget-conscious guests.
- Shoulder Seasons: Implement dynamic pricing that balances peak and low rates. Target weekend travelers or specific events. Offer slightly more flexible terms than peak season.
- Regularly analyze your own performance against these Ranzanico seasonality benchmarks and adjust your pricing and availability strategy accordingly.
Best Areas for Airbnb Investment in Ranzanico (2025)
Exploring the top neighborhoods for short-term rentals in Ranzanico? This section highlights key areas, outlining why they are attractive for hosts and guests, along with notable local attractions. Consider these locations based on your target guest profile and investment strategy.
| Neighborhood / Area | Why Host Here? (Target Guests & Appeal) | Key Attractions & Landmarks |
|---|---|---|
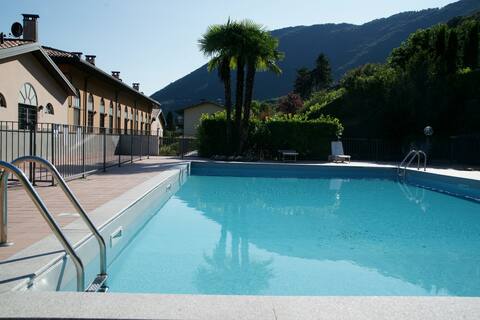
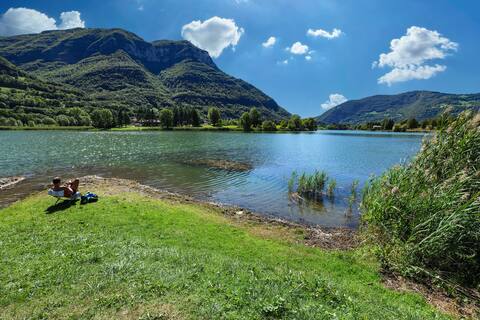
| Ranzanico Lakefront | Beautiful scenic views of Lake Endine make it a desirable location for tourists seeking a tranquil getaway. The area is perfect for nature lovers and outdoor activities such as hiking and boating. | Lake Endine, Natural Reserve of the Cavallina Valley, Pista Ciclabile, Parco del Monte Misma, San Giovanni Battista Church |
| Local Vineyards | Ranzanico is located in a region known for its excellent wines. Visitors can explore local vineyards and participate in wine tasting events, making it attractive for wine enthusiasts. | Wine Tour Experiences, Local Enotecas, Agriturismo experiences, Scenic Vineyards Tours |
| Cultural Landmarks | Ranzanico is close to historic and cultural landmarks that attract tourists interested in Italian heritage and history. | Castello di Trezzone, Chiesa di San Bartolomeo, Museo della Canzone Italiana, Santa Maria Assunta Church |
| Adventure Sports | The surrounding areas offer various adventure sports, including mountain biking, paragliding, and trekking, appealing to active tourists looking for excitement. | Mountain Biking Trails, Paragliding Launch Sites, Trekking Paths, Water Sports on Lake Endine |
| Culinary Experiences | Guests can indulge in the rich Italian cuisine that the region offers, which attracts food lovers looking for authentic culinary experiences. | Local Restaurants, Cooking Classes, Traditional Italian Markets |
| Peaceful Retreats | Ideal for those seeking a peaceful retreat away from the hustle and bustle of city life. The serene environment attracts tourists who want to relax and rejuvenate. | Wellness Centers, Spa Resorts, Quiet Nature Walks, Fishing Spots |
| Civic Parks | The town has several parks that are perfect for family gatherings and outdoor activities, appealing to families visiting the area. | Parco Comunale, Children's Play Areas, Picnic Spots, Walking Trails |
| Nearby Towns | Proximity to other charming towns and attractions in Lombardy enhances its appeal for tourists looking to explore the region. | Bergamo, Lovere, Clusone, Isola di Loreto |
Understanding Airbnb License Requirements & STR Laws in Ranzanico (2025)
Yes, Ranzanico, Lombardy, Italy enforces high STR regulations. Obtaining a license and ensuring compliance is almost certainly required according to current 2025 STR laws. Always verify the latest short term rental regulations and Airbnb license requirements directly with local government authorities for Ranzanico to ensure full compliance before hosting.
(Source: AirROI data, 2025, based on 54% licensed listings)
Top Performing Airbnb Properties in Ranzanico (2025)
Benchmark your potential! Explore examples of top-performing Airbnb properties in Ranzanicobased on Trailing Twelve Month (TTM) revenue. Analyze their characteristics, revenue, occupancy rate, and ADR to understand what drives success in this market.

Three-room apartment Lake view 6 beds Wifi checkin24h
Entire Place • 2 bedrooms

{Mag House} Vista Lago + box auto
Entire Place • 1 bedroom
Vacation sul Lago
Entire Place • 1 bedroom
Modern three-room apartment Lake view, Wi-Fi-checkin24h
Entire Place • 2 bedrooms
Court of Dreams - Mountain&Lake (016179-LNI-00006)
Entire Place • 2 bedrooms
Travel Nest
Entire Place • 2 bedrooms
Note: Performance varies based on location, size, amenities, seasonality, and management quality. Data reflects the past 12 months.
Top Performing Airbnb Hosts in Ranzanico (2025)
Learn from the best! This table showcases top-performing Airbnb hosts in Ranzanico based on the number of properties managed and estimated total revenue over the past year. Analyze their scale and performance metrics.
| Host Name | Properties | Grossing Revenue | Stay Reviews | Avg Rating |
|---|---|---|---|---|
| Gabriele | 2 | $34,969 | 44 | 4.88/5.0 |
| Ely | 1 | $30,592 | 43 | 4.98/5.0 |
| Silvia | 2 | $30,405 | 30 | 4.86/5.0 |
| Marco | 1 | $25,219 | 20 | 4.90/5.0 |
| Gabriele | 1 | $25,129 | 4 | 3.50/5.0 |
| Simone | 1 | $19,859 | 4 | 4.75/5.0 |
| Michela | 1 | $18,335 | 4 | 3.50/5.0 |
| Host #547657958 | 1 | $17,980 | 1 | 0.00/5.0 |
| Host #76073816 | 1 | $17,613 | 11 | 4.73/5.0 |
| Carlo.Alberto | 1 | $17,612 | 28 | 4.71/5.0 |
Analyzing the strategies of top hosts, such as their property selection, pricing, and guest communication, can offer valuable lessons for optimizing your own Airbnb operations in Ranzanico.
Dive Deeper: Advanced Ranzanico STR Market Data (2025)
Ready to unlock more insights? AirROI provides access to advanced metrics and comprehensive Airbnb data for Ranzanico. Explore detailed analytics beyond this report to refine your investment strategy, optimize pricing, and maximize your vacation rental profits.
Explore Advanced MetricsRanzanico Short-Term Rental Market Composition (2025): Property & Room Types
Room Type Distribution
Property Type Distribution
Market Composition Insights for Ranzanico
- The Ranzanico Airbnb market composition is heavily skewed towards Entire Home/Apt listings, which make up 100% of the 26 active rentals. This indicates strong guest preference for privacy and space.
- Looking at the property type distribution in Ranzanico, Apartment/Condo properties are the most common (73.1%), reflecting the local real estate landscape.
- Houses represent a significant 23.1% portion, catering likely to families or larger groups.
- Smaller segments like outdoor/unique (combined 3.8%) offer potential for unique stay experiences.
Ranzanico Airbnb Room Capacity Analysis (2025): Bedroom Distribution
Distribution of Listings by Number of Bedrooms
Room Capacity Insights for Ranzanico
- The dominant room capacity in Ranzanico is 1 bedroom listings, making up 50% of the market. This suggests a strong demand for properties suitable for couples or solo travelers.
- Together, 1 bedroom and 2 bedrooms properties represent 96.2% of the active Airbnb listings in Ranzanico, indicating a high concentration in these sizes.
- Listings with 3+ bedrooms (3.8%) represent a smaller niche, potentially indicating an underserved market for larger group accommodations in Ranzanico.
Ranzanico Vacation Rental Guest Capacity Trends (2025)
Distribution of Listings by Guest Capacity
Guest Capacity Insights for Ranzanico
- The most common guest capacity trend in Ranzanico vacation rentals is listings accommodating 4 guests (46.2%). This suggests the primary traveler segment is likely small families or groups.
- Properties designed for 4 guests and 6 guests dominate the Ranzanico STR market, accounting for 65.4% of listings.
- 23.0% of properties accommodate 6+ guests, serving the market segment for larger families or group travel in Ranzanico.
- On average, properties in Ranzanico are equipped to host 4.3 guests.
Ranzanico Airbnb Booking Patterns (2025): Available vs. Booked Days
Available Days Distribution
Booked Days Distribution
Booking Pattern Insights for Ranzanico
- The most common availability pattern in Ranzanico falls within the 271-366 days range, representing 57.7% of listings. This suggests many properties have significant open periods on their calendars.
- Approximately 88.5% of listings show high availability (181+ days open annually), indicating potential for increased bookings or specific owner usage patterns.
- For booked days, the 91-180 days range is most frequent in Ranzanico (34.6%), reflecting common guest stay durations or potential owner blocking patterns.
- A notable 11.5% of properties secure long booking periods (181+ days booked per year), highlighting successful long-term rental strategies or significant owner usage.
Ranzanico Airbnb Minimum Stay Requirements Analysis
Distribution of Listings by Minimum Night Requirement
1 Night
7 listings
29.2% of total
2 Nights
8 listings
33.3% of total
3 Nights
5 listings
20.8% of total
4-6 Nights
2 listings
8.3% of total
30+ Nights
2 listings
8.3% of total
Key Insights
- The most prevalent minimum stay requirement in Ranzanico is 2 Nights, adopted by 33.3% of listings. This highlights the market's preference for shorter, flexible bookings.
- A strong majority (62.5%) of the Ranzanico Airbnb data shows acceptance of very short stays (1-2 nights), indicating a dynamic, high-turnover market.
Recommendations
- Align with the market by considering a 2 Nights minimum stay, as 33.3% of Ranzanico hosts use this setting.
- If feasible, allowing 1-night stays, especially midweek or during low season, could capture last-minute bookings, as only 29.2% currently do.
- Explore offering discounts for stays of 30+ nights to attract the 8.3% of the market seeking extended stays.
- Adjust minimum nights based on seasonality – potentially shorter during low season and longer during peak demand periods in Ranzanico.
Ranzanico Airbnb Cancellation Policy Trends Analysis (2025)
Super Strict 30 Days
2 listings
9.1% of total
Flexible
3 listings
13.6% of total
Moderate
9 listings
40.9% of total
Strict
8 listings
36.4% of total
Cancellation Policy Insights for Ranzanico
- The prevailing Airbnb cancellation policy trend in Ranzanico is Moderate, used by 40.9% of listings.
- There's a relatively balanced mix between guest-friendly (54.5%) and stricter (36.4%) policies, offering choices for different guest needs.
Recommendations for Hosts
- Consider adopting a Moderate policy to align with the 40.9% market standard in Ranzanico.
- With 36.4% using Strict terms, this is a viable option in Ranzanico, particularly for high-value properties or during peak demand periods.
- Regularly review your cancellation policy against competitors and market demand shifts in Ranzanico.
Ranzanico STR Booking Lead Time Analysis (2025)
Average Booking Lead Time by Month
Booking Lead Time Insights for Ranzanico
- The overall average booking lead time for vacation rentals in Ranzanico is 40 days.
- Guests book furthest in advance for stays during July (average 98 days), likely coinciding with peak travel demand or local events.
- The shortest booking windows occur for stays in March (average 25 days), indicating more last-minute travel plans during this time.
- Seasonally, Summer (66 days avg.) sees the longest lead times, while Fall (29 days avg.) has the shortest, reflecting typical travel planning cycles.
Recommendations for Hosts
- Use the overall average lead time (40 days) as a baseline for your pricing and availability strategy in Ranzanico.
- For July stays, consider implementing length-of-stay discounts or slightly higher rates for bookings made less than 98 days out to capitalize on advance planning.
- Target marketing efforts for the Summer season well in advance (at least 66 days) to capture early planners.
- Monitor your own booking lead times against these Ranzanico averages to identify opportunities for dynamic pricing adjustments.
Popular & Essential Airbnb Amenities in Ranzanico (2025)
Amenity Prevalence
Amenity Insights for Ranzanico
- Essential amenities in Ranzanico that guests expect include: TV, Heating, Essentials, Kitchen. Lacking these (any) could significantly impact bookings.
- Popular amenities like Dishes and silverware, Hot water, Refrigerator are common but not universal. Offering these can provide a competitive edge.
Recommendations for Hosts
- Ensure your listing includes all essential amenities for Ranzanico: TV, Heating, Essentials, Kitchen.
- Prioritize adding missing essentials: Essentials, Kitchen.
- Consider adding popular differentiators like Dishes and silverware or Hot water to increase appeal.
- Highlight unique or less common amenities you offer (e.g., hot tub, dedicated workspace, EV charger) in your listing description and photos.
- Regularly check competitor amenities in Ranzanico to stay competitive.
Ranzanico Airbnb Guest Demographics & Profile Analysis (2025)
Guest Profile Summary for Ranzanico
- The typical guest profile for Airbnb in Ranzanico consists of predominantly international visitors (68%), with top international origins including Germany, typically belonging to the Post-2000s (Gen Z/Alpha) group (50%), primarily speaking English or Italian.
- Domestic travelers account for 32.1% of guests.
- Key international markets include Italy (32.1%) and Germany (10.7%).
- Top languages spoken are English (37.6%) followed by Italian (20.1%).
- A significant demographic segment is the Post-2000s (Gen Z/Alpha) group, representing 50% of guests.
Recommendations for Hosts
- Focus marketing internationally, particularly towards travelers from Germany.
- Tailor amenities and listing descriptions to appeal to the dominant Post-2000s (Gen Z/Alpha) demographic (e.g., highlight fast WiFi, smart home features, local guides).
- Highlight unique local experiences or amenities relevant to the primary guest profile.
- Consider seasonal promotions aligned with peak travel times for key origin markets.
Nearby Short-Term Rental Market Comparison
How does the Ranzanico Airbnb market stack up against its neighbors? Compare key performance metrics like average monthly revenue, ADR, and occupancy rates in surrounding areas to understand the broader regional STR landscape.
| Market | Active Properties | Monthly Revenue | Daily Rate | Avg. Occupancy |
|---|---|---|---|---|
| Grindelwald | 489 | $4,921 | $345.40 | 57% |
| Laglio | 64 | $4,873 | $463.61 | 47% |
| Brienz (BE) | 141 | $4,353 | $294.17 | 55% |
| Alpnach | 11 | $4,227 | $234.19 | 49% |
| Brenzone sul Garda | 19 | $4,128 | $335.25 | 52% |
| Portofino | 68 | $4,086 | $454.35 | 44% |
| Sala Comacina | 64 | $3,794 | $400.27 | 50% |
| Sachseln | 15 | $3,742 | $262.18 | 56% |
| Cossano Belbo | 13 | $3,632 | $284.21 | 42% |
| Bellagio | 373 | $3,630 | $328.26 | 55% |