Puegnago del Garda Airbnb Market Analysis 2025: Short Term Rental Data & Vacation Rental Statistics in Lombardy, Italy
Is Airbnb profitable in Puegnago del Garda in 2025? Explore comprehensive Airbnb analytics for Puegnago del Garda, Lombardy, Italy to uncover income potential. This 2025 STR market report for Puegnago del Garda, based on AirROI data from April 2024 to March 2025, reveals key trends in the niche market of 73 active listings.
Whether you're considering an Airbnb investment in Puegnago del Garda, optimizing your existing vacation rental, or exploring rental arbitrage opportunities, understanding the Puegnago del Garda Airbnb data is crucial. Navigating the high regulation landscape is key to maximizing your short term rental income potential. Let's dive into the specifics.
Key Puegnago del Garda Airbnb Performance Metrics Overview
Monthly Airbnb Revenue Variations & Income Potential in Puegnago del Garda (2025)
Understanding the monthly revenue variations for Airbnb listings in Puegnago del Garda is key to maximizing your short term rental income potential. Seasonality significantly impacts earnings. Our analysis, based on data from the past 12 months, shows that the peak revenue month for STRs in Puegnago del Garda is typically August, while January often presents the lowest earnings, highlighting opportunities for strategic pricing adjustments during shoulder and low seasons. Explore the typical Airbnb income in Puegnago del Garda across different performance tiers:
- Best-in-class properties (Top 10%) achieve $3,345+ monthly, often utilizing dynamic pricing and superior guest experiences.
- Strong performing properties (Top 25%) earn $2,256 or more, indicating effective management and desirable locations/amenities.
- Typical properties (Median) generate around $1,214 per month, representing the average market performance.
- Entry-level properties (Bottom 25%) see earnings around $627, often with potential for optimization.
Average Monthly Airbnb Earnings Trend in Puegnago del Garda
Puegnago del Garda Airbnb Occupancy Rate Trends (2025)
Maximize your bookings by understanding the Puegnago del Garda STR occupancy trends. Seasonal demand shifts significantly influence how often properties are booked. Typically, Augustsees the highest demand (peak season occupancy), while January experiences the lowest (low season). Effective strategies, like adjusting minimum stays or offering promotions, can boost occupancy during slower periods. Here's how different property tiers perform in Puegnago del Garda:
- Best-in-class properties (Top 10%) achieve 65%+ occupancy, indicating high desirability and potentially optimized availability.
- Strong performing properties (Top 25%) maintain 47% or higher occupancy, suggesting good market fit and guest satisfaction.
- Typical properties (Median) have an occupancy rate around 30%.
- Entry-level properties (Bottom 25%) average 15% occupancy, potentially facing higher vacancy.
Average Monthly Occupancy Rate Trend in Puegnago del Garda
Average Daily Rate (ADR) Airbnb Trends in Puegnago del Garda (2025)
Effective short term rental pricing strategy in Puegnago del Garda involves understanding monthly ADR fluctuations. The Average Daily Rate (ADR) for Airbnb in Puegnago del Garda typically peaks in August and dips lowest during March. Leveraging Airbnb dynamic pricing tools or strategies based on this seasonality can significantly boost revenue. Here's a look at the typical nightly rates achieved:
- Best-in-class properties (Top 10%) command rates of $241+ per night, often due to premium features or locations.
- Strong performing properties (Top 25%) achieve nightly rates of $155 or more.
- Typical properties (Median) charge around $116 per night.
- Entry-level properties (Bottom 25%) earn around $89 per night.
Average Daily Rate (ADR) Trend by Month in Puegnago del Garda
Get Live Puegnago del Garda Market Intelligence 👇

Explore Real-time Analytics
Airbnb Seasonality Analysis & Trends in Puegnago del Garda (2025)
Peak Season (August, July, May)
- Revenue averages $3,232 per month
- Occupancy rates average 51.2%
- Daily rates average $180
Shoulder Season
- Revenue averages $1,626 per month
- Occupancy maintains around 29.6%
- Daily rates hold near $153
Low Season (January, November, December)
- Revenue drops to average $841 per month
- Occupancy decreases to average 21.8%
- Daily rates adjust to average $139
Seasonality Insights for Puegnago del Garda
- The Airbnb seasonality in Puegnago del Garda shows highly seasonal trends requiring careful strategy. While the sections above show seasonal averages, it's also insightful to look at the extremes:
- During the high season, the absolute peak month showcases Puegnago del Garda's highest earning potential, with monthly revenues capable of climbing to $3,873, occupancy reaching a high of 64.7%, and ADRs peaking at $188.
- Conversely, the slowest single month of the year, typically falling within the low season, marks the market's lowest point. In this month, revenue might dip to $745, occupancy could drop to 19.0%, and ADRs may adjust down to $133.
- Understanding both the seasonal averages and these monthly peaks and troughs in revenue, occupancy, and ADR is crucial for maximizing your Airbnb profit potential in Puegnago del Garda.
Seasonal Strategies for Maximizing Profit
- Peak Season: Maximize revenue through premium pricing and potentially longer minimum stays. Ensure high availability.
- Low Season: Offer competitive pricing, special promotions (e.g., extended stay discounts), and flexible cancellation policies. Target off-season travelers like remote workers or budget-conscious guests.
- Shoulder Seasons: Implement dynamic pricing that balances peak and low rates. Target weekend travelers or specific events. Offer slightly more flexible terms than peak season.
- Regularly analyze your own performance against these Puegnago del Garda seasonality benchmarks and adjust your pricing and availability strategy accordingly.
Best Areas for Airbnb Investment in Puegnago del Garda (2025)
Exploring the top neighborhoods for short-term rentals in Puegnago del Garda? This section highlights key areas, outlining why they are attractive for hosts and guests, along with notable local attractions. Consider these locations based on your target guest profile and investment strategy.
| Neighborhood / Area | Why Host Here? (Target Guests & Appeal) | Key Attractions & Landmarks |
|---|---|---|
| Puegnago del Garda | Charming village located near Lake Garda, known for its beautiful scenery and Mediterranean climate. Ideal for tourists looking for a peaceful retreat close to nature and various outdoor activities. | Lake Garda, Wine tasting tours, Hiking trails, Cultural events, Local markets |
| San Felice del Benaco | A picturesque town adjacent to Puegnago, popular for its lakeside promenade and historical sites. Offers great accessibility to the lake with stunning views, attractive for families and couples. | Porto San Felice, Lakeside beaches, Historical churches, Olive oil mills, Local restaurants |
| Salò | Nearby town known for its charming waterfront and rich history. Salò attracts tourists for its vibrant markets and cultural heritage, making it a great area for short-term rentals. | Salò’s waterfront, Piazza della Vittoria, Palazzo della Magnifica Patria, Local artisan shops, Gardone Riviera close by |
| Bardolino | Famous for its wine production and beautiful vineyards along Lake Garda. Tourists flock here for wine tasting and the scenic beauty, making it a preferred Airbnb location. | Wine cellars, Lake promenade, Bardolino’s historic center, Local festivals, Trattorias |
| Desenzano del Garda | Larger nearby town bustling with tourists, known for its nightlife and shopping. It has numerous amenities and attractions, appealing to a broad audience. | Desenzano Castle, Beaches, Local shops, Nightclubs, Restaurants |
| Gargnano | Known for its stunning views and natural environment, ideal for hiking and nature lovers. Appeals to those seeking tranquility and beautiful landscapes. | Gardens of Villa Bettoni, Lakeshore walks, Hiking spots, Local festivals, Olive tree groves |
| Sirmione | Famous for its thermal baths and historical sites, Sirmione is a hotspot for tourists. Its unique attractions make it a lucrative Airbnb market. | Scaliger Castle, Grottoes of Catullus, Thermal spas, Jamaica Beach, Local restaurants |
| Toscolano Maderno | Offers both lake access and mountainous terrain, ideal for a range of outdoor activities. The charm of this town attracts both hikers and lake enthusiasts. | Beaches, Mountains for hiking, Art galleries, Local olive oil, Nature parks |
Understanding Airbnb License Requirements & STR Laws in Puegnago del Garda (2025)
Yes, Puegnago del Garda, Lombardy, Italy enforces high STR regulations. Obtaining a license and ensuring compliance is almost certainly required according to current 2025 STR laws. Always verify the latest short term rental regulations and Airbnb license requirements directly with local government authorities for Puegnago del Garda to ensure full compliance before hosting.
(Source: AirROI data, 2025, based on 67% licensed listings)
Top Performing Airbnb Properties in Puegnago del Garda (2025)
Benchmark your potential! Explore examples of top-performing Airbnb properties in Puegnago del Gardabased on Trailing Twelve Month (TTM) revenue. Analyze their characteristics, revenue, occupancy rate, and ADR to understand what drives success in this market.
"Poderi La Rocchetta" - Luxury Estate above Salò
Entire Place • 6 bedrooms
Erholung pur: Traumhaftes Ferienhaus am Gardasee
Entire Place • 5 bedrooms
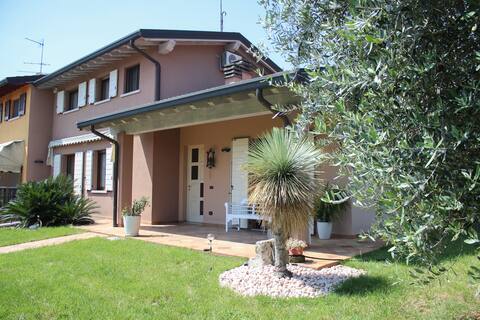
![[Near Lake] House with Pool and Solarium Area](https://a0.muscache.com/im/pictures/miso/Hosting-918554933961312394/original/c0afefc2-1396-48fe-8084-d954c936bbe7.jpeg?im_w=480&im_format=avif)
[Near Lake] House with Pool and Solarium Area
Entire Place • 2 bedrooms
La Torretta by Garda FeWo
Entire Place • N/A
Villa Fiorita a Puegnago By Bookinggardalake
Entire Place • 3 bedrooms
Villa Anna Miralago
Entire Place • 3 bedrooms
Note: Performance varies based on location, size, amenities, seasonality, and management quality. Data reflects the past 12 months.
Top Performing Airbnb Hosts in Puegnago del Garda (2025)
Learn from the best! This table showcases top-performing Airbnb hosts in Puegnago del Garda based on the number of properties managed and estimated total revenue over the past year. Analyze their scale and performance metrics.
| Host Name | Properties | Grossing Revenue | Stay Reviews | Avg Rating |
|---|---|---|---|---|
| Giulia | 1 | $170,381 | 19 | 5.00/5.0 |
| Sara | 10 | $92,946 | 230 | 4.72/5.0 |
| LagoVacanze | 3 | $71,122 | 16 | 3.30/5.0 |
| Anna | 4 | $65,006 | 102 | 3.70/5.0 |
| Christine Alice | 5 | $53,656 | 11 | 2.00/5.0 |
| Host #80849673 | 1 | $45,017 | 8 | 4.88/5.0 |
| Anna & Cristina | 2 | $39,300 | 7 | 2.43/5.0 |
| Daniele | 1 | $39,095 | 20 | 4.90/5.0 |
| Booking Garda Lake | 2 | $37,667 | 13 | 4.75/5.0 |
| Anna | 1 | $34,451 | 15 | 5.00/5.0 |
Analyzing the strategies of top hosts, such as their property selection, pricing, and guest communication, can offer valuable lessons for optimizing your own Airbnb operations in Puegnago del Garda.
Dive Deeper: Advanced Puegnago del Garda STR Market Data (2025)
Ready to unlock more insights? AirROI provides access to advanced metrics and comprehensive Airbnb data for Puegnago del Garda. Explore detailed analytics beyond this report to refine your investment strategy, optimize pricing, and maximize your vacation rental profits.
Explore Advanced MetricsPuegnago del Garda Short-Term Rental Market Composition (2025): Property & Room Types
Room Type Distribution
Property Type Distribution
Market Composition Insights for Puegnago del Garda
- The Puegnago del Garda Airbnb market composition is heavily skewed towards Entire Home/Apt listings, which make up 79.5% of the 73 active rentals. This indicates strong guest preference for privacy and space.
- Looking at the property type distribution in Puegnago del Garda, Apartment/Condo properties are the most common (57.5%), reflecting the local real estate landscape.
- Houses represent a significant 24.7% portion, catering likely to families or larger groups.
- The presence of 16.4% Hotel/Boutique listings indicates integration with traditional hospitality.
- Smaller segments like outdoor/unique (combined 1.4%) offer potential for unique stay experiences.
Puegnago del Garda Airbnb Room Capacity Analysis (2025): Bedroom Distribution
Distribution of Listings by Number of Bedrooms
Room Capacity Insights for Puegnago del Garda
- The dominant room capacity in Puegnago del Garda is 1 bedroom listings, making up 54.8% of the market. This suggests a strong demand for properties suitable for couples or solo travelers.
- Together, 1 bedroom and 2 bedrooms properties represent 69.9% of the active Airbnb listings in Puegnago del Garda, indicating a high concentration in these sizes.
- With over half the market (54.8%) consisting of studios or 1-bedroom units, Puegnago del Garda is particularly well-suited for individuals or couples.
Puegnago del Garda Vacation Rental Guest Capacity Trends (2025)
Distribution of Listings by Guest Capacity
Guest Capacity Insights for Puegnago del Garda
- The most common guest capacity trend in Puegnago del Garda vacation rentals is listings accommodating 4 guests (39.7%). This suggests the primary traveler segment is likely small families or groups.
- Properties designed for 4 guests and 2 guests dominate the Puegnago del Garda STR market, accounting for 54.8% of listings.
- 23.2% of properties accommodate 6+ guests, serving the market segment for larger families or group travel in Puegnago del Garda.
- On average, properties in Puegnago del Garda are equipped to host 3.9 guests.
Puegnago del Garda Airbnb Booking Patterns (2025): Available vs. Booked Days
Available Days Distribution
Booked Days Distribution
Booking Pattern Insights for Puegnago del Garda
- The most common availability pattern in Puegnago del Garda falls within the 271-366 days range, representing 65.8% of listings. This suggests many properties have significant open periods on their calendars.
- Approximately 93.2% of listings show high availability (181+ days open annually), indicating potential for increased bookings or specific owner usage patterns.
- For booked days, the 31-90 days range is most frequent in Puegnago del Garda (39.7%), reflecting common guest stay durations or potential owner blocking patterns.
- A notable 9.6% of properties secure long booking periods (181+ days booked per year), highlighting successful long-term rental strategies or significant owner usage.
Puegnago del Garda Airbnb Minimum Stay Requirements Analysis
Distribution of Listings by Minimum Night Requirement
1 Night
19 listings
27.9% of total
2 Nights
20 listings
29.4% of total
3 Nights
9 listings
13.2% of total
4-6 Nights
11 listings
16.2% of total
7-29 Nights
4 listings
5.9% of total
30+ Nights
5 listings
7.4% of total
Key Insights
- The most prevalent minimum stay requirement in Puegnago del Garda is 2 Nights, adopted by 29.4% of listings. This highlights the market's preference for shorter, flexible bookings.
Recommendations
- Align with the market by considering a 2 Nights minimum stay, as 29.4% of Puegnago del Garda hosts use this setting.
- If feasible, allowing 1-night stays, especially midweek or during low season, could capture last-minute bookings, as only 27.9% currently do.
- Explore offering discounts for stays of 30+ nights to attract the 7.4% of the market seeking extended stays.
- Adjust minimum nights based on seasonality – potentially shorter during low season and longer during peak demand periods in Puegnago del Garda.
Puegnago del Garda Airbnb Cancellation Policy Trends Analysis (2025)
Super Strict 30 Days
1 listings
1.8% of total
Flexible
11 listings
20% of total
Moderate
19 listings
34.5% of total
Strict
24 listings
43.6% of total
Cancellation Policy Insights for Puegnago del Garda
- The prevailing Airbnb cancellation policy trend in Puegnago del Garda is Strict, used by 43.6% of listings.
- There's a relatively balanced mix between guest-friendly (54.5%) and stricter (43.6%) policies, offering choices for different guest needs.
Recommendations for Hosts
- Consider adopting a Strict policy to align with the 43.6% market standard in Puegnago del Garda.
- With 43.6% using Strict terms, this is a viable option in Puegnago del Garda, particularly for high-value properties or during peak demand periods.
- Regularly review your cancellation policy against competitors and market demand shifts in Puegnago del Garda.
Puegnago del Garda STR Booking Lead Time Analysis (2025)
Average Booking Lead Time by Month
Booking Lead Time Insights for Puegnago del Garda
- The overall average booking lead time for vacation rentals in Puegnago del Garda is 57 days.
- Guests book furthest in advance for stays during July (average 90 days), likely coinciding with peak travel demand or local events.
- The shortest booking windows occur for stays in February (average 28 days), indicating more last-minute travel plans during this time.
- Seasonally, Summer (82 days avg.) sees the longest lead times, while Winter (34 days avg.) has the shortest, reflecting typical travel planning cycles.
Recommendations for Hosts
- Use the overall average lead time (57 days) as a baseline for your pricing and availability strategy in Puegnago del Garda.
- For July stays, consider implementing length-of-stay discounts or slightly higher rates for bookings made less than 90 days out to capitalize on advance planning.
- Target marketing efforts for the Summer season well in advance (at least 82 days) to capture early planners.
- Monitor your own booking lead times against these Puegnago del Garda averages to identify opportunities for dynamic pricing adjustments.
Popular & Essential Airbnb Amenities in Puegnago del Garda (2025)
Amenity Prevalence
Amenity Insights for Puegnago del Garda
- Popular amenities like Heating, Wifi, TV are common but not universal. Offering these can provide a competitive edge.
- Warning: Wifi is not universally provided but is considered essential globally. Ensure reliable Wifi is offered.
Recommendations for Hosts
- Consider adding popular differentiators like Heating or Wifi to increase appeal.
- Highlight unique or less common amenities you offer (e.g., hot tub, dedicated workspace, EV charger) in your listing description and photos.
- Regularly check competitor amenities in Puegnago del Garda to stay competitive.
Puegnago del Garda Airbnb Guest Demographics & Profile Analysis (2025)
Guest Profile Summary for Puegnago del Garda
- The typical guest profile for Airbnb in Puegnago del Garda consists of predominantly international visitors (84%), with top international origins including Italy, typically belonging to the Post-2000s (Gen Z/Alpha) group (50%), primarily speaking English or German.
- Domestic travelers account for 16.1% of guests.
- Key international markets include Germany (36.9%) and Italy (16.1%).
- Top languages spoken are English (38.5%) followed by German (22.1%).
- A significant demographic segment is the Post-2000s (Gen Z/Alpha) group, representing 50% of guests.
Recommendations for Hosts
- Focus marketing internationally, particularly towards travelers from Italy.
- Tailor amenities and listing descriptions to appeal to the dominant Post-2000s (Gen Z/Alpha) demographic (e.g., highlight fast WiFi, smart home features, local guides).
- Highlight unique local experiences or amenities relevant to the primary guest profile.
- Consider seasonal promotions aligned with peak travel times for key origin markets.
Nearby Short-Term Rental Market Comparison
How does the Puegnago del Garda Airbnb market stack up against its neighbors? Compare key performance metrics like average monthly revenue, ADR, and occupancy rates in surrounding areas to understand the broader regional STR landscape.
| Market | Active Properties | Monthly Revenue | Daily Rate | Avg. Occupancy |
|---|---|---|---|---|
| Laglio | 64 | $4,873 | $463.61 | 47% |
| Urtijëi - St. Ulrich in Gröden - Ortisei | 163 | $4,698 | $630.45 | 40% |
| Moos in Passeier - Moso in Passiria | 17 | $4,619 | $547.60 | 27% |
| Brenzone sul Garda | 19 | $4,128 | $335.25 | 52% |
| Portofino | 68 | $4,086 | $454.35 | 44% |
| Sala Comacina | 64 | $3,794 | $400.27 | 50% |
| Bellagio | 373 | $3,630 | $328.26 | 55% |
| Oliveto Lario | 99 | $3,509 | $327.42 | 55% |
| Varenna | 216 | $3,419 | $272.27 | 56% |
| Carate Urio | 71 | $3,379 | $331.90 | 44% |