Ponte di Legno Airbnb Market Analysis 2025: Short Term Rental Data & Vacation Rental Statistics in Lombardy, Italy
Is Airbnb profitable in Ponte di Legno in 2025? Explore comprehensive Airbnb analytics for Ponte di Legno, Lombardy, Italy to uncover income potential. This 2025 STR market report for Ponte di Legno, based on AirROI data from April 2024 to March 2025, reveals key trends in the niche market of 104 active listings.
Whether you're considering an Airbnb investment in Ponte di Legno, optimizing your existing vacation rental, or exploring rental arbitrage opportunities, understanding the Ponte di Legno Airbnb data is crucial. Navigating the high regulation landscape is key to maximizing your short term rental income potential. Let's dive into the specifics.
Key Ponte di Legno Airbnb Performance Metrics Overview
Monthly Airbnb Revenue Variations & Income Potential in Ponte di Legno (2025)
Understanding the monthly revenue variations for Airbnb listings in Ponte di Legno is key to maximizing your short term rental income potential. Seasonality significantly impacts earnings. Our analysis, based on data from the past 12 months, shows that the peak revenue month for STRs in Ponte di Legno is typically February, while September often presents the lowest earnings, highlighting opportunities for strategic pricing adjustments during shoulder and low seasons. Explore the typical Airbnb income in Ponte di Legno across different performance tiers:
- Best-in-class properties (Top 10%) achieve $4,018+ monthly, often utilizing dynamic pricing and superior guest experiences.
- Strong performing properties (Top 25%) earn $2,504 or more, indicating effective management and desirable locations/amenities.
- Typical properties (Median) generate around $1,311 per month, representing the average market performance.
- Entry-level properties (Bottom 25%) see earnings around $676, often with potential for optimization.
Average Monthly Airbnb Earnings Trend in Ponte di Legno
Ponte di Legno Airbnb Occupancy Rate Trends (2025)
Maximize your bookings by understanding the Ponte di Legno STR occupancy trends. Seasonal demand shifts significantly influence how often properties are booked. Typically, Februarysees the highest demand (peak season occupancy), while October experiences the lowest (low season). Effective strategies, like adjusting minimum stays or offering promotions, can boost occupancy during slower periods. Here's how different property tiers perform in Ponte di Legno:
- Best-in-class properties (Top 10%) achieve 64%+ occupancy, indicating high desirability and potentially optimized availability.
- Strong performing properties (Top 25%) maintain 43% or higher occupancy, suggesting good market fit and guest satisfaction.
- Typical properties (Median) have an occupancy rate around 25%.
- Entry-level properties (Bottom 25%) average 12% occupancy, potentially facing higher vacancy.
Average Monthly Occupancy Rate Trend in Ponte di Legno
Average Daily Rate (ADR) Airbnb Trends in Ponte di Legno (2025)
Effective short term rental pricing strategy in Ponte di Legno involves understanding monthly ADR fluctuations. The Average Daily Rate (ADR) for Airbnb in Ponte di Legno typically peaks in December and dips lowest during November. Leveraging Airbnb dynamic pricing tools or strategies based on this seasonality can significantly boost revenue. Here's a look at the typical nightly rates achieved:
- Best-in-class properties (Top 10%) command rates of $298+ per night, often due to premium features or locations.
- Strong performing properties (Top 25%) achieve nightly rates of $226 or more.
- Typical properties (Median) charge around $169 per night.
- Entry-level properties (Bottom 25%) earn around $121 per night.
Average Daily Rate (ADR) Trend by Month in Ponte di Legno
Get Live Ponte di Legno Market Intelligence 👇

Explore Real-time Analytics
Airbnb Seasonality Analysis & Trends in Ponte di Legno (2025)
Peak Season (February, January, August)
- Revenue averages $2,733 per month
- Occupancy rates average 46.8%
- Daily rates average $201
Shoulder Season
- Revenue averages $1,898 per month
- Occupancy maintains around 27.4%
- Daily rates hold near $193
Low Season (September, October, November)
- Revenue drops to average $973 per month
- Occupancy decreases to average 19.6%
- Daily rates adjust to average $181
Seasonality Insights for Ponte di Legno
- The Airbnb seasonality in Ponte di Legno shows highly seasonal trends requiring careful strategy. While the sections above show seasonal averages, it's also insightful to look at the extremes:
- During the high season, the absolute peak month showcases Ponte di Legno's highest earning potential, with monthly revenues capable of climbing to $3,220, occupancy reaching a high of 56.6%, and ADRs peaking at $211.
- Conversely, the slowest single month of the year, typically falling within the low season, marks the market's lowest point. In this month, revenue might dip to $916, occupancy could drop to 17.2%, and ADRs may adjust down to $177.
- Understanding both the seasonal averages and these monthly peaks and troughs in revenue, occupancy, and ADR is crucial for maximizing your Airbnb profit potential in Ponte di Legno.
Seasonal Strategies for Maximizing Profit
- Peak Season: Maximize revenue through premium pricing and potentially longer minimum stays. Ensure high availability.
- Low Season: Offer competitive pricing, special promotions (e.g., extended stay discounts), and flexible cancellation policies. Target off-season travelers like remote workers or budget-conscious guests.
- Shoulder Seasons: Implement dynamic pricing that balances peak and low rates. Target weekend travelers or specific events. Offer slightly more flexible terms than peak season.
- Regularly analyze your own performance against these Ponte di Legno seasonality benchmarks and adjust your pricing and availability strategy accordingly.
Best Areas for Airbnb Investment in Ponte di Legno (2025)
Exploring the top neighborhoods for short-term rentals in Ponte di Legno? This section highlights key areas, outlining why they are attractive for hosts and guests, along with notable local attractions. Consider these locations based on your target guest profile and investment strategy.
| Neighborhood / Area | Why Host Here? (Target Guests & Appeal) | Key Attractions & Landmarks |
|---|---|---|
| Centro di Ponte di Legno | The heart of Ponte di Legno, ideal for visitors wanting to explore local shops, restaurants, and the beautiful surroundings. Perfect for those who appreciate a lively atmosphere with convenient access to ski slopes and hiking trails. | Ponte di Legno Ski Resort, La Baita del Parco, Chiesa di San Giovanni Battista, Parco Adamello, Monte Stelvio |
| Passo del Tonale | A strategic location known for its ski resorts and winter sports activities. Attracts both winter sports enthusiasts and families looking for a ski vacation in the Italian Alps. | Passo del Tonale Ski Area, Glaciar Presena, Parco Nazionale dello Stelvio, Snowpark Tonale |
| Valle di Sole | Renowned for its natural beauty and outdoor recreational opportunities. A great spot for eco-tourism and summer activities like hiking, rafting, and mountain biking. | Rafting on the Noce River, Hiking trails, Natural parks, Local agriturismos |
| Temù | A small, charming village close to Ponte di Legno, known for its skiing and access to the Adamello National Park. Suitable for guests who prefer a quieter retreat. | Temù Ski Area, Adamello National Park, Historical sites, Beautiful landscapes |
| Monno | A picturesque area with stunning mountain views, perfect for guests looking for peace and tranquility away from the more touristy spots. | Hiking routes, Scenic viewpoints, Traditional mountain cuisine |
| Ski Area Adamello | A massive ski area that connects various resorts, making it a prime destination for winter sports lovers and people looking to enjoy the high-altitude lifestyle. | Extensive ski trails, Snowboard parks, Apres-ski activities |
| Folgaria | A vibrant ski town with a wide range of activities both in winter and summer, appealing to families and outdoor enthusiasts. | Ski slopes, Hiking paths, Folgaria Golf Club, Traditional markets |
| Borno | A lesser-known gem offering peaceful hiking trails and winter sports, attracting those looking for an authentic Italian mountain experience. | Borno Ski Area, Local festivals, Mountain huts, Tranquil nature walks |
Understanding Airbnb License Requirements & STR Laws in Ponte di Legno (2025)
Yes, Ponte di Legno, Lombardy, Italy enforces high STR regulations. Obtaining a license and ensuring compliance is almost certainly required according to current 2025 STR laws. Always verify the latest short term rental regulations and Airbnb license requirements directly with local government authorities for Ponte di Legno to ensure full compliance before hosting.
(Source: AirROI data, 2025, based on 52% licensed listings)
Top Performing Airbnb Properties in Ponte di Legno (2025)
Benchmark your potential! Explore examples of top-performing Airbnb properties in Ponte di Legnobased on Trailing Twelve Month (TTM) revenue. Analyze their characteristics, revenue, occupancy rate, and ADR to understand what drives success in this market.
![[Chalet Moderno overlooking the Alps] 800 meters from the Plants](https://a0.muscache.com/im/pictures/hosting/Hosting-U3RheVN1cHBseUxpc3Rpbmc6MTE2MDkzODcxNzA4NzkxMzU0NQ%3D%3D/original/360b051e-5bbe-4c1c-94c4-67ea295d1a28.jpeg?im_w=480&im_format=avif)
[Chalet Moderno overlooking the Alps] 800 meters from the Plants
Entire Place • 2 bedrooms
Casa di Beatrice
Entire Place • 3 bedrooms
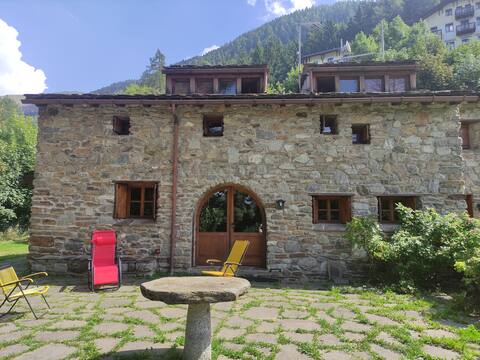
Chalet surrounded by nature
Entire Place • 4 bedrooms

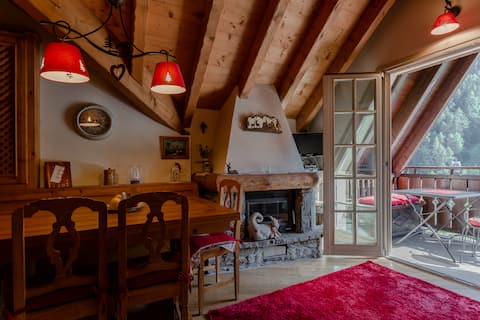
Romantic with a view, attic, in a villa.
Entire Place • 5 bedrooms
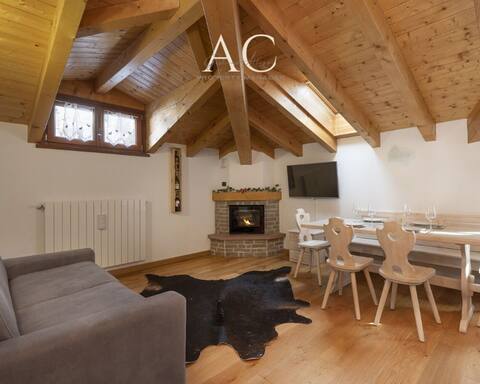
La Mansarda
Entire Place • 2 bedrooms
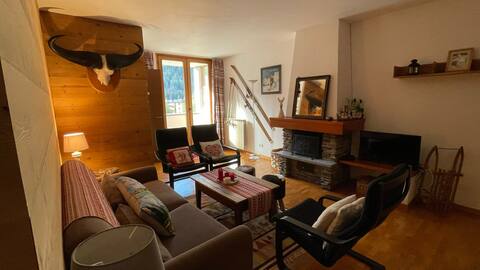
Nice place for 8
Entire Place • 3 bedrooms
Note: Performance varies based on location, size, amenities, seasonality, and management quality. Data reflects the past 12 months.
Top Performing Airbnb Hosts in Ponte di Legno (2025)
Learn from the best! This table showcases top-performing Airbnb hosts in Ponte di Legno based on the number of properties managed and estimated total revenue over the past year. Analyze their scale and performance metrics.
| Host Name | Properties | Grossing Revenue | Stay Reviews | Avg Rating |
|---|---|---|---|---|
| Ac | 6 | $103,004 | 11 | 1.64/5.0 |
| Silvia | 4 | $79,962 | 37 | 4.84/5.0 |
| Sebastiano | 2 | $57,187 | 10 | 2.50/5.0 |
| Pietro | 1 | $53,740 | 41 | 4.98/5.0 |
| Marco | 3 | $52,054 | 3 | 1.67/5.0 |
| Roberta | 2 | $49,873 | 24 | 5.00/5.0 |
| Host #178972576 | 1 | $48,244 | 5 | 4.40/5.0 |
| Maddalena | 1 | $46,459 | 30 | 4.90/5.0 |
| Vita SRL | 5 | $45,710 | 19 | 3.96/5.0 |
| Claudio | 1 | $44,581 | 18 | 4.83/5.0 |
Analyzing the strategies of top hosts, such as their property selection, pricing, and guest communication, can offer valuable lessons for optimizing your own Airbnb operations in Ponte di Legno.
Dive Deeper: Advanced Ponte di Legno STR Market Data (2025)
Ready to unlock more insights? AirROI provides access to advanced metrics and comprehensive Airbnb data for Ponte di Legno. Explore detailed analytics beyond this report to refine your investment strategy, optimize pricing, and maximize your vacation rental profits.
Explore Advanced MetricsPonte di Legno Short-Term Rental Market Composition (2025): Property & Room Types
Room Type Distribution
Property Type Distribution
Market Composition Insights for Ponte di Legno
- The Ponte di Legno Airbnb market composition is heavily skewed towards Entire Home/Apt listings, which make up 100% of the 104 active rentals. This indicates strong guest preference for privacy and space.
- Looking at the property type distribution in Ponte di Legno, Apartment/Condo properties are the most common (76.9%), reflecting the local real estate landscape.
- Houses represent a significant 18.3% portion, catering likely to families or larger groups.
- Smaller segments like outdoor/unique, unique stays (combined 4.8%) offer potential for unique stay experiences.
Ponte di Legno Airbnb Room Capacity Analysis (2025): Bedroom Distribution
Distribution of Listings by Number of Bedrooms
Room Capacity Insights for Ponte di Legno
- The dominant room capacity in Ponte di Legno is 2 bedrooms listings, making up 45.2% of the market. This suggests a strong demand for properties suitable for couples or solo travelers.
- Together, 2 bedrooms and 1 bedroom properties represent 84.6% of the active Airbnb listings in Ponte di Legno, indicating a high concentration in these sizes.
Ponte di Legno Vacation Rental Guest Capacity Trends (2025)
Distribution of Listings by Guest Capacity
Guest Capacity Insights for Ponte di Legno
- The most common guest capacity trend in Ponte di Legno vacation rentals is listings accommodating 4 guests (36.5%). This suggests the primary traveler segment is likely small families or groups.
- Properties designed for 4 guests and 6 guests dominate the Ponte di Legno STR market, accounting for 58.6% of listings.
- 37.5% of properties accommodate 6+ guests, serving the market segment for larger families or group travel in Ponte di Legno.
- On average, properties in Ponte di Legno are equipped to host 5.1 guests.
Ponte di Legno Airbnb Booking Patterns (2025): Available vs. Booked Days
Available Days Distribution
Booked Days Distribution
Booking Pattern Insights for Ponte di Legno
- The most common availability pattern in Ponte di Legno falls within the 271-366 days range, representing 70.2% of listings. This suggests many properties have significant open periods on their calendars.
- Approximately 95.2% of listings show high availability (181+ days open annually), indicating potential for increased bookings or specific owner usage patterns.
- For booked days, the 31-90 days range is most frequent in Ponte di Legno (39.4%), reflecting common guest stay durations or potential owner blocking patterns.
- A notable 4.8% of properties secure long booking periods (181+ days booked per year), highlighting successful long-term rental strategies or significant owner usage.
Ponte di Legno Airbnb Minimum Stay Requirements Analysis
Distribution of Listings by Minimum Night Requirement
1 Night
7 listings
7.7% of total
2 Nights
20 listings
22% of total
3 Nights
8 listings
8.8% of total
4-6 Nights
17 listings
18.7% of total
7-29 Nights
15 listings
16.5% of total
30+ Nights
24 listings
26.4% of total
Key Insights
- The most prevalent minimum stay requirement in Ponte di Legno is 30+ Nights, adopted by 26.4% of listings. This highlights the market's preference for longer commitments.
- A significant segment (26.4%) caters to monthly stays (30+ nights) in Ponte di Legno, pointing to opportunities in the extended-stay market.
Recommendations
- Align with the market by considering a 30+ Nights minimum stay, as 26.4% of Ponte di Legno hosts use this setting.
- If feasible, allowing 1-night stays, especially midweek or during low season, could capture last-minute bookings, as only 7.7% currently do.
- Explore offering discounts for stays of 30+ nights to attract the 26.4% of the market seeking extended stays.
- Adjust minimum nights based on seasonality – potentially shorter during low season and longer during peak demand periods in Ponte di Legno.
Ponte di Legno Airbnb Cancellation Policy Trends Analysis (2025)
Super Strict 60 Days
1 listings
1.3% of total
Super Strict 30 Days
1 listings
1.3% of total
Flexible
8 listings
10.5% of total
Moderate
37 listings
48.7% of total
Strict
29 listings
38.2% of total
Cancellation Policy Insights for Ponte di Legno
- The prevailing Airbnb cancellation policy trend in Ponte di Legno is Moderate, used by 48.7% of listings.
- There's a relatively balanced mix between guest-friendly (59.2%) and stricter (38.2%) policies, offering choices for different guest needs.
Recommendations for Hosts
- Consider adopting a Moderate policy to align with the 48.7% market standard in Ponte di Legno.
- With 38.2% using Strict terms, this is a viable option in Ponte di Legno, particularly for high-value properties or during peak demand periods.
- Regularly review your cancellation policy against competitors and market demand shifts in Ponte di Legno.
Ponte di Legno STR Booking Lead Time Analysis (2025)
Average Booking Lead Time by Month
Booking Lead Time Insights for Ponte di Legno
- The overall average booking lead time for vacation rentals in Ponte di Legno is 63 days.
- Guests book furthest in advance for stays during February (average 80 days), likely coinciding with peak travel demand or local events.
- The shortest booking windows occur for stays in May (average 40 days), indicating more last-minute travel plans during this time.
- Seasonally, Winter (74 days avg.) sees the longest lead times, while Fall (48 days avg.) has the shortest, reflecting typical travel planning cycles.
Recommendations for Hosts
- Use the overall average lead time (63 days) as a baseline for your pricing and availability strategy in Ponte di Legno.
- For February stays, consider implementing length-of-stay discounts or slightly higher rates for bookings made less than 80 days out to capitalize on advance planning.
- Target marketing efforts for the Winter season well in advance (at least 74 days) to capture early planners.
- Monitor your own booking lead times against these Ponte di Legno averages to identify opportunities for dynamic pricing adjustments.
Popular & Essential Airbnb Amenities in Ponte di Legno (2025)
Amenity Prevalence
Amenity Insights for Ponte di Legno
- Essential amenities in Ponte di Legno that guests expect include: Kitchen, TV, Heating, Hot water. Lacking these (any) could significantly impact bookings.
- Popular amenities like Dishes and silverware, Washer, Refrigerator are common but not universal. Offering these can provide a competitive edge.
Recommendations for Hosts
- Ensure your listing includes all essential amenities for Ponte di Legno: Kitchen, TV, Heating, Hot water.
- Prioritize adding missing essentials: TV, Heating, Hot water.
- Consider adding popular differentiators like Dishes and silverware or Washer to increase appeal.
- Highlight unique or less common amenities you offer (e.g., hot tub, dedicated workspace, EV charger) in your listing description and photos.
- Regularly check competitor amenities in Ponte di Legno to stay competitive.
Ponte di Legno Airbnb Guest Demographics & Profile Analysis (2025)
Guest Profile Summary for Ponte di Legno
- The typical guest profile for Airbnb in Ponte di Legno consists of primarily domestic travelers (73%), often arriving from nearby Milan, typically belonging to the Post-2000s (Gen Z/Alpha) group (50%), primarily speaking English or Italian.
- Domestic travelers account for 72.6% of guests.
- Key international markets include Italy (72.6%) and United Kingdom (3.3%).
- Top languages spoken are English (37.3%) followed by Italian (30.3%).
- A significant demographic segment is the Post-2000s (Gen Z/Alpha) group, representing 50% of guests.
Recommendations for Hosts
- Target domestic marketing efforts towards travelers from Milan and Rome.
- Tailor amenities and listing descriptions to appeal to the dominant Post-2000s (Gen Z/Alpha) demographic (e.g., highlight fast WiFi, smart home features, local guides).
- Highlight unique local experiences or amenities relevant to the primary guest profile.
- Consider seasonal promotions aligned with peak travel times for key origin markets.
Nearby Short-Term Rental Market Comparison
How does the Ponte di Legno Airbnb market stack up against its neighbors? Compare key performance metrics like average monthly revenue, ADR, and occupancy rates in surrounding areas to understand the broader regional STR landscape.
| Market | Active Properties | Monthly Revenue | Daily Rate | Avg. Occupancy |
|---|---|---|---|---|
| Laglio | 64 | $4,873 | $463.61 | 47% |
| Bayrischzell | 30 | $4,718 | $392.87 | 42% |
| Urtijëi - St. Ulrich in Gröden - Ortisei | 163 | $4,698 | $630.45 | 40% |
| Moos in Passeier - Moso in Passiria | 17 | $4,619 | $547.60 | 27% |
| Steinberg am Rofan | 11 | $4,394 | $311.71 | 40% |
| Brenzone sul Garda | 19 | $4,128 | $335.25 | 52% |
| Bürserberg | 40 | $3,978 | $342.57 | 41% |
| Sala Comacina | 64 | $3,794 | $400.27 | 50% |
| Bellagio | 373 | $3,630 | $328.26 | 55% |
| Brand | 56 | $3,597 | $486.13 | 33% |