Pero Airbnb Market Analysis 2025: Short Term Rental Data & Vacation Rental Statistics in Lombardy, Italy
Is Airbnb profitable in Pero in 2025? Explore comprehensive Airbnb analytics for Pero, Lombardy, Italy to uncover income potential. This 2025 STR market report for Pero, based on AirROI data from April 2024 to March 2025, reveals key trends in the niche market of 76 active listings.
Whether you're considering an Airbnb investment in Pero, optimizing your existing vacation rental, or exploring rental arbitrage opportunities, understanding the Pero Airbnb data is crucial. Navigating the high regulation landscape is key to maximizing your short term rental income potential. Let's dive into the specifics.
Key Pero Airbnb Performance Metrics Overview
Monthly Airbnb Revenue Variations & Income Potential in Pero (2025)
Understanding the monthly revenue variations for Airbnb listings in Pero is key to maximizing your short term rental income potential. Seasonality significantly impacts earnings. Our analysis, based on data from the past 12 months, shows that the peak revenue month for STRs in Pero is typically April, while March often presents the lowest earnings, highlighting opportunities for strategic pricing adjustments during shoulder and low seasons. Explore the typical Airbnb income in Pero across different performance tiers:
- Best-in-class properties (Top 10%) achieve $3,350+ monthly, often utilizing dynamic pricing and superior guest experiences.
- Strong performing properties (Top 25%) earn $2,326 or more, indicating effective management and desirable locations/amenities.
- Typical properties (Median) generate around $1,418 per month, representing the average market performance.
- Entry-level properties (Bottom 25%) see earnings around $621, often with potential for optimization.
Average Monthly Airbnb Earnings Trend in Pero
Pero Airbnb Occupancy Rate Trends (2025)
Maximize your bookings by understanding the Pero STR occupancy trends. Seasonal demand shifts significantly influence how often properties are booked. Typically, Novembersees the highest demand (peak season occupancy), while March experiences the lowest (low season). Effective strategies, like adjusting minimum stays or offering promotions, can boost occupancy during slower periods. Here's how different property tiers perform in Pero:
- Best-in-class properties (Top 10%) achieve 69%+ occupancy, indicating high desirability and potentially optimized availability.
- Strong performing properties (Top 25%) maintain 51% or higher occupancy, suggesting good market fit and guest satisfaction.
- Typical properties (Median) have an occupancy rate around 32%.
- Entry-level properties (Bottom 25%) average 16% occupancy, potentially facing higher vacancy.
Average Monthly Occupancy Rate Trend in Pero
Average Daily Rate (ADR) Airbnb Trends in Pero (2025)
Effective short term rental pricing strategy in Pero involves understanding monthly ADR fluctuations. The Average Daily Rate (ADR) for Airbnb in Pero typically peaks in April and dips lowest during August. Leveraging Airbnb dynamic pricing tools or strategies based on this seasonality can significantly boost revenue. Here's a look at the typical nightly rates achieved:
- Best-in-class properties (Top 10%) command rates of $202+ per night, often due to premium features or locations.
- Strong performing properties (Top 25%) achieve nightly rates of $146 or more.
- Typical properties (Median) charge around $116 per night.
- Entry-level properties (Bottom 25%) earn around $96 per night.
Average Daily Rate (ADR) Trend by Month in Pero
Get Live Pero Market Intelligence 👇

Explore Real-time Analytics
Airbnb Seasonality Analysis & Trends in Pero (2025)
Peak Season (April, May, November)
- Revenue averages $2,201 per month
- Occupancy rates average 36.5%
- Daily rates average $139
Shoulder Season
- Revenue averages $1,751 per month
- Occupancy maintains around 37.7%
- Daily rates hold near $134
Low Season (January, March, July)
- Revenue drops to average $1,174 per month
- Occupancy decreases to average 29.9%
- Daily rates adjust to average $130
Seasonality Insights for Pero
- The Airbnb seasonality in Pero shows highly seasonal trends requiring careful strategy. While the sections above show seasonal averages, it's also insightful to look at the extremes:
- During the high season, the absolute peak month showcases Pero's highest earning potential, with monthly revenues capable of climbing to $2,292, occupancy reaching a high of 43.9%, and ADRs peaking at $143.
- Conversely, the slowest single month of the year, typically falling within the low season, marks the market's lowest point. In this month, revenue might dip to $984, occupancy could drop to 25.2%, and ADRs may adjust down to $126.
- Understanding both the seasonal averages and these monthly peaks and troughs in revenue, occupancy, and ADR is crucial for maximizing your Airbnb profit potential in Pero.
Seasonal Strategies for Maximizing Profit
- Peak Season: Maximize revenue through premium pricing and potentially longer minimum stays. Ensure high availability.
- Low Season: Offer competitive pricing, special promotions (e.g., extended stay discounts), and flexible cancellation policies. Target off-season travelers like remote workers or budget-conscious guests.
- Shoulder Seasons: Implement dynamic pricing that balances peak and low rates. Target weekend travelers or specific events. Offer slightly more flexible terms than peak season.
- Regularly analyze your own performance against these Pero seasonality benchmarks and adjust your pricing and availability strategy accordingly.
Best Areas for Airbnb Investment in Pero (2025)
Exploring the top neighborhoods for short-term rentals in Pero? This section highlights key areas, outlining why they are attractive for hosts and guests, along with notable local attractions. Consider these locations based on your target guest profile and investment strategy.
| Neighborhood / Area | Why Host Here? (Target Guests & Appeal) | Key Attractions & Landmarks |
|---|---|---|
| Centro Storico | The historical center of Pero offers charming streets and landmarks, making it attractive for tourists interested in Italian culture and history. It's also close to public transport to Milan. | Castello Sforzesco, Piazza del Duomo, Leonardo da Vinci's Last Supper, La Scala Opera House, Galleria Vittorio Emanuele II |
| Parco delle Groane | This area offers beautiful natural landscapes and outdoor activities, attracting nature lovers and families looking for a peaceful retreat while still being near Milan. | Parco delle Groane, Cycling paths, Nature walks, Wildlife viewing |
| Fiera Milano | Near the Fiera di Milano exhibition center, it's perfect for business travelers and event attendees, ensuring high occupancy rates during trade shows and exhibitions. | Fiera Milano, Centro Nazionale della Previdenza e Assistenza per i Lavoratori Alcuni (CNA), Milano Congressi, Parks and restaurants nearby |
| Malpensa Airport | In proximity to one of Italy's major airports, appealing to international travelers looking for convenience for short stays or layovers. | Malpensa Airport shops, Car rental services, Nearby hotels and restaurants |
| Rho | Just a short distance from Pero, Rho offers additional amenities and attractions, drawing in visitors for its residential feel and access to public transport to Milan. | Rho Fiera Exhibition Center, Shopping malls, Local parks and cafes |
| Assago | An area known for large sports venues and cultural events, attracting fans and concert-goers. | Mediolanum Forum, Assago shopping center, Nearby parks and sports facilities |
| Sesto San Giovanni | A vibrant urban area with a mix of culture and commerce, appealing to those who enjoy city life with easy access to Milan. | CinePalace, Shopping malls, Museums and theaters |
| Cornaredo | A residential area that provides a cozy atmosphere, with parks and local eateries, making it suitable for families and short-term stays. | Local parks, Restaurants, Community events |
Understanding Airbnb License Requirements & STR Laws in Pero (2025)
Yes, Pero, Lombardy, Italy enforces high STR regulations. Obtaining a license and ensuring compliance is almost certainly required according to current 2025 STR laws. Always verify the latest short term rental regulations and Airbnb license requirements directly with local government authorities for Pero to ensure full compliance before hosting.
(Source: AirROI data, 2025, based on 61% licensed listings)
Top Performing Airbnb Properties in Pero (2025)
Benchmark your potential! Explore examples of top-performing Airbnb properties in Perobased on Trailing Twelve Month (TTM) revenue. Analyze their characteristics, revenue, occupancy rate, and ADR to understand what drives success in this market.

FAIR RHO/PERO - 4 rooms/4 baths
Entire Place • 4 bedrooms
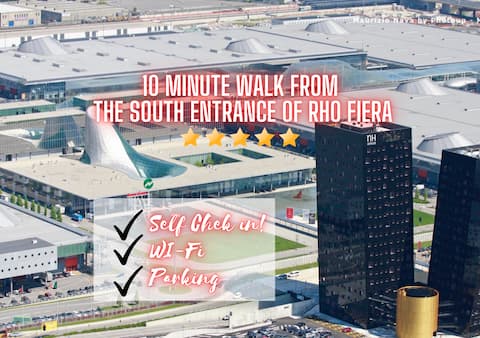
10min RhoFiera~10minMetro~Parking
Entire Place • 2 bedrooms
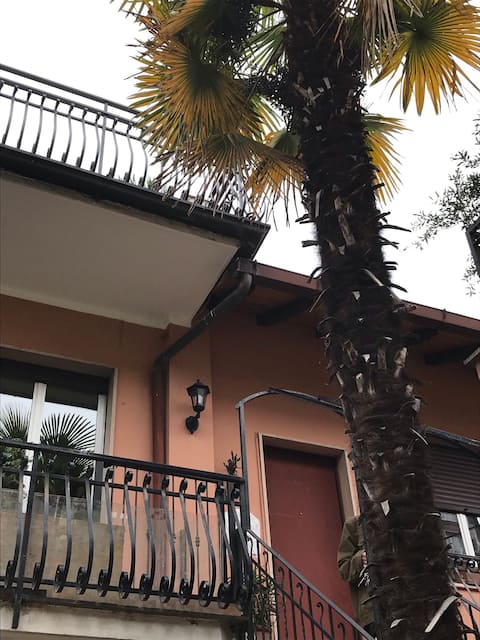
House with terrace and private parking metro Pero
Entire Place • 3 bedrooms
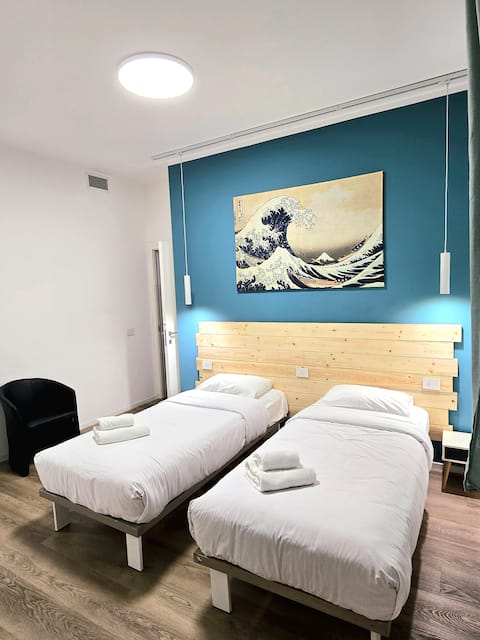
The Rooms Rho-Fiera Apartamento
Entire Place • 2 bedrooms
![[Rho-Fiera Milano] The Small Fair at 5 *](https://a0.muscache.com/im/pictures/miso/Hosting-1050005704622724499/original/6ef5eb78-ffb2-4956-a0f9-068b3fe22d45.jpeg?im_w=480&im_format=avif)
[Rho-Fiera Milano] The Small Fair at 5 *
Entire Place • 2 bedrooms

Rho Fiera Milano - Popy House
Entire Place • 1 bedroom
Note: Performance varies based on location, size, amenities, seasonality, and management quality. Data reflects the past 12 months.
Top Performing Airbnb Hosts in Pero (2025)
Learn from the best! This table showcases top-performing Airbnb hosts in Pero based on the number of properties managed and estimated total revenue over the past year. Analyze their scale and performance metrics.
| Host Name | Properties | Grossing Revenue | Stay Reviews | Avg Rating |
|---|---|---|---|---|
| Sara | 6 | $108,075 | 85 | 3.64/5.0 |
| Massimiliano | 2 | $94,231 | 99 | 4.80/5.0 |
| Nicholas | 1 | $66,611 | 8 | 4.50/5.0 |
| Qezi | 3 | $62,036 | 55 | 4.91/5.0 |
| Barbara | 1 | $50,736 | 101 | 4.98/5.0 |
| Evelyn | 2 | $47,273 | 81 | 4.96/5.0 |
| Antho | 1 | $41,999 | 6 | 5.00/5.0 |
| Luisa | 2 | $38,336 | 27 | 4.78/5.0 |
| Massimo Andrea | 1 | $36,302 | 8 | 4.63/5.0 |
| Nicola | 1 | $33,288 | 15 | 4.93/5.0 |
Analyzing the strategies of top hosts, such as their property selection, pricing, and guest communication, can offer valuable lessons for optimizing your own Airbnb operations in Pero.
Dive Deeper: Advanced Pero STR Market Data (2025)
Ready to unlock more insights? AirROI provides access to advanced metrics and comprehensive Airbnb data for Pero. Explore detailed analytics beyond this report to refine your investment strategy, optimize pricing, and maximize your vacation rental profits.
Explore Advanced MetricsPero Short-Term Rental Market Composition (2025): Property & Room Types
Room Type Distribution
Property Type Distribution
Market Composition Insights for Pero
- The Pero Airbnb market composition is heavily skewed towards Entire Home/Apt listings, which make up 84.2% of the 76 active rentals. This indicates strong guest preference for privacy and space.
- Looking at the property type distribution in Pero, Apartment/Condo properties are the most common (84.2%), reflecting the local real estate landscape.
- The presence of 5.3% Hotel/Boutique listings indicates integration with traditional hospitality.
- Smaller segments like others (combined 1.3%) offer potential for unique stay experiences.
Pero Airbnb Room Capacity Analysis (2025): Bedroom Distribution
Distribution of Listings by Number of Bedrooms
Room Capacity Insights for Pero
- The dominant room capacity in Pero is 1 bedroom listings, making up 52.6% of the market. This suggests a strong demand for properties suitable for couples or solo travelers.
- Together, 1 bedroom and 2 bedrooms properties represent 81.5% of the active Airbnb listings in Pero, indicating a high concentration in these sizes.
- With over half the market (52.6%) consisting of studios or 1-bedroom units, Pero is particularly well-suited for individuals or couples.
- Listings with 3+ bedrooms (5.2%) represent a smaller niche, potentially indicating an underserved market for larger group accommodations in Pero.
Pero Vacation Rental Guest Capacity Trends (2025)
Distribution of Listings by Guest Capacity
Guest Capacity Insights for Pero
- The most common guest capacity trend in Pero vacation rentals is listings accommodating 4 guests (31.6%). This suggests the primary traveler segment is likely small families or groups.
- Properties designed for 4 guests and 2 guests dominate the Pero STR market, accounting for 51.3% of listings.
- 18.4% of properties accommodate 6+ guests, serving the market segment for larger families or group travel in Pero.
- On average, properties in Pero are equipped to host 3.4 guests.
Pero Airbnb Booking Patterns (2025): Available vs. Booked Days
Available Days Distribution
Booked Days Distribution
Booking Pattern Insights for Pero
- The most common availability pattern in Pero falls within the 271-366 days range, representing 51.3% of listings. This suggests many properties have significant open periods on their calendars.
- Approximately 77.6% of listings show high availability (181+ days open annually), indicating potential for increased bookings or specific owner usage patterns.
- For booked days, the 31-90 days range is most frequent in Pero (34.2%), reflecting common guest stay durations or potential owner blocking patterns.
- A notable 26.3% of properties secure long booking periods (181+ days booked per year), highlighting successful long-term rental strategies or significant owner usage.
Pero Airbnb Minimum Stay Requirements Analysis
Distribution of Listings by Minimum Night Requirement
1 Night
28 listings
38.9% of total
2 Nights
23 listings
31.9% of total
3 Nights
6 listings
8.3% of total
4-6 Nights
1 listings
1.4% of total
7-29 Nights
6 listings
8.3% of total
30+ Nights
8 listings
11.1% of total
Key Insights
- The most prevalent minimum stay requirement in Pero is 1 Night, adopted by 38.9% of listings. This highlights the market's preference for shorter, flexible bookings.
- A strong majority (70.8%) of the Pero Airbnb data shows acceptance of very short stays (1-2 nights), indicating a dynamic, high-turnover market.
- A significant segment (11.1%) caters to monthly stays (30+ nights) in Pero, pointing to opportunities in the extended-stay market.
Recommendations
- Align with the market by considering a 1 Night minimum stay, as 38.9% of Pero hosts use this setting.
- Explore offering discounts for stays of 30+ nights to attract the 11.1% of the market seeking extended stays.
- Adjust minimum nights based on seasonality – potentially shorter during low season and longer during peak demand periods in Pero.
Pero Airbnb Cancellation Policy Trends Analysis (2025)
Super Strict 30 Days
1 listings
1.6% of total
Flexible
26 listings
41.3% of total
Moderate
31 listings
49.2% of total
Strict
5 listings
7.9% of total
Cancellation Policy Insights for Pero
- The prevailing Airbnb cancellation policy trend in Pero is Moderate, used by 49.2% of listings.
- The market strongly favors guest-friendly terms, with 90.5% of listings offering Flexible or Moderate policies. This suggests guests in Pero may expect booking flexibility.
- Strict cancellation policies are quite rare (7.9%), potentially making listings with this policy less competitive unless justified by high demand or property type.
Recommendations for Hosts
- Consider adopting a Moderate policy to align with the 49.2% market standard in Pero.
- Using a Strict policy might deter some guests, as only 7.9% of listings use it. Evaluate if potential revenue protection outweighs possible lower booking rates.
- Regularly review your cancellation policy against competitors and market demand shifts in Pero.
Pero STR Booking Lead Time Analysis (2025)
Average Booking Lead Time by Month
Booking Lead Time Insights for Pero
- The overall average booking lead time for vacation rentals in Pero is 50 days.
- Guests book furthest in advance for stays during August (average 115 days), likely coinciding with peak travel demand or local events.
- The shortest booking windows occur for stays in January (average 34 days), indicating more last-minute travel plans during this time.
- Seasonally, Summer (99 days avg.) sees the longest lead times, while Winter (48 days avg.) has the shortest, reflecting typical travel planning cycles.
Recommendations for Hosts
- Use the overall average lead time (50 days) as a baseline for your pricing and availability strategy in Pero.
- For August stays, consider implementing length-of-stay discounts or slightly higher rates for bookings made less than 115 days out to capitalize on advance planning.
- Target marketing efforts for the Summer season well in advance (at least 99 days) to capture early planners.
- Monitor your own booking lead times against these Pero averages to identify opportunities for dynamic pricing adjustments.
Popular & Essential Airbnb Amenities in Pero (2025)
Amenity Prevalence
Amenity Insights for Pero
- Essential amenities in Pero that guests expect include: Wifi. Lacking these (this) could significantly impact bookings.
- Popular amenities like Heating, TV, Kitchen are common but not universal. Offering these can provide a competitive edge.
Recommendations for Hosts
- Ensure your listing includes all essential amenities for Pero: Wifi.
- Prioritize adding missing essentials: Wifi.
- Consider adding popular differentiators like Heating or TV to increase appeal.
- Highlight unique or less common amenities you offer (e.g., hot tub, dedicated workspace, EV charger) in your listing description and photos.
- Regularly check competitor amenities in Pero to stay competitive.
Pero Airbnb Guest Demographics & Profile Analysis (2025)
Guest Profile Summary for Pero
- The typical guest profile for Airbnb in Pero consists of predominantly international visitors (69%), with top international origins including France, typically belonging to the Post-2000s (Gen Z/Alpha) group (50%), primarily speaking English or Italian.
- Domestic travelers account for 31.1% of guests.
- Key international markets include Italy (31.1%) and France (14.1%).
- Top languages spoken are English (37.3%) followed by Italian (15.9%).
- A significant demographic segment is the Post-2000s (Gen Z/Alpha) group, representing 50% of guests.
Recommendations for Hosts
- Focus marketing internationally, particularly towards travelers from France.
- Tailor amenities and listing descriptions to appeal to the dominant Post-2000s (Gen Z/Alpha) demographic (e.g., highlight fast WiFi, smart home features, local guides).
- Highlight unique local experiences or amenities relevant to the primary guest profile.
- Consider seasonal promotions aligned with peak travel times for key origin markets.
Nearby Short-Term Rental Market Comparison
How does the Pero Airbnb market stack up against its neighbors? Compare key performance metrics like average monthly revenue, ADR, and occupancy rates in surrounding areas to understand the broader regional STR landscape.
| Market | Active Properties | Monthly Revenue | Daily Rate | Avg. Occupancy |
|---|---|---|---|---|
| Grindelwald | 489 | $4,921 | $345.40 | 57% |
| Laglio | 64 | $4,873 | $463.61 | 47% |
| Brienz (BE) | 141 | $4,353 | $294.17 | 55% |
| Alpnach | 11 | $4,227 | $234.19 | 49% |
| Brenzone sul Garda | 19 | $4,128 | $335.25 | 52% |
| Portofino | 68 | $4,086 | $454.35 | 44% |
| Sala Comacina | 64 | $3,794 | $400.27 | 50% |
| Sachseln | 15 | $3,742 | $262.18 | 56% |
| Cossano Belbo | 13 | $3,632 | $284.21 | 42% |
| Bellagio | 373 | $3,630 | $328.26 | 55% |