Parabiago Airbnb Market Analysis 2025: Short Term Rental Data & Vacation Rental Statistics in Lombardy, Italy
Is Airbnb profitable in Parabiago in 2025? Explore comprehensive Airbnb analytics for Parabiago, Lombardy, Italy to uncover income potential. This 2025 STR market report for Parabiago, based on AirROI data from April 2024 to March 2025, reveals key trends in the niche market of 17 active listings.
Whether you're considering an Airbnb investment in Parabiago, optimizing your existing vacation rental, or exploring rental arbitrage opportunities, understanding the Parabiago Airbnb data is crucial. Navigating the high regulation landscape is key to maximizing your short term rental income potential. Let's dive into the specifics.
Key Parabiago Airbnb Performance Metrics Overview
Monthly Airbnb Revenue Variations & Income Potential in Parabiago (2025)
Understanding the monthly revenue variations for Airbnb listings in Parabiago is key to maximizing your short term rental income potential. Seasonality significantly impacts earnings. Our analysis, based on data from the past 12 months, shows that the peak revenue month for STRs in Parabiago is typically June, while March often presents the lowest earnings, highlighting opportunities for strategic pricing adjustments during shoulder and low seasons. Explore the typical Airbnb income in Parabiago across different performance tiers:
- Best-in-class properties (Top 10%) achieve $1,783+ monthly, often utilizing dynamic pricing and superior guest experiences.
- Strong performing properties (Top 25%) earn $1,284 or more, indicating effective management and desirable locations/amenities.
- Typical properties (Median) generate around $844 per month, representing the average market performance.
- Entry-level properties (Bottom 25%) see earnings around $468, often with potential for optimization.
Average Monthly Airbnb Earnings Trend in Parabiago
Parabiago Airbnb Occupancy Rate Trends (2025)
Maximize your bookings by understanding the Parabiago STR occupancy trends. Seasonal demand shifts significantly influence how often properties are booked. Typically, Septembersees the highest demand (peak season occupancy), while March experiences the lowest (low season). Effective strategies, like adjusting minimum stays or offering promotions, can boost occupancy during slower periods. Here's how different property tiers perform in Parabiago:
- Best-in-class properties (Top 10%) achieve 73%+ occupancy, indicating high desirability and potentially optimized availability.
- Strong performing properties (Top 25%) maintain 62% or higher occupancy, suggesting good market fit and guest satisfaction.
- Typical properties (Median) have an occupancy rate around 47%.
- Entry-level properties (Bottom 25%) average 24% occupancy, potentially facing higher vacancy.
Average Monthly Occupancy Rate Trend in Parabiago
Average Daily Rate (ADR) Airbnb Trends in Parabiago (2025)
Effective short term rental pricing strategy in Parabiago involves understanding monthly ADR fluctuations. The Average Daily Rate (ADR) for Airbnb in Parabiago typically peaks in August and dips lowest during February. Leveraging Airbnb dynamic pricing tools or strategies based on this seasonality can significantly boost revenue. Here's a look at the typical nightly rates achieved:
- Best-in-class properties (Top 10%) command rates of $92+ per night, often due to premium features or locations.
- Strong performing properties (Top 25%) achieve nightly rates of $75 or more.
- Typical properties (Median) charge around $62 per night.
- Entry-level properties (Bottom 25%) earn around $49 per night.
Average Daily Rate (ADR) Trend by Month in Parabiago
Get Live Parabiago Market Intelligence 👇

Explore Real-time Analytics
Airbnb Seasonality Analysis & Trends in Parabiago (2025)
Peak Season (June, May, April)
- Revenue averages $1,270 per month
- Occupancy rates average 48.4%
- Daily rates average $66
Shoulder Season
- Revenue averages $988 per month
- Occupancy maintains around 51.6%
- Daily rates hold near $67
Low Season (January, February, March)
- Revenue drops to average $590 per month
- Occupancy decreases to average 29.7%
- Daily rates adjust to average $66
Seasonality Insights for Parabiago
- The Airbnb seasonality in Parabiago shows highly seasonal trends requiring careful strategy. While the sections above show seasonal averages, it's also insightful to look at the extremes:
- During the high season, the absolute peak month showcases Parabiago's highest earning potential, with monthly revenues capable of climbing to $1,294, occupancy reaching a high of 63.9%, and ADRs peaking at $68.
- Conversely, the slowest single month of the year, typically falling within the low season, marks the market's lowest point. In this month, revenue might dip to $401, occupancy could drop to 20.8%, and ADRs may adjust down to $65.
- Understanding both the seasonal averages and these monthly peaks and troughs in revenue, occupancy, and ADR is crucial for maximizing your Airbnb profit potential in Parabiago.
Seasonal Strategies for Maximizing Profit
- Peak Season: Maximize revenue through premium pricing and potentially longer minimum stays. Ensure high availability.
- Low Season: Offer competitive pricing, special promotions (e.g., extended stay discounts), and flexible cancellation policies. Target off-season travelers like remote workers or budget-conscious guests.
- Shoulder Seasons: Implement dynamic pricing that balances peak and low rates. Target weekend travelers or specific events. Offer slightly more flexible terms than peak season.
- Regularly analyze your own performance against these Parabiago seasonality benchmarks and adjust your pricing and availability strategy accordingly.
Best Areas for Airbnb Investment in Parabiago (2025)
Exploring the top neighborhoods for short-term rentals in Parabiago? This section highlights key areas, outlining why they are attractive for hosts and guests, along with notable local attractions. Consider these locations based on your target guest profile and investment strategy.
| Neighborhood / Area | Why Host Here? (Target Guests & Appeal) | Key Attractions & Landmarks |
|---|---|---|
| Centro Storico | The historical center of Parabiago boasts charming architecture and a rich cultural heritage. It's a popular spot for tourists wanting to explore local cafes and shops. | Chiesa di San Lorenzo, Parco della Regione, Museo della Battaglia, Via Roma, Piazza della Libertà |
| Parco della Battaglia | A scenic area known for its parks and outdoor recreational facilities. Ideal for families and nature lovers looking for a relaxing stay. | Parco della Battaglia, Cycling paths, Playgrounds, Picnic areas, Green spaces |
| Frazione Dugnano | A quiet suburban area with good local amenities and transport links to nearby cities like Milan. Attractive for longer stays and business travelers. | Local markets, Shopping centers, Restaurants and cafes |
| Via Roma | The main thoroughfare of Parabiago lined with shops and eateries. A bustling area that attracts visitors looking to experience local daily life. | Shopping stores, Cafés, Restaurants |
| Cascina San Michele | A picturesque area on the outskirts offering a countryside feel while still being close to urban conveniences. Great for those seeking a retreat. | Countryside views, Walking trails, Local farms |
| Villastanza | A serene neighborhood with a small-town atmosphere preferred by families. Great for longer stays away from the city hustle. | Children's parks, Community events, Safe environments |
| Parabiago Tram Station | A convenient area for travelers due to its transport links, making it easy to access Milan and other nearby cities. Great for short stays. | Public transport, Local eateries, Shopping nearby |
| Via Giuseppe Garibaldi | A vibrant street known for its nightlife and dining options, attracting younger crowds and those looking for evening entertainment. | Bars and nightclubs, Restaurants, Street performances |
Understanding Airbnb License Requirements & STR Laws in Parabiago (2025)
Yes, Parabiago, Lombardy, Italy enforces high STR regulations. Obtaining a license and ensuring compliance is almost certainly required according to current 2025 STR laws. Always verify the latest short term rental regulations and Airbnb license requirements directly with local government authorities for Parabiago to ensure full compliance before hosting.
(Source: AirROI data, 2025, based on 76% licensed listings)
Top Performing Airbnb Properties in Parabiago (2025)
Benchmark your potential! Explore examples of top-performing Airbnb properties in Parabiagobased on Trailing Twelve Month (TTM) revenue. Analyze their characteristics, revenue, occupancy rate, and ADR to understand what drives success in this market.

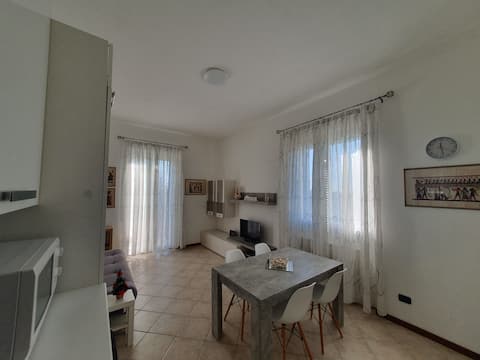
Meli's House
Entire Place • 2 bedrooms
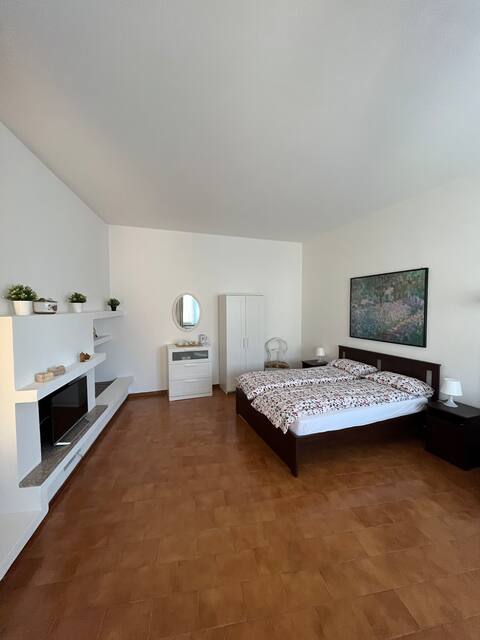
Apartment in Parabiago station
Entire Place • 1 bedroom
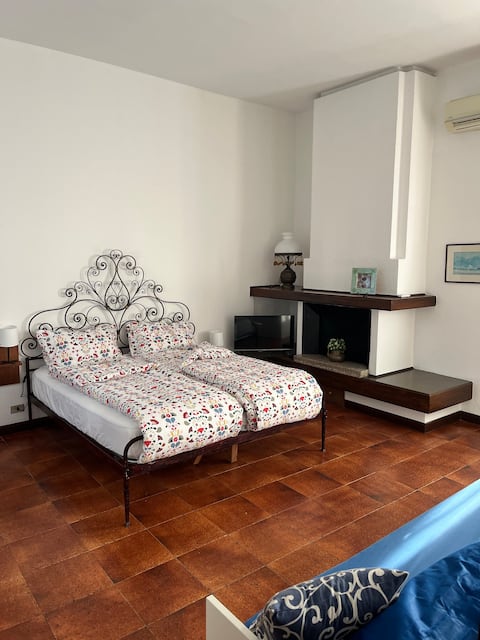
Cozy room with private bathroom
Private Room • N/A
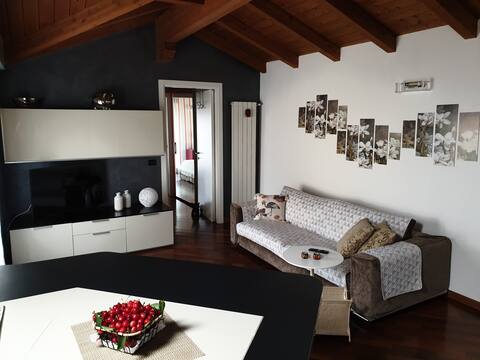
Cozy apartment 20 minutes from Milan
Entire Place • 1 bedroom
Like at home, for work and relaxation, Milano Rho Fiera
Entire Place • 1 bedroom
Domus Piso Vacanza Lavoro Fiera Rho Busisness
Entire Place • 1 bedroom
Note: Performance varies based on location, size, amenities, seasonality, and management quality. Data reflects the past 12 months.
Top Performing Airbnb Hosts in Parabiago (2025)
Learn from the best! This table showcases top-performing Airbnb hosts in Parabiago based on the number of properties managed and estimated total revenue over the past year. Analyze their scale and performance metrics.
| Host Name | Properties | Grossing Revenue | Stay Reviews | Avg Rating |
|---|---|---|---|---|
| Giovanna | 4 | $35,412 | 306 | 4.85/5.0 |
| Marco | 2 | $29,381 | 41 | 4.61/5.0 |
| Karin Melisa | 1 | $17,789 | 33 | 4.82/5.0 |
| Rosaria | 1 | $16,151 | 65 | 4.82/5.0 |
| Barbara | 1 | $12,152 | 73 | 4.92/5.0 |
| Givi | 1 | $11,490 | 4 | 4.75/5.0 |
| Francesco E Debora | 1 | $7,201 | 22 | 5.00/5.0 |
| Mattia | 1 | $4,113 | 6 | 5.00/5.0 |
| Valentina | 1 | $4,057 | 65 | 4.75/5.0 |
| Sonia | 2 | $2,880 | 44 | 4.85/5.0 |
Analyzing the strategies of top hosts, such as their property selection, pricing, and guest communication, can offer valuable lessons for optimizing your own Airbnb operations in Parabiago.
Dive Deeper: Advanced Parabiago STR Market Data (2025)
Ready to unlock more insights? AirROI provides access to advanced metrics and comprehensive Airbnb data for Parabiago. Explore detailed analytics beyond this report to refine your investment strategy, optimize pricing, and maximize your vacation rental profits.
Explore Advanced MetricsParabiago Short-Term Rental Market Composition (2025): Property & Room Types
Room Type Distribution
Property Type Distribution
Market Composition Insights for Parabiago
- The Parabiago Airbnb market composition is heavily skewed towards Entire Home/Apt listings, which make up 82.4% of the 17 active rentals. This indicates strong guest preference for privacy and space.
- Looking at the property type distribution in Parabiago, Apartment/Condo properties are the most common (82.4%), reflecting the local real estate landscape.
- Houses represent a significant 17.6% portion, catering likely to families or larger groups.
Parabiago Airbnb Room Capacity Analysis (2025): Bedroom Distribution
Distribution of Listings by Number of Bedrooms
Room Capacity Insights for Parabiago
- The dominant room capacity in Parabiago is 1 bedroom listings, making up 52.9% of the market. This suggests a strong demand for properties suitable for couples or solo travelers.
- Together, 1 bedroom and 2 bedrooms properties represent 70.5% of the active Airbnb listings in Parabiago, indicating a high concentration in these sizes.
- With over half the market (52.9%) consisting of studios or 1-bedroom units, Parabiago is particularly well-suited for individuals or couples.
Parabiago Vacation Rental Guest Capacity Trends (2025)
Distribution of Listings by Guest Capacity
Guest Capacity Insights for Parabiago
- The most common guest capacity trend in Parabiago vacation rentals is listings accommodating 2 guests (52.9%). This suggests the primary traveler segment is likely couples or solo travelers.
- Properties designed for 2 guests and 4 guests dominate the Parabiago STR market, accounting for 64.7% of listings.
- A significant 52.9% of listings cater specifically to 1-2 guests, highlighting strong demand from couples and solo travelers in Parabiago.
- On average, properties in Parabiago are equipped to host 2.2 guests.
Parabiago Airbnb Booking Patterns (2025): Available vs. Booked Days
Available Days Distribution
Booked Days Distribution
Booking Pattern Insights for Parabiago
- The most common availability pattern in Parabiago falls within the 91-180 days range, representing 41.2% of listings. This suggests many properties have significant open periods on their calendars.
- Approximately 58.8% of listings show high availability (181+ days open annually), indicating potential for increased bookings or specific owner usage patterns.
- For booked days, the 181-270 days range is most frequent in Parabiago (41.2%), reflecting common guest stay durations or potential owner blocking patterns.
- A notable 41.2% of properties secure long booking periods (181+ days booked per year), highlighting successful long-term rental strategies or significant owner usage.
Parabiago Airbnb Minimum Stay Requirements Analysis
Distribution of Listings by Minimum Night Requirement
1 Night
2 listings
12.5% of total
2 Nights
8 listings
50% of total
3 Nights
3 listings
18.8% of total
4-6 Nights
2 listings
12.5% of total
7-29 Nights
1 listings
6.3% of total
Key Insights
- The most prevalent minimum stay requirement in Parabiago is 2 Nights, adopted by 50% of listings. This highlights the market's preference for shorter, flexible bookings.
- A strong majority (62.5%) of the Parabiago Airbnb data shows acceptance of very short stays (1-2 nights), indicating a dynamic, high-turnover market.
Recommendations
- Align with the market by considering a 2 Nights minimum stay, as 50% of Parabiago hosts use this setting.
- If feasible, allowing 1-night stays, especially midweek or during low season, could capture last-minute bookings, as only 12.5% currently do.
- A 2-night minimum appears standard (50%). Consider this for weekends or peak periods.
- Adjust minimum nights based on seasonality – potentially shorter during low season and longer during peak demand periods in Parabiago.
Parabiago Airbnb Cancellation Policy Trends Analysis (2025)
Flexible
11 listings
64.7% of total
Moderate
4 listings
23.5% of total
Strict
2 listings
11.8% of total
Cancellation Policy Insights for Parabiago
- The prevailing Airbnb cancellation policy trend in Parabiago is Flexible, used by 64.7% of listings.
- The market strongly favors guest-friendly terms, with 88.2% of listings offering Flexible or Moderate policies. This suggests guests in Parabiago may expect booking flexibility.
Recommendations for Hosts
- Consider adopting a Flexible policy to align with the 64.7% market standard in Parabiago.
- Given the high prevalence of Flexible policies (64.7%), offering this can enhance booking appeal, especially during shoulder seasons.
- Using a Strict policy might deter some guests, as only 11.8% of listings use it. Evaluate if potential revenue protection outweighs possible lower booking rates.
- Regularly review your cancellation policy against competitors and market demand shifts in Parabiago.
Parabiago STR Booking Lead Time Analysis (2025)
Average Booking Lead Time by Month
Booking Lead Time Insights for Parabiago
- The overall average booking lead time for vacation rentals in Parabiago is 34 days.
- Guests book furthest in advance for stays during April (average 53 days), likely coinciding with peak travel demand or local events.
- The shortest booking windows occur for stays in June (average 17 days), indicating more last-minute travel plans during this time.
- Seasonally, Spring (44 days avg.) sees the longest lead times, while Winter (26 days avg.) has the shortest, reflecting typical travel planning cycles.
Recommendations for Hosts
- Use the overall average lead time (34 days) as a baseline for your pricing and availability strategy in Parabiago.
- For April stays, consider implementing length-of-stay discounts or slightly higher rates for bookings made less than 53 days out to capitalize on advance planning.
- Target marketing efforts for the Spring season well in advance (at least 44 days) to capture early planners.
- Monitor your own booking lead times against these Parabiago averages to identify opportunities for dynamic pricing adjustments.
Popular & Essential Airbnb Amenities in Parabiago (2025)
Amenity Prevalence
Amenity Insights for Parabiago
- Essential amenities in Parabiago that guests expect include: Hair dryer. Lacking these (this) could significantly impact bookings.
- Popular amenities like Essentials, Heating, TV are common but not universal. Offering these can provide a competitive edge.
- Warning: Wifi is not universally provided but is considered essential globally. Ensure reliable Wifi is offered.
Recommendations for Hosts
- Ensure your listing includes all essential amenities for Parabiago: Hair dryer.
- Consider adding popular differentiators like Essentials or Heating to increase appeal.
- Highlight unique or less common amenities you offer (e.g., hot tub, dedicated workspace, EV charger) in your listing description and photos.
- Regularly check competitor amenities in Parabiago to stay competitive.
Parabiago Airbnb Guest Demographics & Profile Analysis (2025)
Guest Profile Summary for Parabiago
- The typical guest profile for Airbnb in Parabiago consists of a mix of domestic (55%) and international guests, often arriving from nearby Rome, typically belonging to the Post-2000s (Gen Z/Alpha) group (50%), primarily speaking English or Italian.
- Domestic travelers account for 54.8% of guests.
- Key international markets include Italy (54.8%) and France (8.3%).
- Top languages spoken are English (37.7%) followed by Italian (23%).
- A significant demographic segment is the Post-2000s (Gen Z/Alpha) group, representing 50% of guests.
Recommendations for Hosts
- Balance marketing efforts between domestic and international channels based on the guest mix.
- Tailor amenities and listing descriptions to appeal to the dominant Post-2000s (Gen Z/Alpha) demographic (e.g., highlight fast WiFi, smart home features, local guides).
- Highlight unique local experiences or amenities relevant to the primary guest profile.
- Consider seasonal promotions aligned with peak travel times for key origin markets.
Nearby Short-Term Rental Market Comparison
How does the Parabiago Airbnb market stack up against its neighbors? Compare key performance metrics like average monthly revenue, ADR, and occupancy rates in surrounding areas to understand the broader regional STR landscape.
| Market | Active Properties | Monthly Revenue | Daily Rate | Avg. Occupancy |
|---|---|---|---|---|
| Lauterbrunnen | 525 | $7,079 | $546.45 | 54% |
| Matten bei Interlaken | 52 | $5,674 | $316.63 | 63% |
| Iseltwald | 14 | $5,491 | $331.95 | 58% |
| Habkern | 13 | $5,382 | $344.74 | 50% |
| Interlaken | 288 | $4,987 | $310.52 | 56% |
| Grindelwald | 489 | $4,921 | $345.40 | 57% |
| Laglio | 64 | $4,873 | $463.61 | 47% |
| Zermatt | 734 | $4,604 | $463.00 | 46% |
| Oberhofen am Thunersee | 24 | $4,572 | $265.94 | 55% |
| Monteu Roero | 16 | $4,432 | $540.14 | 36% |