Monzambano Airbnb Market Analysis 2025: Short Term Rental Data & Vacation Rental Statistics in Lombardy, Italy
Is Airbnb profitable in Monzambano in 2025? Explore comprehensive Airbnb analytics for Monzambano, Lombardy, Italy to uncover income potential. This 2025 STR market report for Monzambano, based on AirROI data from April 2024 to March 2025, reveals key trends in the niche market of 41 active listings.
Whether you're considering an Airbnb investment in Monzambano, optimizing your existing vacation rental, or exploring rental arbitrage opportunities, understanding the Monzambano Airbnb data is crucial. Navigating the high regulation landscape is key to maximizing your short term rental income potential. Let's dive into the specifics.
Key Monzambano Airbnb Performance Metrics Overview
Monthly Airbnb Revenue Variations & Income Potential in Monzambano (2025)
Understanding the monthly revenue variations for Airbnb listings in Monzambano is key to maximizing your short term rental income potential. Seasonality significantly impacts earnings. Our analysis, based on data from the past 12 months, shows that the peak revenue month for STRs in Monzambano is typically May, while February often presents the lowest earnings, highlighting opportunities for strategic pricing adjustments during shoulder and low seasons. Explore the typical Airbnb income in Monzambano across different performance tiers:
- Best-in-class properties (Top 10%) achieve $2,998+ monthly, often utilizing dynamic pricing and superior guest experiences.
- Strong performing properties (Top 25%) earn $1,938 or more, indicating effective management and desirable locations/amenities.
- Typical properties (Median) generate around $1,119 per month, representing the average market performance.
- Entry-level properties (Bottom 25%) see earnings around $422, often with potential for optimization.
Average Monthly Airbnb Earnings Trend in Monzambano
Monzambano Airbnb Occupancy Rate Trends (2025)
Maximize your bookings by understanding the Monzambano STR occupancy trends. Seasonal demand shifts significantly influence how often properties are booked. Typically, Augustsees the highest demand (peak season occupancy), while February experiences the lowest (low season). Effective strategies, like adjusting minimum stays or offering promotions, can boost occupancy during slower periods. Here's how different property tiers perform in Monzambano:
- Best-in-class properties (Top 10%) achieve 74%+ occupancy, indicating high desirability and potentially optimized availability.
- Strong performing properties (Top 25%) maintain 48% or higher occupancy, suggesting good market fit and guest satisfaction.
- Typical properties (Median) have an occupancy rate around 25%.
- Entry-level properties (Bottom 25%) average 10% occupancy, potentially facing higher vacancy.
Average Monthly Occupancy Rate Trend in Monzambano
Average Daily Rate (ADR) Airbnb Trends in Monzambano (2025)
Effective short term rental pricing strategy in Monzambano involves understanding monthly ADR fluctuations. The Average Daily Rate (ADR) for Airbnb in Monzambano typically peaks in August and dips lowest during March. Leveraging Airbnb dynamic pricing tools or strategies based on this seasonality can significantly boost revenue. Here's a look at the typical nightly rates achieved:
- Best-in-class properties (Top 10%) command rates of $202+ per night, often due to premium features or locations.
- Strong performing properties (Top 25%) achieve nightly rates of $152 or more.
- Typical properties (Median) charge around $107 per night.
- Entry-level properties (Bottom 25%) earn around $82 per night.
Average Daily Rate (ADR) Trend by Month in Monzambano
Get Live Monzambano Market Intelligence 👇

Explore Real-time Analytics
Airbnb Seasonality Analysis & Trends in Monzambano (2025)
Peak Season (May, July, August)
- Revenue averages $2,139 per month
- Occupancy rates average 46.1%
- Daily rates average $129
Shoulder Season
- Revenue averages $1,393 per month
- Occupancy maintains around 33.7%
- Daily rates hold near $126
Low Season (February, March, December)
- Revenue drops to average $700 per month
- Occupancy decreases to average 17.3%
- Daily rates adjust to average $124
Seasonality Insights for Monzambano
- The Airbnb seasonality in Monzambano shows highly seasonal trends requiring careful strategy. While the sections above show seasonal averages, it's also insightful to look at the extremes:
- During the high season, the absolute peak month showcases Monzambano's highest earning potential, with monthly revenues capable of climbing to $2,210, occupancy reaching a high of 50.1%, and ADRs peaking at $131.
- Conversely, the slowest single month of the year, typically falling within the low season, marks the market's lowest point. In this month, revenue might dip to $408, occupancy could drop to 10.7%, and ADRs may adjust down to $123.
- Understanding both the seasonal averages and these monthly peaks and troughs in revenue, occupancy, and ADR is crucial for maximizing your Airbnb profit potential in Monzambano.
Seasonal Strategies for Maximizing Profit
- Peak Season: Maximize revenue through premium pricing and potentially longer minimum stays. Ensure high availability.
- Low Season: Offer competitive pricing, special promotions (e.g., extended stay discounts), and flexible cancellation policies. Target off-season travelers like remote workers or budget-conscious guests.
- Shoulder Seasons: Implement dynamic pricing that balances peak and low rates. Target weekend travelers or specific events. Offer slightly more flexible terms than peak season.
- Regularly analyze your own performance against these Monzambano seasonality benchmarks and adjust your pricing and availability strategy accordingly.
Best Areas for Airbnb Investment in Monzambano (2025)
Exploring the top neighborhoods for short-term rentals in Monzambano? This section highlights key areas, outlining why they are attractive for hosts and guests, along with notable local attractions. Consider these locations based on your target guest profile and investment strategy.
| Neighborhood / Area | Why Host Here? (Target Guests & Appeal) | Key Attractions & Landmarks |
|---|---|---|
| Lago di Garda | This beautiful lake is known for its stunning views, outdoor activities, and charming towns. It attracts a lot of tourists looking for leisure and watersports, making it prime for Airbnb hosting. | Bardolino, Sirmione, Malcesine, Limone sul Garda, Grotte di Catullo, Gardaland Amusement Park |
| Monzambano Town Center | The historic center of Monzambano offers a quaint Italian village experience with local shops, cafes, and a rich history. It's attractive for those wanting an authentic stay in the Lombardy region. | Castello di Monzambano, Local festivals, Countryside walks, Rural landscape, Traditional cuisine restaurants |
| Peschiera del Garda | Just a short drive from Monzambano, this town on the southeastern shore of Lake Garda is a popular tourist destination. It offers direct access to the lake and various recreational activities. | Fortress of Peschiera, Lake beaches, Garda Natura Park, La Caviggina swimming pool, Local food markets |
| Valeggio sul Mincio | Famous for its culinary offerings, particularly the tortellini, this town is known for its picturesque views and charm. It attracts food lovers and those appreciating nature. | Parco Sigurtà, Castello Scaligero, Local vineyards, Food festivals, Mincio River walks |
| Borghetto sul Mincio | A quaint medieval village on the banks of the Mincio River, known for its scenic views and historical architecture. Popular with tourists looking for a picturesque and romantic ambiance. | Old mills, Bridges, Lovely riverside cafes, Nature trails, Historic buildings |
| Desenzano del Garda | A vibrant town at the southern tip of Lake Garda, known for its lively atmosphere, nightlife, and town beach. It's a popular spot for tourists of all ages. | Desenzano Castle, Piazza Malvezzi, Local beaches, Shopping streets, Boat tours |
| Sirmione | This town is famous for its hot springs and historical ruins, particularly the Grotte di Catullo. It's a tourist magnet known for wellness and relaxation. | Grotte di Catullo, Scaligero Castle, Thermal spas, Sirmione's beaches, Pottery and craft shops |
| Lonato del Garda | Just a few kilometers from Monzambano, this town offers historical sites and a quieter experience with access to Lake Garda. It appeals to culture seekers and families. | Basilica of San Giovanni Battista, Castello di Lonato, Local parks, Museums, Quiet countryside |
Understanding Airbnb License Requirements & STR Laws in Monzambano (2025)
Yes, Monzambano, Lombardy, Italy enforces high STR regulations. Obtaining a license and ensuring compliance is almost certainly required according to current 2025 STR laws. Always verify the latest short term rental regulations and Airbnb license requirements directly with local government authorities for Monzambano to ensure full compliance before hosting.
(Source: AirROI data, 2025, based on 68% licensed listings)
Top Performing Airbnb Properties in Monzambano (2025)
Benchmark your potential! Explore examples of top-performing Airbnb properties in Monzambanobased on Trailing Twelve Month (TTM) revenue. Analyze their characteristics, revenue, occupancy rate, and ADR to understand what drives success in this market.
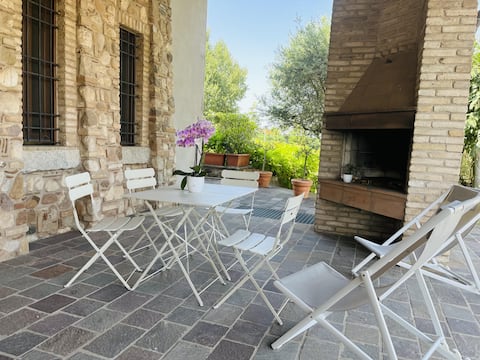
The village in the lakes
Entire Place • 4 bedrooms

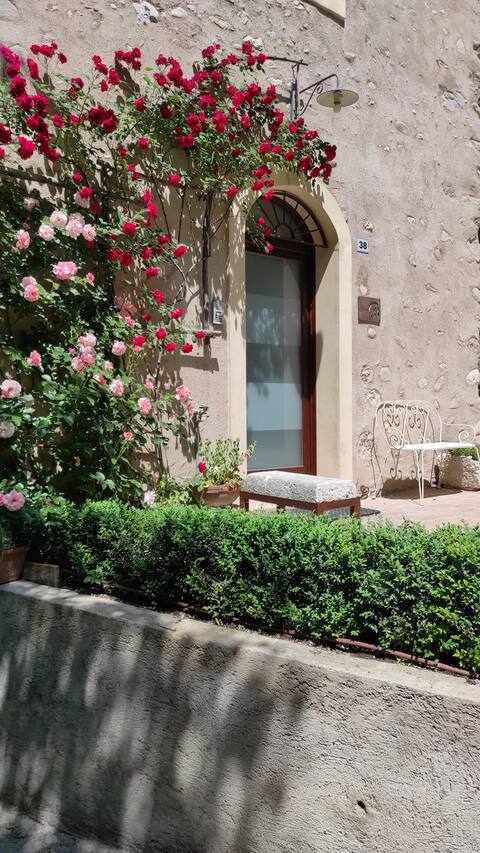
Charming duplex w private garden
Entire Place • 2 bedrooms
Three-room apartment 2 steps from the castle
Entire Place • 2 bedrooms
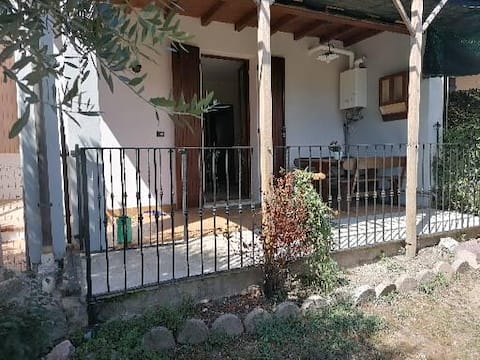
Apartment in a strategic location-Lago di Garda
Entire Place • 2 bedrooms
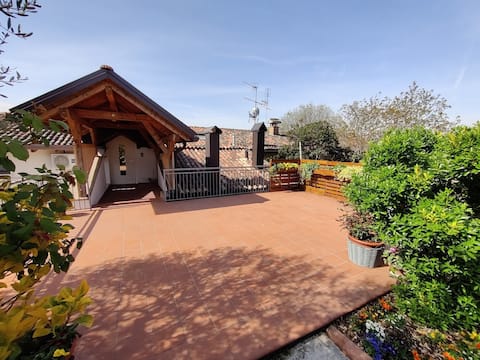
Medieval village house with garden and garage
Entire Place • 1 bedroom

"Spring Cottage" CIR 020036-CNI-00016
Entire Place • 2 bedrooms
Note: Performance varies based on location, size, amenities, seasonality, and management quality. Data reflects the past 12 months.
Top Performing Airbnb Hosts in Monzambano (2025)
Learn from the best! This table showcases top-performing Airbnb hosts in Monzambano based on the number of properties managed and estimated total revenue over the past year. Analyze their scale and performance metrics.
| Host Name | Properties | Grossing Revenue | Stay Reviews | Avg Rating |
|---|---|---|---|---|
| Maria Cristina | 2 | $55,351 | 97 | 4.97/5.0 |
| Flavia | 1 | $54,482 | 50 | 4.84/5.0 |
| Chiara | 3 | $47,049 | 57 | 4.96/5.0 |
| Host #386833261 | 1 | $35,231 | 5 | 5.00/5.0 |
| Francesca | 2 | $32,806 | 193 | 4.96/5.0 |
| Ivan | 2 | $31,225 | 82 | 4.96/5.0 |
| Chiara | 1 | $25,626 | 35 | 4.97/5.0 |
| Sylvia | 1 | $22,719 | 56 | 4.89/5.0 |
| Annamaria | 1 | $21,195 | 150 | 4.85/5.0 |
| Amedeo | 4 | $19,669 | 77 | 3.64/5.0 |
Analyzing the strategies of top hosts, such as their property selection, pricing, and guest communication, can offer valuable lessons for optimizing your own Airbnb operations in Monzambano.
Dive Deeper: Advanced Monzambano STR Market Data (2025)
Ready to unlock more insights? AirROI provides access to advanced metrics and comprehensive Airbnb data for Monzambano. Explore detailed analytics beyond this report to refine your investment strategy, optimize pricing, and maximize your vacation rental profits.
Explore Advanced MetricsMonzambano Short-Term Rental Market Composition (2025): Property & Room Types
Room Type Distribution
Property Type Distribution
Market Composition Insights for Monzambano
- The Monzambano Airbnb market composition is heavily skewed towards Entire Home/Apt listings, which make up 65.9% of the 41 active rentals. This indicates strong guest preference for privacy and space.
- However, a notable 34.1% share for Private Rooms suggests opportunities for budget-conscious travelers or hosts renting out spare rooms.
- Looking at the property type distribution in Monzambano, House properties are the most common (53.7%), reflecting the local real estate landscape.
- Houses represent a significant 53.7% portion, catering likely to families or larger groups.
- The presence of 19.5% Hotel/Boutique listings indicates integration with traditional hospitality.
- Smaller segments like others (combined 2.4%) offer potential for unique stay experiences.
Monzambano Airbnb Room Capacity Analysis (2025): Bedroom Distribution
Distribution of Listings by Number of Bedrooms
Room Capacity Insights for Monzambano
- The dominant room capacity in Monzambano is 1 bedroom listings, making up 46.3% of the market. This suggests a strong demand for properties suitable for couples or solo travelers.
- Together, 1 bedroom and 2 bedrooms properties represent 70.7% of the active Airbnb listings in Monzambano, indicating a high concentration in these sizes.
Monzambano Vacation Rental Guest Capacity Trends (2025)
Distribution of Listings by Guest Capacity
Guest Capacity Insights for Monzambano
- The most common guest capacity trend in Monzambano vacation rentals is listings accommodating 2 guests (26.8%). This suggests the primary traveler segment is likely couples or solo travelers.
- Properties designed for 2 guests and 4 guests dominate the Monzambano STR market, accounting for 43.9% of listings.
- 17.0% of properties accommodate 6+ guests, serving the market segment for larger families or group travel in Monzambano.
- On average, properties in Monzambano are equipped to host 3.2 guests.
Monzambano Airbnb Booking Patterns (2025): Available vs. Booked Days
Available Days Distribution
Booked Days Distribution
Booking Pattern Insights for Monzambano
- The most common availability pattern in Monzambano falls within the 271-366 days range, representing 53.7% of listings. This suggests many properties have significant open periods on their calendars.
- Approximately 80.5% of listings show high availability (181+ days open annually), indicating potential for increased bookings or specific owner usage patterns.
- For booked days, the 1-30 days range is most frequent in Monzambano (31.7%), reflecting common guest stay durations or potential owner blocking patterns.
- A notable 24.4% of properties secure long booking periods (181+ days booked per year), highlighting successful long-term rental strategies or significant owner usage.
Monzambano Airbnb Minimum Stay Requirements Analysis
Distribution of Listings by Minimum Night Requirement
1 Night
7 listings
18.9% of total
2 Nights
19 listings
51.4% of total
3 Nights
2 listings
5.4% of total
4-6 Nights
4 listings
10.8% of total
7-29 Nights
1 listings
2.7% of total
30+ Nights
4 listings
10.8% of total
Key Insights
- The most prevalent minimum stay requirement in Monzambano is 2 Nights, adopted by 51.4% of listings. This highlights the market's preference for shorter, flexible bookings.
- A strong majority (70.3%) of the Monzambano Airbnb data shows acceptance of very short stays (1-2 nights), indicating a dynamic, high-turnover market.
- A significant segment (10.8%) caters to monthly stays (30+ nights) in Monzambano, pointing to opportunities in the extended-stay market.
Recommendations
- Align with the market by considering a 2 Nights minimum stay, as 51.4% of Monzambano hosts use this setting.
- If feasible, allowing 1-night stays, especially midweek or during low season, could capture last-minute bookings, as only 18.9% currently do.
- A 2-night minimum appears standard (51.4%). Consider this for weekends or peak periods.
- Explore offering discounts for stays of 30+ nights to attract the 10.8% of the market seeking extended stays.
- Adjust minimum nights based on seasonality – potentially shorter during low season and longer during peak demand periods in Monzambano.
Monzambano Airbnb Cancellation Policy Trends Analysis (2025)
Super Strict 60 Days
1 listings
3.1% of total
Flexible
13 listings
40.6% of total
Moderate
14 listings
43.8% of total
Strict
4 listings
12.5% of total
Cancellation Policy Insights for Monzambano
- The prevailing Airbnb cancellation policy trend in Monzambano is Moderate, used by 43.8% of listings.
- The market strongly favors guest-friendly terms, with 84.4% of listings offering Flexible or Moderate policies. This suggests guests in Monzambano may expect booking flexibility.
Recommendations for Hosts
- Consider adopting a Moderate policy to align with the 43.8% market standard in Monzambano.
- Using a Strict policy might deter some guests, as only 12.5% of listings use it. Evaluate if potential revenue protection outweighs possible lower booking rates.
- Regularly review your cancellation policy against competitors and market demand shifts in Monzambano.
Monzambano STR Booking Lead Time Analysis (2025)
Average Booking Lead Time by Month
Booking Lead Time Insights for Monzambano
- The overall average booking lead time for vacation rentals in Monzambano is 54 days.
- Guests book furthest in advance for stays during February (average 107 days), likely coinciding with peak travel demand or local events.
- The shortest booking windows occur for stays in March (average 24 days), indicating more last-minute travel plans during this time.
- Seasonally, Winter (76 days avg.) sees the longest lead times, while Spring (51 days avg.) has the shortest, reflecting typical travel planning cycles.
Recommendations for Hosts
- Use the overall average lead time (54 days) as a baseline for your pricing and availability strategy in Monzambano.
- For February stays, consider implementing length-of-stay discounts or slightly higher rates for bookings made less than 107 days out to capitalize on advance planning.
- Target marketing efforts for the Winter season well in advance (at least 76 days) to capture early planners.
- Monitor your own booking lead times against these Monzambano averages to identify opportunities for dynamic pricing adjustments.
Popular & Essential Airbnb Amenities in Monzambano (2025)
Amenity Prevalence
Amenity Insights for Monzambano
- Essential amenities in Monzambano that guests expect include: Heating, Essentials. Lacking these (any) could significantly impact bookings.
- Popular amenities like Wifi, TV, Air conditioning are common but not universal. Offering these can provide a competitive edge.
- Warning: Wifi is not universally provided but is considered essential globally. Ensure reliable Wifi is offered.
Recommendations for Hosts
- Ensure your listing includes all essential amenities for Monzambano: Heating, Essentials.
- Prioritize adding missing essentials: Essentials.
- Consider adding popular differentiators like Wifi or TV to increase appeal.
- Highlight unique or less common amenities you offer (e.g., hot tub, dedicated workspace, EV charger) in your listing description and photos.
- Regularly check competitor amenities in Monzambano to stay competitive.
Monzambano Airbnb Guest Demographics & Profile Analysis (2025)
Guest Profile Summary for Monzambano
- The typical guest profile for Airbnb in Monzambano consists of predominantly international visitors (84%), with top international origins including Italy, typically belonging to the Post-2000s (Gen Z/Alpha) group (50%), primarily speaking English or German.
- Domestic travelers account for 16.5% of guests.
- Key international markets include Germany (29.9%) and Italy (16.5%).
- Top languages spoken are English (35.7%) followed by German (18.4%).
- A significant demographic segment is the Post-2000s (Gen Z/Alpha) group, representing 50% of guests.
Recommendations for Hosts
- Focus marketing internationally, particularly towards travelers from Italy.
- Tailor amenities and listing descriptions to appeal to the dominant Post-2000s (Gen Z/Alpha) demographic (e.g., highlight fast WiFi, smart home features, local guides).
- Highlight unique local experiences or amenities relevant to the primary guest profile.
- Consider seasonal promotions aligned with peak travel times for key origin markets.
Nearby Short-Term Rental Market Comparison
How does the Monzambano Airbnb market stack up against its neighbors? Compare key performance metrics like average monthly revenue, ADR, and occupancy rates in surrounding areas to understand the broader regional STR landscape.
| Market | Active Properties | Monthly Revenue | Daily Rate | Avg. Occupancy |
|---|---|---|---|---|
| Laglio | 64 | $4,873 | $463.61 | 47% |
| Urtijëi - St. Ulrich in Gröden - Ortisei | 163 | $4,698 | $630.45 | 40% |
| Moos in Passeier - Moso in Passiria | 17 | $4,619 | $547.60 | 27% |
| Brenzone sul Garda | 19 | $4,128 | $335.25 | 52% |
| Portofino | 68 | $4,086 | $454.35 | 44% |
| Sala Comacina | 64 | $3,794 | $400.27 | 50% |
| Bellagio | 373 | $3,630 | $328.26 | 55% |
| Oliveto Lario | 99 | $3,509 | $327.42 | 55% |
| Varenna | 216 | $3,419 | $272.27 | 56% |
| Carate Urio | 71 | $3,379 | $331.90 | 44% |