Moniga del Garda Airbnb Market Analysis 2025: Short Term Rental Data & Vacation Rental Statistics in Lombardy, Italy
Is Airbnb profitable in Moniga del Garda in 2025? Explore comprehensive Airbnb analytics for Moniga del Garda, Lombardy, Italy to uncover income potential. This 2025 STR market report for Moniga del Garda, based on AirROI data from April 2024 to March 2025, reveals key trends in the niche market of 83 active listings.
Whether you're considering an Airbnb investment in Moniga del Garda, optimizing your existing vacation rental, or exploring rental arbitrage opportunities, understanding the Moniga del Garda Airbnb data is crucial. Navigating the high regulation landscape is key to maximizing your short term rental income potential. Let's dive into the specifics.
Key Moniga del Garda Airbnb Performance Metrics Overview
Monthly Airbnb Revenue Variations & Income Potential in Moniga del Garda (2025)
Understanding the monthly revenue variations for Airbnb listings in Moniga del Garda is key to maximizing your short term rental income potential. Seasonality significantly impacts earnings. Our analysis, based on data from the past 12 months, shows that the peak revenue month for STRs in Moniga del Garda is typically August, while February often presents the lowest earnings, highlighting opportunities for strategic pricing adjustments during shoulder and low seasons. Explore the typical Airbnb income in Moniga del Garda across different performance tiers:
- Best-in-class properties (Top 10%) achieve $4,789+ monthly, often utilizing dynamic pricing and superior guest experiences.
- Strong performing properties (Top 25%) earn $2,710 or more, indicating effective management and desirable locations/amenities.
- Typical properties (Median) generate around $1,561 per month, representing the average market performance.
- Entry-level properties (Bottom 25%) see earnings around $763, often with potential for optimization.
Average Monthly Airbnb Earnings Trend in Moniga del Garda
Moniga del Garda Airbnb Occupancy Rate Trends (2025)
Maximize your bookings by understanding the Moniga del Garda STR occupancy trends. Seasonal demand shifts significantly influence how often properties are booked. Typically, Augustsees the highest demand (peak season occupancy), while January experiences the lowest (low season). Effective strategies, like adjusting minimum stays or offering promotions, can boost occupancy during slower periods. Here's how different property tiers perform in Moniga del Garda:
- Best-in-class properties (Top 10%) achieve 69%+ occupancy, indicating high desirability and potentially optimized availability.
- Strong performing properties (Top 25%) maintain 50% or higher occupancy, suggesting good market fit and guest satisfaction.
- Typical properties (Median) have an occupancy rate around 27%.
- Entry-level properties (Bottom 25%) average 13% occupancy, potentially facing higher vacancy.
Average Monthly Occupancy Rate Trend in Moniga del Garda
Average Daily Rate (ADR) Airbnb Trends in Moniga del Garda (2025)
Effective short term rental pricing strategy in Moniga del Garda involves understanding monthly ADR fluctuations. The Average Daily Rate (ADR) for Airbnb in Moniga del Garda typically peaks in August and dips lowest during February. Leveraging Airbnb dynamic pricing tools or strategies based on this seasonality can significantly boost revenue. Here's a look at the typical nightly rates achieved:
- Best-in-class properties (Top 10%) command rates of $436+ per night, often due to premium features or locations.
- Strong performing properties (Top 25%) achieve nightly rates of $254 or more.
- Typical properties (Median) charge around $149 per night.
- Entry-level properties (Bottom 25%) earn around $110 per night.
Average Daily Rate (ADR) Trend by Month in Moniga del Garda
Get Live Moniga del Garda Market Intelligence 👇

Explore Real-time Analytics
Airbnb Seasonality Analysis & Trends in Moniga del Garda (2025)
Peak Season (August, July, May)
- Revenue averages $4,017 per month
- Occupancy rates average 48.9%
- Daily rates average $248
Shoulder Season
- Revenue averages $2,149 per month
- Occupancy maintains around 32.2%
- Daily rates hold near $220
Low Season (January, February, December)
- Revenue drops to average $745 per month
- Occupancy decreases to average 18.6%
- Daily rates adjust to average $206
Seasonality Insights for Moniga del Garda
- The Airbnb seasonality in Moniga del Garda shows highly seasonal trends requiring careful strategy. While the sections above show seasonal averages, it's also insightful to look at the extremes:
- During the high season, the absolute peak month showcases Moniga del Garda's highest earning potential, with monthly revenues capable of climbing to $4,182, occupancy reaching a high of 56.2%, and ADRs peaking at $259.
- Conversely, the slowest single month of the year, typically falling within the low season, marks the market's lowest point. In this month, revenue might dip to $612, occupancy could drop to 14.9%, and ADRs may adjust down to $203.
- Understanding both the seasonal averages and these monthly peaks and troughs in revenue, occupancy, and ADR is crucial for maximizing your Airbnb profit potential in Moniga del Garda.
Seasonal Strategies for Maximizing Profit
- Peak Season: Maximize revenue through premium pricing and potentially longer minimum stays. Ensure high availability.
- Low Season: Offer competitive pricing, special promotions (e.g., extended stay discounts), and flexible cancellation policies. Target off-season travelers like remote workers or budget-conscious guests.
- Shoulder Seasons: Implement dynamic pricing that balances peak and low rates. Target weekend travelers or specific events. Offer slightly more flexible terms than peak season.
- Regularly analyze your own performance against these Moniga del Garda seasonality benchmarks and adjust your pricing and availability strategy accordingly.
Best Areas for Airbnb Investment in Moniga del Garda (2025)
Exploring the top neighborhoods for short-term rentals in Moniga del Garda? This section highlights key areas, outlining why they are attractive for hosts and guests, along with notable local attractions. Consider these locations based on your target guest profile and investment strategy.
| Neighborhood / Area | Why Host Here? (Target Guests & Appeal) | Key Attractions & Landmarks |
|---|---|---|
| Centro Storico | The historic center of Moniga del Garda boasts charming narrow streets, traditional Italian architecture, and a beautiful lakeside promenade. It's perfect for tourists wanting to immerse themselves in local culture and savor delicious cuisine at nearby restaurants. | Castello di Moniga, Lago di Garda promenade, local trattorias, Piazza San Giovanni, wine tasting venues |
| Porto di Moniga | The port area offers stunning views of Lake Garda and is surrounded by cozy cafes and restaurants. It's an ideal spot for guests who want to enjoy water activities and relax by the lakeshore. | Moniga harbor, boat rentals, water sports, gelato shops, Lake Garda beach |
| Collina di Moniga | The hills surrounding Moniga provide a picturesque landscape with vineyards and olive groves, appealing to guests seeking tranquility and beautiful scenery. Great for wine tourism. | Vineyard tours, olive oil farms, hiking trails, panoramic views of Lake Garda |
| Golf Club | The nearby golf club attracts golf enthusiasts and offers a luxurious environment. Ideal for guests who enjoy golfing and want a peaceful retreat in nature. | 18-hole golf course, clubhouse with restaurant, driving range, golfing events, scenic surroundings |
| Local Markets | The local markets in Moniga are vibrant and colorful, filled with fresh produce, artisan products, and local crafts, perfect for guests wanting to experience authentic Italian life. | Weekly farmers' market, artisan fairs, local cheese and wine tastings, handmade crafts |
| Beach Area | The beaches around Moniga are well-maintained, offering sunbathing, swimming, and family-friendly activities. A perfect spot for those looking to enjoy sun and water. | Lido di Moniga, beach clubs, water sports rentals, children's play areas, picnic spots |
| Vicolo Nuovo | This charming alleyway is lined with boutique shops and quaint cafes. It's a hidden gem for travelers looking to explore the less touristy parts of Moniga while enjoying good coffee and shopping. | local boutiques, cafes, art galleries, street art, patisseries |
| Villa Favorita | This villa area offers luxury accommodations with stunning views of the lake. It attracts visitors looking for an upscale experience and privacy, ideal for romantic getaways. | villa estates, private gardens, infinity pools, cooking classes, wine tasting events |
Understanding Airbnb License Requirements & STR Laws in Moniga del Garda (2025)
Yes, Moniga del Garda, Lombardy, Italy enforces high STR regulations. Obtaining a license and ensuring compliance is almost certainly required according to current 2025 STR laws. Always verify the latest short term rental regulations and Airbnb license requirements directly with local government authorities for Moniga del Garda to ensure full compliance before hosting.
(Source: AirROI data, 2025, based on 72% licensed listings)
Top Performing Airbnb Properties in Moniga del Garda (2025)
Benchmark your potential! Explore examples of top-performing Airbnb properties in Moniga del Gardabased on Trailing Twelve Month (TTM) revenue. Analyze their characteristics, revenue, occupancy rate, and ADR to understand what drives success in this market.
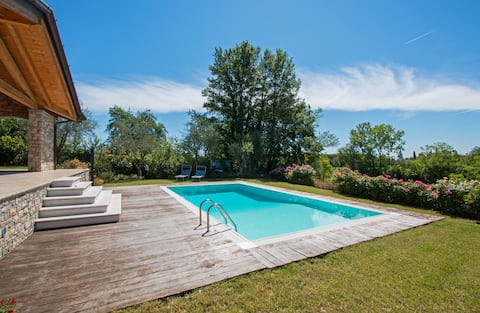
Wonderful Italy | Villa Marina con piscina
Entire Place • 4 bedrooms
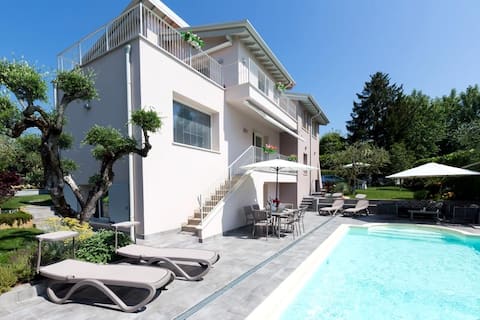
VILLA DANIELA with private pool and lake view
Entire Place • 5 bedrooms

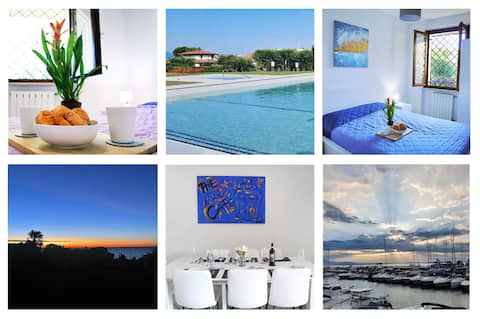
Relax al Porto lake view 2 rooms solarium & pool
Entire Place • 2 bedrooms
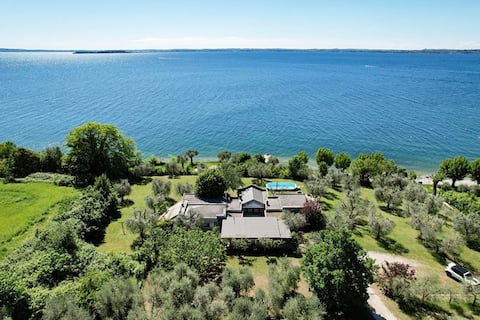
Villa al porto
Entire Place • 5 bedrooms
Casa Raffaella on the beach, pool, Ciao Vacanze
Entire Place • 3 bedrooms
![La casa di Monica [with swimming pool and terrace]](https://a0.muscache.com/im/ml/photo_enhancement/pictures/miso/Hosting-928751162196681065/original/68b8ba47-e3ce-4324-867c-49a06701e1fd.jpeg?im_w=480&im_format=avif)
La casa di Monica [with swimming pool and terrace]
Entire Place • 3 bedrooms
Note: Performance varies based on location, size, amenities, seasonality, and management quality. Data reflects the past 12 months.
Top Performing Airbnb Hosts in Moniga del Garda (2025)
Learn from the best! This table showcases top-performing Airbnb hosts in Moniga del Garda based on the number of properties managed and estimated total revenue over the past year. Analyze their scale and performance metrics.
| Host Name | Properties | Grossing Revenue | Stay Reviews | Avg Rating |
|---|---|---|---|---|
| AnnaHoliday | 12 | $238,149 | 281 | 4.72/5.0 |
| Wonderful Italy Garda | 3 | $148,796 | 36 | 4.25/5.0 |
| Elena Daniela | 1 | $90,834 | 29 | 5.00/5.0 |
| LagoVacanze | 10 | $75,690 | 115 | 4.45/5.0 |
| Kirill | 3 | $71,663 | 34 | 4.86/5.0 |
| Gerale Srl | 1 | $64,155 | 126 | 4.86/5.0 |
| Wilson | 1 | $62,700 | 19 | 4.95/5.0 |
| Lea - Interhome Group | 4 | $61,286 | 72 | 4.49/5.0 |
| Davide | 1 | $53,454 | 80 | 4.74/5.0 |
| Host #448205218 | 2 | $46,490 | 5 | 2.50/5.0 |
Analyzing the strategies of top hosts, such as their property selection, pricing, and guest communication, can offer valuable lessons for optimizing your own Airbnb operations in Moniga del Garda.
Dive Deeper: Advanced Moniga del Garda STR Market Data (2025)
Ready to unlock more insights? AirROI provides access to advanced metrics and comprehensive Airbnb data for Moniga del Garda. Explore detailed analytics beyond this report to refine your investment strategy, optimize pricing, and maximize your vacation rental profits.
Explore Advanced MetricsMoniga del Garda Short-Term Rental Market Composition (2025): Property & Room Types
Room Type Distribution
Property Type Distribution
Market Composition Insights for Moniga del Garda
- The Moniga del Garda Airbnb market composition is heavily skewed towards Entire Home/Apt listings, which make up 100% of the 83 active rentals. This indicates strong guest preference for privacy and space.
- Looking at the property type distribution in Moniga del Garda, Apartment/Condo properties are the most common (77.1%), reflecting the local real estate landscape.
- Houses represent a significant 22.9% portion, catering likely to families or larger groups.
Moniga del Garda Airbnb Room Capacity Analysis (2025): Bedroom Distribution
Distribution of Listings by Number of Bedrooms
Room Capacity Insights for Moniga del Garda
- The dominant room capacity in Moniga del Garda is 1 bedroom listings, making up 47% of the market. This suggests a strong demand for properties suitable for couples or solo travelers.
- Together, 1 bedroom and 2 bedrooms properties represent 80.7% of the active Airbnb listings in Moniga del Garda, indicating a high concentration in these sizes.
Moniga del Garda Vacation Rental Guest Capacity Trends (2025)
Distribution of Listings by Guest Capacity
Guest Capacity Insights for Moniga del Garda
- The most common guest capacity trend in Moniga del Garda vacation rentals is listings accommodating 4 guests (39.8%). This suggests the primary traveler segment is likely small families or groups.
- Properties designed for 4 guests and 6 guests dominate the Moniga del Garda STR market, accounting for 63.9% of listings.
- 37.3% of properties accommodate 6+ guests, serving the market segment for larger families or group travel in Moniga del Garda.
- On average, properties in Moniga del Garda are equipped to host 4.8 guests.
Moniga del Garda Airbnb Booking Patterns (2025): Available vs. Booked Days
Available Days Distribution
Booked Days Distribution
Booking Pattern Insights for Moniga del Garda
- The most common availability pattern in Moniga del Garda falls within the 271-366 days range, representing 66.3% of listings. This suggests many properties have significant open periods on their calendars.
- Approximately 92.8% of listings show high availability (181+ days open annually), indicating potential for increased bookings or specific owner usage patterns.
- For booked days, the 31-90 days range is most frequent in Moniga del Garda (42.2%), reflecting common guest stay durations or potential owner blocking patterns.
- A notable 8.4% of properties secure long booking periods (181+ days booked per year), highlighting successful long-term rental strategies or significant owner usage.
Moniga del Garda Airbnb Minimum Stay Requirements Analysis
Distribution of Listings by Minimum Night Requirement
1 Night
34 listings
45.9% of total
2 Nights
12 listings
16.2% of total
3 Nights
11 listings
14.9% of total
4-6 Nights
9 listings
12.2% of total
7-29 Nights
5 listings
6.8% of total
30+ Nights
3 listings
4.1% of total
Key Insights
- The most prevalent minimum stay requirement in Moniga del Garda is 1 Night, adopted by 45.9% of listings. This highlights the market's preference for shorter, flexible bookings.
- A strong majority (62.1%) of the Moniga del Garda Airbnb data shows acceptance of very short stays (1-2 nights), indicating a dynamic, high-turnover market.
Recommendations
- Align with the market by considering a 1 Night minimum stay, as 45.9% of Moniga del Garda hosts use this setting.
- Adjust minimum nights based on seasonality – potentially shorter during low season and longer during peak demand periods in Moniga del Garda.
Moniga del Garda Airbnb Cancellation Policy Trends Analysis (2025)
Super Strict 30 Days
7 listings
9.7% of total
Super Strict 60 Days
2 listings
2.8% of total
Flexible
9 listings
12.5% of total
Moderate
32 listings
44.4% of total
Strict
22 listings
30.6% of total
Cancellation Policy Insights for Moniga del Garda
- The prevailing Airbnb cancellation policy trend in Moniga del Garda is Moderate, used by 44.4% of listings.
- There's a relatively balanced mix between guest-friendly (56.9%) and stricter (30.6%) policies, offering choices for different guest needs.
Recommendations for Hosts
- Consider adopting a Moderate policy to align with the 44.4% market standard in Moniga del Garda.
- With 30.6% using Strict terms, this is a viable option in Moniga del Garda, particularly for high-value properties or during peak demand periods.
- Regularly review your cancellation policy against competitors and market demand shifts in Moniga del Garda.
Moniga del Garda STR Booking Lead Time Analysis (2025)
Average Booking Lead Time by Month
Booking Lead Time Insights for Moniga del Garda
- The overall average booking lead time for vacation rentals in Moniga del Garda is 71 days.
- Guests book furthest in advance for stays during May (average 120 days), likely coinciding with peak travel demand or local events.
- The shortest booking windows occur for stays in February (average 26 days), indicating more last-minute travel plans during this time.
- Seasonally, Fall (92 days avg.) sees the longest lead times, while Winter (30 days avg.) has the shortest, reflecting typical travel planning cycles.
Recommendations for Hosts
- Use the overall average lead time (71 days) as a baseline for your pricing and availability strategy in Moniga del Garda.
- For May stays, consider implementing length-of-stay discounts or slightly higher rates for bookings made less than 120 days out to capitalize on advance planning.
- Target marketing efforts for the Fall season well in advance (at least 92 days) to capture early planners.
- Monitor your own booking lead times against these Moniga del Garda averages to identify opportunities for dynamic pricing adjustments.
Popular & Essential Airbnb Amenities in Moniga del Garda (2025)
Amenity Prevalence
Amenity Insights for Moniga del Garda
- Essential amenities in Moniga del Garda that guests expect include: Wifi, TV, Kitchen. Lacking these (any) could significantly impact bookings.
- Popular amenities like Heating, Hot water, Dishes and silverware are common but not universal. Offering these can provide a competitive edge.
Recommendations for Hosts
- Ensure your listing includes all essential amenities for Moniga del Garda: Wifi, TV, Kitchen.
- Prioritize adding missing essentials: Wifi, TV, Kitchen.
- Consider adding popular differentiators like Heating or Hot water to increase appeal.
- Highlight unique or less common amenities you offer (e.g., hot tub, dedicated workspace, EV charger) in your listing description and photos.
- Regularly check competitor amenities in Moniga del Garda to stay competitive.
Moniga del Garda Airbnb Guest Demographics & Profile Analysis (2025)
Guest Profile Summary for Moniga del Garda
- The typical guest profile for Airbnb in Moniga del Garda consists of predominantly international visitors (91%), with top international origins including United Kingdom, typically belonging to the Post-2000s (Gen Z/Alpha) group (50%), primarily speaking English or German.
- Domestic travelers account for 9.0% of guests.
- Key international markets include Germany (35.4%) and United Kingdom (10.1%).
- Top languages spoken are English (41.5%) followed by German (21.2%).
- A significant demographic segment is the Post-2000s (Gen Z/Alpha) group, representing 50% of guests.
Recommendations for Hosts
- Focus marketing internationally, particularly towards travelers from United Kingdom.
- Tailor amenities and listing descriptions to appeal to the dominant Post-2000s (Gen Z/Alpha) demographic (e.g., highlight fast WiFi, smart home features, local guides).
- Highlight unique local experiences or amenities relevant to the primary guest profile.
- Consider seasonal promotions aligned with peak travel times for key origin markets.
Nearby Short-Term Rental Market Comparison
How does the Moniga del Garda Airbnb market stack up against its neighbors? Compare key performance metrics like average monthly revenue, ADR, and occupancy rates in surrounding areas to understand the broader regional STR landscape.
| Market | Active Properties | Monthly Revenue | Daily Rate | Avg. Occupancy |
|---|---|---|---|---|
| Laglio | 64 | $4,873 | $463.61 | 47% |
| Urtijëi - St. Ulrich in Gröden - Ortisei | 163 | $4,698 | $630.45 | 40% |
| Moos in Passeier - Moso in Passiria | 17 | $4,619 | $547.60 | 27% |
| Brenzone sul Garda | 19 | $4,128 | $335.25 | 52% |
| Portofino | 68 | $4,086 | $454.35 | 44% |
| Sala Comacina | 64 | $3,794 | $400.27 | 50% |
| Bellagio | 373 | $3,630 | $328.26 | 55% |
| Oliveto Lario | 99 | $3,509 | $327.42 | 55% |
| Varenna | 216 | $3,419 | $272.27 | 56% |
| Carate Urio | 71 | $3,379 | $331.90 | 44% |