Legnano Airbnb Market Analysis 2025: Short Term Rental Data & Vacation Rental Statistics in Lombardy, Italy
Is Airbnb profitable in Legnano in 2025? Explore comprehensive Airbnb analytics for Legnano, Lombardy, Italy to uncover income potential. This 2025 STR market report for Legnano, based on AirROI data from April 2024 to March 2025, reveals key trends in the niche market of 69 active listings.
Whether you're considering an Airbnb investment in Legnano, optimizing your existing vacation rental, or exploring rental arbitrage opportunities, understanding the Legnano Airbnb data is crucial. Navigating the high regulation landscape is key to maximizing your short term rental income potential. Let's dive into the specifics.
Key Legnano Airbnb Performance Metrics Overview
Monthly Airbnb Revenue Variations & Income Potential in Legnano (2025)
Understanding the monthly revenue variations for Airbnb listings in Legnano is key to maximizing your short term rental income potential. Seasonality significantly impacts earnings. Our analysis, based on data from the past 12 months, shows that the peak revenue month for STRs in Legnano is typically May, while March often presents the lowest earnings, highlighting opportunities for strategic pricing adjustments during shoulder and low seasons. Explore the typical Airbnb income in Legnano across different performance tiers:
- Best-in-class properties (Top 10%) achieve $2,421+ monthly, often utilizing dynamic pricing and superior guest experiences.
- Strong performing properties (Top 25%) earn $1,833 or more, indicating effective management and desirable locations/amenities.
- Typical properties (Median) generate around $1,285 per month, representing the average market performance.
- Entry-level properties (Bottom 25%) see earnings around $609, often with potential for optimization.
Average Monthly Airbnb Earnings Trend in Legnano
Legnano Airbnb Occupancy Rate Trends (2025)
Maximize your bookings by understanding the Legnano STR occupancy trends. Seasonal demand shifts significantly influence how often properties are booked. Typically, Maysees the highest demand (peak season occupancy), while March experiences the lowest (low season). Effective strategies, like adjusting minimum stays or offering promotions, can boost occupancy during slower periods. Here's how different property tiers perform in Legnano:
- Best-in-class properties (Top 10%) achieve 84%+ occupancy, indicating high desirability and potentially optimized availability.
- Strong performing properties (Top 25%) maintain 68% or higher occupancy, suggesting good market fit and guest satisfaction.
- Typical properties (Median) have an occupancy rate around 48%.
- Entry-level properties (Bottom 25%) average 23% occupancy, potentially facing higher vacancy.
Average Monthly Occupancy Rate Trend in Legnano
Average Daily Rate (ADR) Airbnb Trends in Legnano (2025)
Effective short term rental pricing strategy in Legnano involves understanding monthly ADR fluctuations. The Average Daily Rate (ADR) for Airbnb in Legnano typically peaks in August and dips lowest during February. Leveraging Airbnb dynamic pricing tools or strategies based on this seasonality can significantly boost revenue. Here's a look at the typical nightly rates achieved:
- Best-in-class properties (Top 10%) command rates of $112+ per night, often due to premium features or locations.
- Strong performing properties (Top 25%) achieve nightly rates of $88 or more.
- Typical properties (Median) charge around $71 per night.
- Entry-level properties (Bottom 25%) earn around $60 per night.
Average Daily Rate (ADR) Trend by Month in Legnano
Get Live Legnano Market Intelligence 👇

Explore Real-time Analytics
Airbnb Seasonality Analysis & Trends in Legnano (2025)
Peak Season (May, April, June)
- Revenue averages $1,775 per month
- Occupancy rates average 47.5%
- Daily rates average $77
Shoulder Season
- Revenue averages $1,246 per month
- Occupancy maintains around 48.7%
- Daily rates hold near $79
Low Season (February, March, November)
- Revenue drops to average $1,033 per month
- Occupancy decreases to average 43.6%
- Daily rates adjust to average $77
Seasonality Insights for Legnano
- The Airbnb seasonality in Legnano shows highly seasonal trends requiring careful strategy. While the sections above show seasonal averages, it's also insightful to look at the extremes:
- During the high season, the absolute peak month showcases Legnano's highest earning potential, with monthly revenues capable of climbing to $1,972, occupancy reaching a high of 53.9%, and ADRs peaking at $82.
- Conversely, the slowest single month of the year, typically falling within the low season, marks the market's lowest point. In this month, revenue might dip to $915, occupancy could drop to 37.0%, and ADRs may adjust down to $76.
- Understanding both the seasonal averages and these monthly peaks and troughs in revenue, occupancy, and ADR is crucial for maximizing your Airbnb profit potential in Legnano.
Seasonal Strategies for Maximizing Profit
- Peak Season: Maximize revenue through premium pricing and potentially longer minimum stays. Ensure high availability.
- Low Season: Offer competitive pricing, special promotions (e.g., extended stay discounts), and flexible cancellation policies. Target off-season travelers like remote workers or budget-conscious guests.
- Shoulder Seasons: Implement dynamic pricing that balances peak and low rates. Target weekend travelers or specific events. Offer slightly more flexible terms than peak season.
- Regularly analyze your own performance against these Legnano seasonality benchmarks and adjust your pricing and availability strategy accordingly.
Best Areas for Airbnb Investment in Legnano (2025)
Exploring the top neighborhoods for short-term rentals in Legnano? This section highlights key areas, outlining why they are attractive for hosts and guests, along with notable local attractions. Consider these locations based on your target guest profile and investment strategy.
| Neighborhood / Area | Why Host Here? (Target Guests & Appeal) | Key Attractions & Landmarks |
|---|---|---|
| Centro Storico | The historical center of Legnano, full of charming streets and significant monuments. It's a great spot for tourists exploring local culture and history. | Castello di Legnano, Chiesa di San Magno, Piazza San Magno, Museo Lombardo di Storia Contemporanea, Teatro Tirinnanzi |
| Parco Castellanza | A modern neighborhood near a large park, offering green spaces and family-friendly amenities. It appeals to those looking for a quieter stay close to nature. | Parco di Villa Saporiti, Parco Comunale di Castellanza, Shopping centers, Local restaurants, Cycling paths |
| Legnano Train Station Area | A convenient location for travelers due to its proximity to major transport links. Perfect for business travelers and those looking to explore nearby cities. | Training station, Local cafes, Nearby shops, Accessibility to Milan, Biking routes to outskirts |
| San Martino | A residential neighborhood with a vibrant community feel, appealing to families and longer-term stays. Offers a mix of local eateries and shops. | Local markets, Parks, Family-friendly attractions, Traditional Italian restaurants, Community events |
| Fiera Milano area | Near the Fiera di Milano, this area attracts business travelers and event participants, making it a strategic location for short-term rentals during fair events. | Fiera di Milano, Exhibitions and conventions, Shopping malls, Restaurants catering to business guests, Event services |
| Bollate | A nearby town with good connectivity to Legnano, ideal for those looking for quieter accommodations while still close to city attractions. | Parks and green spaces, Local galleries, Train routes to Milan, Shopping areas, Cafes |
| Sempione Park Area | A luscious green space that attracts nature lovers and sports enthusiasts. Ideal for hosting guests looking for outdoor activities. | Parco Sempione, Cultural events, Jogging and walking trails, Nearby museums, Open-air cinema |
| Castellanza | A dynamic area with a youthful atmosphere, dominated by student life due to nearby educational institutions. Great for hosting younger travelers. | Universities and colleges, Cafes and clubs, Local events and gatherings, Outdoor activities, Sports facilities |
Understanding Airbnb License Requirements & STR Laws in Legnano (2025)
Yes, Legnano, Lombardy, Italy enforces high STR regulations. Obtaining a license and ensuring compliance is almost certainly required according to current 2025 STR laws. Always verify the latest short term rental regulations and Airbnb license requirements directly with local government authorities for Legnano to ensure full compliance before hosting.
(Source: AirROI data, 2025, based on 64% licensed listings)
Top Performing Airbnb Properties in Legnano (2025)
Benchmark your potential! Explore examples of top-performing Airbnb properties in Legnanobased on Trailing Twelve Month (TTM) revenue. Analyze their characteristics, revenue, occupancy rate, and ADR to understand what drives success in this market.
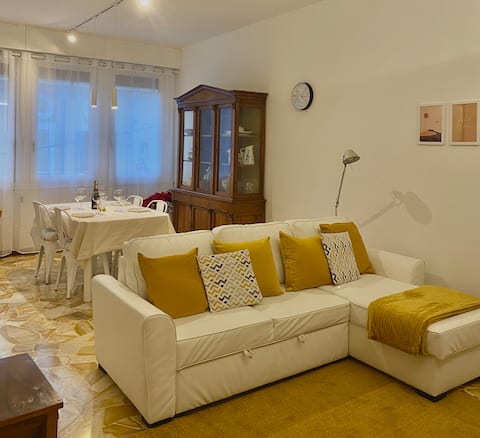
Casa IRMA, in the heart of Legnano
Entire Place • 2 bedrooms
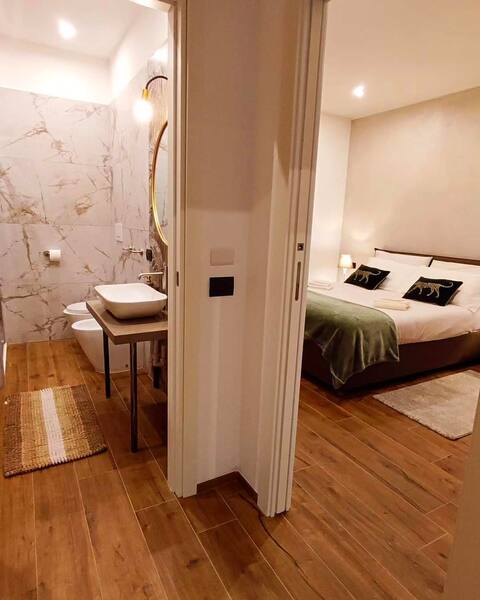
Prestigious 60 sqm near Milan/Rho Fiera/MXP 15'
Entire Place • 1 bedroom
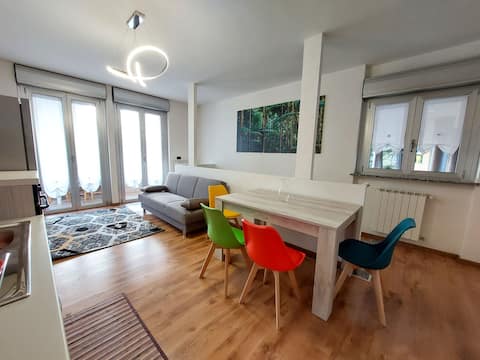
Private apartment with a jacuzzi
Entire Place • 1 bedroom
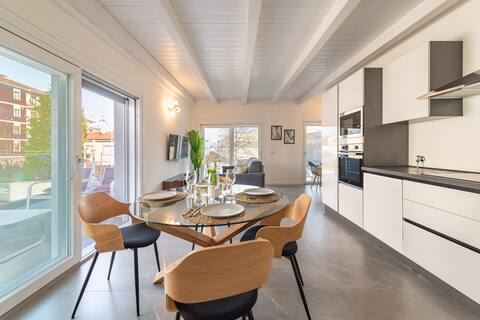
Suite|Fiera Milano-Malpensa MXP 15'|
Entire Place • 1 bedroom

Three-room apartment a stone's throw from Legnano station
Entire Place • 2 bedrooms

Attic Room near Milan, Rho fiera and MXP
Entire Place • 1 bedroom
Note: Performance varies based on location, size, amenities, seasonality, and management quality. Data reflects the past 12 months.
Top Performing Airbnb Hosts in Legnano (2025)
Learn from the best! This table showcases top-performing Airbnb hosts in Legnano based on the number of properties managed and estimated total revenue over the past year. Analyze their scale and performance metrics.
| Host Name | Properties | Grossing Revenue | Stay Reviews | Avg Rating |
|---|---|---|---|---|
| Pietro | 2 | $49,674 | 138 | 4.99/5.0 |
| Ciovati Group Srl | 2 | $45,801 | 122 | 4.89/5.0 |
| Giorgio | 2 | $38,778 | 77 | 4.43/5.0 |
| Valeria | 1 | $32,951 | 75 | 4.93/5.0 |
| Marco | 2 | $31,158 | 100 | 4.97/5.0 |
| Isabella | 4 | $30,951 | 63 | 4.79/5.0 |
| Vincenzo | 1 | $28,022 | 61 | 4.95/5.0 |
| Samuele | 1 | $25,128 | 54 | 5.00/5.0 |
| Roman | 2 | $23,647 | 10 | 4.92/5.0 |
| Stefano | 1 | $23,545 | 60 | 4.83/5.0 |
Analyzing the strategies of top hosts, such as their property selection, pricing, and guest communication, can offer valuable lessons for optimizing your own Airbnb operations in Legnano.
Dive Deeper: Advanced Legnano STR Market Data (2025)
Ready to unlock more insights? AirROI provides access to advanced metrics and comprehensive Airbnb data for Legnano. Explore detailed analytics beyond this report to refine your investment strategy, optimize pricing, and maximize your vacation rental profits.
Explore Advanced MetricsLegnano Short-Term Rental Market Composition (2025): Property & Room Types
Room Type Distribution
Property Type Distribution
Market Composition Insights for Legnano
- The Legnano Airbnb market composition is heavily skewed towards Entire Home/Apt listings, which make up 81.2% of the 69 active rentals. This indicates strong guest preference for privacy and space.
- Looking at the property type distribution in Legnano, Apartment/Condo properties are the most common (73.9%), reflecting the local real estate landscape.
- The presence of 11.6% Hotel/Boutique listings indicates integration with traditional hospitality.
Legnano Airbnb Room Capacity Analysis (2025): Bedroom Distribution
Distribution of Listings by Number of Bedrooms
Room Capacity Insights for Legnano
- The dominant room capacity in Legnano is 1 bedroom listings, making up 63.8% of the market. This suggests a strong demand for properties suitable for couples or solo travelers.
- Together, 1 bedroom and 2 bedrooms properties represent 79.7% of the active Airbnb listings in Legnano, indicating a high concentration in these sizes.
- With over half the market (63.8%) consisting of studios or 1-bedroom units, Legnano is particularly well-suited for individuals or couples.
- Listings with 3+ bedrooms (5.8%) represent a smaller niche, potentially indicating an underserved market for larger group accommodations in Legnano.
Legnano Vacation Rental Guest Capacity Trends (2025)
Distribution of Listings by Guest Capacity
Guest Capacity Insights for Legnano
- The most common guest capacity trend in Legnano vacation rentals is listings accommodating 2 guests (34.8%). This suggests the primary traveler segment is likely couples or solo travelers.
- Properties designed for 2 guests and 4 guests dominate the Legnano STR market, accounting for 58.0% of listings.
- On average, properties in Legnano are equipped to host 2.7 guests.
Legnano Airbnb Booking Patterns (2025): Available vs. Booked Days
Available Days Distribution
Booked Days Distribution
Booking Pattern Insights for Legnano
- The most common availability pattern in Legnano falls within the 271-366 days range, representing 37.7% of listings. This suggests many properties have significant open periods on their calendars.
- Approximately 65.2% of listings show high availability (181+ days open annually), indicating potential for increased bookings or specific owner usage patterns.
- For booked days, the 91-180 days range is most frequent in Legnano (27.5%), reflecting common guest stay durations or potential owner blocking patterns.
- A notable 34.7% of properties secure long booking periods (181+ days booked per year), highlighting successful long-term rental strategies or significant owner usage.
Legnano Airbnb Minimum Stay Requirements Analysis
Distribution of Listings by Minimum Night Requirement
1 Night
26 listings
40.6% of total
2 Nights
10 listings
15.6% of total
3 Nights
13 listings
20.3% of total
4-6 Nights
2 listings
3.1% of total
7-29 Nights
8 listings
12.5% of total
30+ Nights
5 listings
7.8% of total
Key Insights
- The most prevalent minimum stay requirement in Legnano is 1 Night, adopted by 40.6% of listings. This highlights the market's preference for shorter, flexible bookings.
Recommendations
- Align with the market by considering a 1 Night minimum stay, as 40.6% of Legnano hosts use this setting.
- Explore offering discounts for stays of 30+ nights to attract the 7.8% of the market seeking extended stays.
- Adjust minimum nights based on seasonality – potentially shorter during low season and longer during peak demand periods in Legnano.
Legnano Airbnb Cancellation Policy Trends Analysis (2025)
Flexible
31 listings
50.8% of total
Moderate
24 listings
39.3% of total
Strict
6 listings
9.8% of total
Cancellation Policy Insights for Legnano
- The prevailing Airbnb cancellation policy trend in Legnano is Flexible, used by 50.8% of listings.
- The market strongly favors guest-friendly terms, with 90.1% of listings offering Flexible or Moderate policies. This suggests guests in Legnano may expect booking flexibility.
- Strict cancellation policies are quite rare (9.8%), potentially making listings with this policy less competitive unless justified by high demand or property type.
Recommendations for Hosts
- Consider adopting a Flexible policy to align with the 50.8% market standard in Legnano.
- Given the high prevalence of Flexible policies (50.8%), offering this can enhance booking appeal, especially during shoulder seasons.
- Using a Strict policy might deter some guests, as only 9.8% of listings use it. Evaluate if potential revenue protection outweighs possible lower booking rates.
- Regularly review your cancellation policy against competitors and market demand shifts in Legnano.
Legnano STR Booking Lead Time Analysis (2025)
Average Booking Lead Time by Month
Booking Lead Time Insights for Legnano
- The overall average booking lead time for vacation rentals in Legnano is 31 days.
- Guests book furthest in advance for stays during April (average 72 days), likely coinciding with peak travel demand or local events.
- The shortest booking windows occur for stays in December (average 27 days), indicating more last-minute travel plans during this time.
- Seasonally, Spring (52 days avg.) sees the longest lead times, while Winter (27 days avg.) has the shortest, reflecting typical travel planning cycles.
Recommendations for Hosts
- Use the overall average lead time (31 days) as a baseline for your pricing and availability strategy in Legnano.
- For April stays, consider implementing length-of-stay discounts or slightly higher rates for bookings made less than 72 days out to capitalize on advance planning.
- Target marketing efforts for the Spring season well in advance (at least 52 days) to capture early planners.
- Monitor your own booking lead times against these Legnano averages to identify opportunities for dynamic pricing adjustments.
Popular & Essential Airbnb Amenities in Legnano (2025)
Amenity Prevalence
Amenity Insights for Legnano
- Popular amenities like Essentials, Heating, TV are common but not universal. Offering these can provide a competitive edge.
- Warning: Wifi is not universally provided but is considered essential globally. Ensure reliable Wifi is offered.
Recommendations for Hosts
- Consider adding popular differentiators like Essentials or Heating to increase appeal.
- Highlight unique or less common amenities you offer (e.g., hot tub, dedicated workspace, EV charger) in your listing description and photos.
- Regularly check competitor amenities in Legnano to stay competitive.
Legnano Airbnb Guest Demographics & Profile Analysis (2025)
Guest Profile Summary for Legnano
- The typical guest profile for Airbnb in Legnano consists of predominantly international visitors (68%), with top international origins including France, typically belonging to the Post-2000s (Gen Z/Alpha) group (50%), primarily speaking English or Italian.
- Domestic travelers account for 32.0% of guests.
- Key international markets include Italy (32%) and France (14.1%).
- Top languages spoken are English (37.6%) followed by Italian (15.9%).
- A significant demographic segment is the Post-2000s (Gen Z/Alpha) group, representing 50% of guests.
Recommendations for Hosts
- Focus marketing internationally, particularly towards travelers from France.
- Tailor amenities and listing descriptions to appeal to the dominant Post-2000s (Gen Z/Alpha) demographic (e.g., highlight fast WiFi, smart home features, local guides).
- Highlight unique local experiences or amenities relevant to the primary guest profile.
- Consider seasonal promotions aligned with peak travel times for key origin markets.
Nearby Short-Term Rental Market Comparison
How does the Legnano Airbnb market stack up against its neighbors? Compare key performance metrics like average monthly revenue, ADR, and occupancy rates in surrounding areas to understand the broader regional STR landscape.
| Market | Active Properties | Monthly Revenue | Daily Rate | Avg. Occupancy |
|---|---|---|---|---|
| Lauterbrunnen | 525 | $7,079 | $546.45 | 54% |
| Matten bei Interlaken | 52 | $5,674 | $316.63 | 63% |
| Iseltwald | 14 | $5,491 | $331.95 | 58% |
| Habkern | 13 | $5,382 | $344.74 | 50% |
| Interlaken | 288 | $4,987 | $310.52 | 56% |
| Grindelwald | 489 | $4,921 | $345.40 | 57% |
| Laglio | 64 | $4,873 | $463.61 | 47% |
| Zermatt | 734 | $4,604 | $463.00 | 46% |
| Oberhofen am Thunersee | 24 | $4,572 | $265.94 | 55% |
| Monteu Roero | 16 | $4,432 | $540.14 | 36% |