Laveno-Mombello Airbnb Market Analysis 2025: Short Term Rental Data & Vacation Rental Statistics in Lombardy, Italy
Is Airbnb profitable in Laveno-Mombello in 2025? Explore comprehensive Airbnb analytics for Laveno-Mombello, Lombardy, Italy to uncover income potential. This 2025 STR market report for Laveno-Mombello, based on AirROI data from April 2024 to March 2025, reveals key trends in the niche market of 73 active listings.
Whether you're considering an Airbnb investment in Laveno-Mombello, optimizing your existing vacation rental, or exploring rental arbitrage opportunities, understanding the Laveno-Mombello Airbnb data is crucial. Navigating the high regulation landscape is key to maximizing your short term rental income potential. Let's dive into the specifics.
Key Laveno-Mombello Airbnb Performance Metrics Overview
Monthly Airbnb Revenue Variations & Income Potential in Laveno-Mombello (2025)
Understanding the monthly revenue variations for Airbnb listings in Laveno-Mombello is key to maximizing your short term rental income potential. Seasonality significantly impacts earnings. Our analysis, based on data from the past 12 months, shows that the peak revenue month for STRs in Laveno-Mombello is typically August, while December often presents the lowest earnings, highlighting opportunities for strategic pricing adjustments during shoulder and low seasons. Explore the typical Airbnb income in Laveno-Mombello across different performance tiers:
- Best-in-class properties (Top 10%) achieve $4,385+ monthly, often utilizing dynamic pricing and superior guest experiences.
- Strong performing properties (Top 25%) earn $2,514 or more, indicating effective management and desirable locations/amenities.
- Typical properties (Median) generate around $1,244 per month, representing the average market performance.
- Entry-level properties (Bottom 25%) see earnings around $629, often with potential for optimization.
Average Monthly Airbnb Earnings Trend in Laveno-Mombello
Laveno-Mombello Airbnb Occupancy Rate Trends (2025)
Maximize your bookings by understanding the Laveno-Mombello STR occupancy trends. Seasonal demand shifts significantly influence how often properties are booked. Typically, Augustsees the highest demand (peak season occupancy), while December experiences the lowest (low season). Effective strategies, like adjusting minimum stays or offering promotions, can boost occupancy during slower periods. Here's how different property tiers perform in Laveno-Mombello:
- Best-in-class properties (Top 10%) achieve 64%+ occupancy, indicating high desirability and potentially optimized availability.
- Strong performing properties (Top 25%) maintain 50% or higher occupancy, suggesting good market fit and guest satisfaction.
- Typical properties (Median) have an occupancy rate around 31%.
- Entry-level properties (Bottom 25%) average 14% occupancy, potentially facing higher vacancy.
Average Monthly Occupancy Rate Trend in Laveno-Mombello
Average Daily Rate (ADR) Airbnb Trends in Laveno-Mombello (2025)
Effective short term rental pricing strategy in Laveno-Mombello involves understanding monthly ADR fluctuations. The Average Daily Rate (ADR) for Airbnb in Laveno-Mombello typically peaks in July and dips lowest during March. Leveraging Airbnb dynamic pricing tools or strategies based on this seasonality can significantly boost revenue. Here's a look at the typical nightly rates achieved:
- Best-in-class properties (Top 10%) command rates of $307+ per night, often due to premium features or locations.
- Strong performing properties (Top 25%) achieve nightly rates of $197 or more.
- Typical properties (Median) charge around $121 per night.
- Entry-level properties (Bottom 25%) earn around $88 per night.
Average Daily Rate (ADR) Trend by Month in Laveno-Mombello
Get Live Laveno-Mombello Market Intelligence 👇

Explore Real-time Analytics
Airbnb Seasonality Analysis & Trends in Laveno-Mombello (2025)
Peak Season (August, May, July)
- Revenue averages $3,178 per month
- Occupancy rates average 50.9%
- Daily rates average $178
Shoulder Season
- Revenue averages $1,904 per month
- Occupancy maintains around 31.6%
- Daily rates hold near $173
Low Season (January, February, December)
- Revenue drops to average $1,026 per month
- Occupancy decreases to average 19.8%
- Daily rates adjust to average $176
Seasonality Insights for Laveno-Mombello
- The Airbnb seasonality in Laveno-Mombello shows highly seasonal trends requiring careful strategy. While the sections above show seasonal averages, it's also insightful to look at the extremes:
- During the high season, the absolute peak month showcases Laveno-Mombello's highest earning potential, with monthly revenues capable of climbing to $3,187, occupancy reaching a high of 57.5%, and ADRs peaking at $182.
- Conversely, the slowest single month of the year, typically falling within the low season, marks the market's lowest point. In this month, revenue might dip to $984, occupancy could drop to 18.2%, and ADRs may adjust down to $169.
- Understanding both the seasonal averages and these monthly peaks and troughs in revenue, occupancy, and ADR is crucial for maximizing your Airbnb profit potential in Laveno-Mombello.
Seasonal Strategies for Maximizing Profit
- Peak Season: Maximize revenue through premium pricing and potentially longer minimum stays. Ensure high availability.
- Low Season: Offer competitive pricing, special promotions (e.g., extended stay discounts), and flexible cancellation policies. Target off-season travelers like remote workers or budget-conscious guests.
- Shoulder Seasons: Implement dynamic pricing that balances peak and low rates. Target weekend travelers or specific events. Offer slightly more flexible terms than peak season.
- Regularly analyze your own performance against these Laveno-Mombello seasonality benchmarks and adjust your pricing and availability strategy accordingly.
Best Areas for Airbnb Investment in Laveno-Mombello (2025)
Exploring the top neighborhoods for short-term rentals in Laveno-Mombello? This section highlights key areas, outlining why they are attractive for hosts and guests, along with notable local attractions. Consider these locations based on your target guest profile and investment strategy.
| Neighborhood / Area | Why Host Here? (Target Guests & Appeal) | Key Attractions & Landmarks |
|---|---|---|
| Laveno | Charming lakeside town offering stunning views of Lake Maggiore, combined with historical architecture and a vibrant local culture. Ideal for tourists seeking a peaceful retreat with plenty of outdoor activities. | Laveno Mombello Cable Car, Lago Maggiore, Villa Jucker, Parco della Rocca, Local artisan shops |
| Mombello | A quieter part of Laveno-Mombello, perfect for nature lovers and those wanting to escape the hustle and bustle. Proximity to hiking trails and the lake makes it appealing for outdoor enthusiasts. | Monte Sasso del Ferro, Parco Regionale Campo dei Fiori, hiking trails, lake access, scenic viewpoints |
| Luino | Just a short distance away, Luino offers a scenic lakeside experience with a lively market and cultural events. Great for tourists who enjoy local dining and shopping. | Luino Market, Lakefront promenade, San Francesco Church, Villa Bianchi, beautiful landscapes |
| Baveno | A picturesque town known for its granite mountains and lakeside beauty. Popular with tourists for its striking views and access to the Borromean Islands. | Isola Bella, Isola Madre, Villa Taranto, Baveno's swimming beaches, Nice waterfront restaurants |
| Stresa | Renowned for its stunning views and proximity to the Borromean Islands, Stresa is a favorite destination for tourists seeking luxury and elegance by the lake. | Isola Bella, Grand Hotels, Stresa-National Park Cable Car, Palazzo Borromeo, beautiful promenades |
| Verbania | A vibrant town known for its beautiful botanical gardens and cultural events, offering a unique blend of nature and art along the lakeside. | Villa Taranto Botanical Gardens, Verbania Intra waterfront, Art galleries, Parks and green spaces, Local markets |
| Taino | A smaller, serene village near the lake, offering a peaceful atmosphere for families and couples looking for a quiet getaway. | Lago di Varese, Nature walks, Hiking trails, Picnic areas, Rural charm |
| Germignaga | A charming village right on the banks of Lake Lugano, known for its laid-back vibe and excellent swimming spots. | Lake Lugano, Beaches, Nature reserves, Local restaurants, Cultural events |
Understanding Airbnb License Requirements & STR Laws in Laveno-Mombello (2025)
Yes, Laveno-Mombello, Lombardy, Italy enforces high STR regulations. Obtaining a license and ensuring compliance is almost certainly required according to current 2025 STR laws. Always verify the latest short term rental regulations and Airbnb license requirements directly with local government authorities for Laveno-Mombello to ensure full compliance before hosting.
(Source: AirROI data, 2025, based on 63% licensed listings)
Top Performing Airbnb Properties in Laveno-Mombello (2025)
Benchmark your potential! Explore examples of top-performing Airbnb properties in Laveno-Mombellobased on Trailing Twelve Month (TTM) revenue. Analyze their characteristics, revenue, occupancy rate, and ADR to understand what drives success in this market.
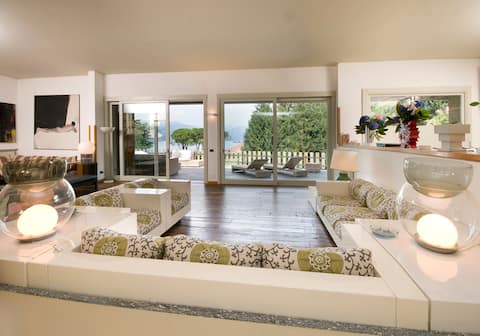
main lake villa with swimming pool
Entire Place • 7 bedrooms
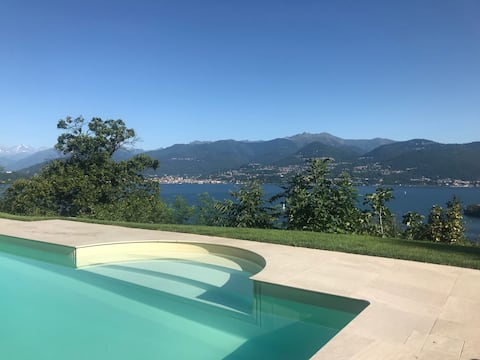
Villa with Pool + Fabulous Lake View
Entire Place • 3 bedrooms
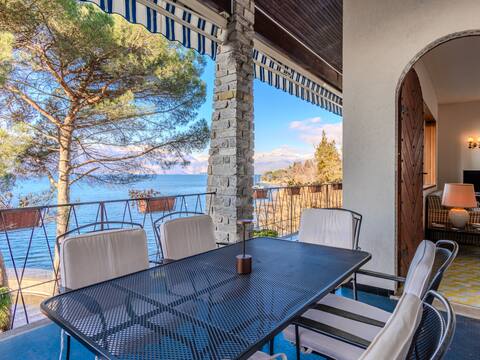
Fabrizio by Interhome
Entire Place • 3 bedrooms
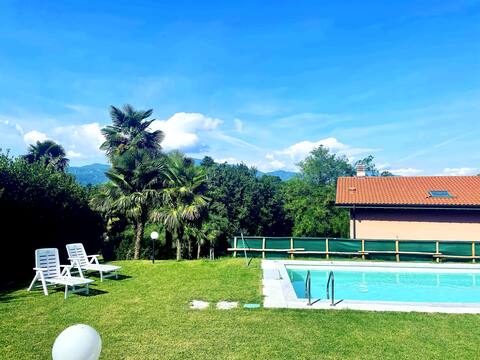
Holiday home Casa Sebastiano seenah with pool
Entire Place • 2 bedrooms
Villa stately, lake view
Entire Place • 4 bedrooms
Casa Centro Laveno Mombello
Entire Place • 2 bedrooms
Note: Performance varies based on location, size, amenities, seasonality, and management quality. Data reflects the past 12 months.
Top Performing Airbnb Hosts in Laveno-Mombello (2025)
Learn from the best! This table showcases top-performing Airbnb hosts in Laveno-Mombello based on the number of properties managed and estimated total revenue over the past year. Analyze their scale and performance metrics.
| Host Name | Properties | Grossing Revenue | Stay Reviews | Avg Rating |
|---|---|---|---|---|
| Alessandra | 1 | $172,463 | 41 | 4.83/5.0 |
| Francesca | 11 | $88,176 | 33 | 1.93/5.0 |
| Angelo - Interhome Group | 3 | $74,040 | 22 | 4.44/5.0 |
| Verena | 1 | $68,352 | 13 | 4.85/5.0 |
| Marina | 2 | $66,900 | 43 | 4.75/5.0 |
| Seba | 1 | $48,381 | 40 | 4.88/5.0 |
| Alessandra - Interhome Group | 3 | $46,732 | 28 | 2.84/5.0 |
| Catalina | 3 | $46,551 | 99 | 4.82/5.0 |
| Holidu | 1 | $35,907 | 8 | 4.88/5.0 |
| Hanna And Albert | 2 | $33,844 | 29 | 4.92/5.0 |
Analyzing the strategies of top hosts, such as their property selection, pricing, and guest communication, can offer valuable lessons for optimizing your own Airbnb operations in Laveno-Mombello.
Dive Deeper: Advanced Laveno-Mombello STR Market Data (2025)
Ready to unlock more insights? AirROI provides access to advanced metrics and comprehensive Airbnb data for Laveno-Mombello. Explore detailed analytics beyond this report to refine your investment strategy, optimize pricing, and maximize your vacation rental profits.
Explore Advanced MetricsLaveno-Mombello Short-Term Rental Market Composition (2025): Property & Room Types
Room Type Distribution
Property Type Distribution
Market Composition Insights for Laveno-Mombello
- The Laveno-Mombello Airbnb market composition is heavily skewed towards Entire Home/Apt listings, which make up 90.4% of the 73 active rentals. This indicates strong guest preference for privacy and space.
- Looking at the property type distribution in Laveno-Mombello, Apartment/Condo properties are the most common (63%), reflecting the local real estate landscape.
- Houses represent a significant 31.5% portion, catering likely to families or larger groups.
- Smaller segments like outdoor/unique, hotel/boutique (combined 5.4%) offer potential for unique stay experiences.
Laveno-Mombello Airbnb Room Capacity Analysis (2025): Bedroom Distribution
Distribution of Listings by Number of Bedrooms
Room Capacity Insights for Laveno-Mombello
- The dominant room capacity in Laveno-Mombello is 1 bedroom listings, making up 45.2% of the market. This suggests a strong demand for properties suitable for couples or solo travelers.
- Together, 1 bedroom and 2 bedrooms properties represent 78.1% of the active Airbnb listings in Laveno-Mombello, indicating a high concentration in these sizes.
Laveno-Mombello Vacation Rental Guest Capacity Trends (2025)
Distribution of Listings by Guest Capacity
Guest Capacity Insights for Laveno-Mombello
- The most common guest capacity trend in Laveno-Mombello vacation rentals is listings accommodating 4 guests (37%). This suggests the primary traveler segment is likely small families or groups.
- Properties designed for 4 guests and 5 guests dominate the Laveno-Mombello STR market, accounting for 54.8% of listings.
- 16.5% of properties accommodate 6+ guests, serving the market segment for larger families or group travel in Laveno-Mombello.
- On average, properties in Laveno-Mombello are equipped to host 4.1 guests.
Laveno-Mombello Airbnb Booking Patterns (2025): Available vs. Booked Days
Available Days Distribution
Booked Days Distribution
Booking Pattern Insights for Laveno-Mombello
- The most common availability pattern in Laveno-Mombello falls within the 271-366 days range, representing 58.9% of listings. This suggests many properties have significant open periods on their calendars.
- Approximately 93.1% of listings show high availability (181+ days open annually), indicating potential for increased bookings or specific owner usage patterns.
- For booked days, the 31-90 days range is most frequent in Laveno-Mombello (38.4%), reflecting common guest stay durations or potential owner blocking patterns.
- A notable 9.6% of properties secure long booking periods (181+ days booked per year), highlighting successful long-term rental strategies or significant owner usage.
Laveno-Mombello Airbnb Minimum Stay Requirements Analysis
Distribution of Listings by Minimum Night Requirement
1 Night
17 listings
26.6% of total
2 Nights
18 listings
28.1% of total
3 Nights
9 listings
14.1% of total
4-6 Nights
6 listings
9.4% of total
7-29 Nights
4 listings
6.3% of total
30+ Nights
10 listings
15.6% of total
Key Insights
- The most prevalent minimum stay requirement in Laveno-Mombello is 2 Nights, adopted by 28.1% of listings. This highlights the market's preference for shorter, flexible bookings.
- A significant segment (15.6%) caters to monthly stays (30+ nights) in Laveno-Mombello, pointing to opportunities in the extended-stay market.
Recommendations
- Align with the market by considering a 2 Nights minimum stay, as 28.1% of Laveno-Mombello hosts use this setting.
- If feasible, allowing 1-night stays, especially midweek or during low season, could capture last-minute bookings, as only 26.6% currently do.
- Explore offering discounts for stays of 30+ nights to attract the 15.6% of the market seeking extended stays.
- Adjust minimum nights based on seasonality – potentially shorter during low season and longer during peak demand periods in Laveno-Mombello.
Laveno-Mombello Airbnb Cancellation Policy Trends Analysis (2025)
Super Strict 30 Days
11 listings
19.3% of total
Flexible
14 listings
24.6% of total
Moderate
22 listings
38.6% of total
Strict
10 listings
17.5% of total
Cancellation Policy Insights for Laveno-Mombello
- The prevailing Airbnb cancellation policy trend in Laveno-Mombello is Moderate, used by 38.6% of listings.
- There's a relatively balanced mix between guest-friendly (63.2%) and stricter (17.5%) policies, offering choices for different guest needs.
Recommendations for Hosts
- Consider adopting a Moderate policy to align with the 38.6% market standard in Laveno-Mombello.
- Regularly review your cancellation policy against competitors and market demand shifts in Laveno-Mombello.
Laveno-Mombello STR Booking Lead Time Analysis (2025)
Average Booking Lead Time by Month
Booking Lead Time Insights for Laveno-Mombello
- The overall average booking lead time for vacation rentals in Laveno-Mombello is 52 days.
- Guests book furthest in advance for stays during July (average 94 days), likely coinciding with peak travel demand or local events.
- The shortest booking windows occur for stays in January (average 24 days), indicating more last-minute travel plans during this time.
- Seasonally, Summer (82 days avg.) sees the longest lead times, while Winter (33 days avg.) has the shortest, reflecting typical travel planning cycles.
Recommendations for Hosts
- Use the overall average lead time (52 days) as a baseline for your pricing and availability strategy in Laveno-Mombello.
- For July stays, consider implementing length-of-stay discounts or slightly higher rates for bookings made less than 94 days out to capitalize on advance planning.
- Target marketing efforts for the Summer season well in advance (at least 82 days) to capture early planners.
- Monitor your own booking lead times against these Laveno-Mombello averages to identify opportunities for dynamic pricing adjustments.
Popular & Essential Airbnb Amenities in Laveno-Mombello (2025)
Amenity Prevalence
Amenity Insights for Laveno-Mombello
- Essential amenities in Laveno-Mombello that guests expect include: Heating. Lacking these (this) could significantly impact bookings.
- Popular amenities like Kitchen, Essentials, Hot water are common but not universal. Offering these can provide a competitive edge.
- Warning: Wifi is not universally provided but is considered essential globally. Ensure reliable Wifi is offered.
Recommendations for Hosts
- Ensure your listing includes all essential amenities for Laveno-Mombello: Heating.
- Prioritize adding missing essentials: Heating.
- Consider adding popular differentiators like Kitchen or Essentials to increase appeal.
- Highlight unique or less common amenities you offer (e.g., hot tub, dedicated workspace, EV charger) in your listing description and photos.
- Regularly check competitor amenities in Laveno-Mombello to stay competitive.
Laveno-Mombello Airbnb Guest Demographics & Profile Analysis (2025)
Guest Profile Summary for Laveno-Mombello
- The typical guest profile for Airbnb in Laveno-Mombello consists of predominantly international visitors (91%), with top international origins including France, typically belonging to the Post-2000s (Gen Z/Alpha) group (50%), primarily speaking English or German.
- Domestic travelers account for 9.0% of guests.
- Key international markets include Germany (33%) and France (27.9%).
- Top languages spoken are English (36.8%) followed by German (21.8%).
- A significant demographic segment is the Post-2000s (Gen Z/Alpha) group, representing 50% of guests.
Recommendations for Hosts
- Focus marketing internationally, particularly towards travelers from France.
- Tailor amenities and listing descriptions to appeal to the dominant Post-2000s (Gen Z/Alpha) demographic (e.g., highlight fast WiFi, smart home features, local guides).
- Highlight unique local experiences or amenities relevant to the primary guest profile.
- Consider seasonal promotions aligned with peak travel times for key origin markets.
Nearby Short-Term Rental Market Comparison
How does the Laveno-Mombello Airbnb market stack up against its neighbors? Compare key performance metrics like average monthly revenue, ADR, and occupancy rates in surrounding areas to understand the broader regional STR landscape.
| Market | Active Properties | Monthly Revenue | Daily Rate | Avg. Occupancy |
|---|---|---|---|---|
| Lauterbrunnen | 525 | $7,079 | $546.45 | 54% |
| Matten bei Interlaken | 52 | $5,674 | $316.63 | 63% |
| Iseltwald | 14 | $5,491 | $331.95 | 58% |
| Habkern | 13 | $5,382 | $344.74 | 50% |
| Interlaken | 288 | $4,987 | $310.52 | 56% |
| Grindelwald | 489 | $4,921 | $345.40 | 57% |
| Laglio | 64 | $4,873 | $463.61 | 47% |
| Zermatt | 734 | $4,604 | $463.00 | 46% |
| Oberhofen am Thunersee | 24 | $4,572 | $265.94 | 55% |
| Monteu Roero | 16 | $4,432 | $540.14 | 36% |