Lainate Airbnb Market Analysis 2025: Short Term Rental Data & Vacation Rental Statistics in Lombardy, Italy
Is Airbnb profitable in Lainate in 2025? Explore comprehensive Airbnb analytics for Lainate, Lombardy, Italy to uncover income potential. This 2025 STR market report for Lainate, based on AirROI data from April 2024 to March 2025, reveals key trends in the niche market of 17 active listings.
Whether you're considering an Airbnb investment in Lainate, optimizing your existing vacation rental, or exploring rental arbitrage opportunities, understanding the Lainate Airbnb data is crucial. Navigating the high regulation landscape is key to maximizing your short term rental income potential. Let's dive into the specifics.
Key Lainate Airbnb Performance Metrics Overview
Monthly Airbnb Revenue Variations & Income Potential in Lainate (2025)
Understanding the monthly revenue variations for Airbnb listings in Lainate is key to maximizing your short term rental income potential. Seasonality significantly impacts earnings. Our analysis, based on data from the past 12 months, shows that the peak revenue month for STRs in Lainate is typically May, while March often presents the lowest earnings, highlighting opportunities for strategic pricing adjustments during shoulder and low seasons. Explore the typical Airbnb income in Lainate across different performance tiers:
- Best-in-class properties (Top 10%) achieve $2,065+ monthly, often utilizing dynamic pricing and superior guest experiences.
- Strong performing properties (Top 25%) earn $1,434 or more, indicating effective management and desirable locations/amenities.
- Typical properties (Median) generate around $886 per month, representing the average market performance.
- Entry-level properties (Bottom 25%) see earnings around $465, often with potential for optimization.
Average Monthly Airbnb Earnings Trend in Lainate
Lainate Airbnb Occupancy Rate Trends (2025)
Maximize your bookings by understanding the Lainate STR occupancy trends. Seasonal demand shifts significantly influence how often properties are booked. Typically, Novembersees the highest demand (peak season occupancy), while April experiences the lowest (low season). Effective strategies, like adjusting minimum stays or offering promotions, can boost occupancy during slower periods. Here's how different property tiers perform in Lainate:
- Best-in-class properties (Top 10%) achieve 75%+ occupancy, indicating high desirability and potentially optimized availability.
- Strong performing properties (Top 25%) maintain 60% or higher occupancy, suggesting good market fit and guest satisfaction.
- Typical properties (Median) have an occupancy rate around 32%.
- Entry-level properties (Bottom 25%) average 18% occupancy, potentially facing higher vacancy.
Average Monthly Occupancy Rate Trend in Lainate
Average Daily Rate (ADR) Airbnb Trends in Lainate (2025)
Effective short term rental pricing strategy in Lainate involves understanding monthly ADR fluctuations. The Average Daily Rate (ADR) for Airbnb in Lainate typically peaks in December and dips lowest during November. Leveraging Airbnb dynamic pricing tools or strategies based on this seasonality can significantly boost revenue. Here's a look at the typical nightly rates achieved:
- Best-in-class properties (Top 10%) command rates of $184+ per night, often due to premium features or locations.
- Strong performing properties (Top 25%) achieve nightly rates of $108 or more.
- Typical properties (Median) charge around $76 per night.
- Entry-level properties (Bottom 25%) earn around $63 per night.
Average Daily Rate (ADR) Trend by Month in Lainate
Get Live Lainate Market Intelligence 👇

Explore Real-time Analytics
Airbnb Seasonality Analysis & Trends in Lainate (2025)
Peak Season (May, June, August)
- Revenue averages $1,703 per month
- Occupancy rates average 44.8%
- Daily rates average $105
Shoulder Season
- Revenue averages $1,180 per month
- Occupancy maintains around 39.9%
- Daily rates hold near $102
Low Season (January, February, March)
- Revenue drops to average $787 per month
- Occupancy decreases to average 33.6%
- Daily rates adjust to average $100
Seasonality Insights for Lainate
- The Airbnb seasonality in Lainate shows highly seasonal trends requiring careful strategy. While the sections above show seasonal averages, it's also insightful to look at the extremes:
- During the high season, the absolute peak month showcases Lainate's highest earning potential, with monthly revenues capable of climbing to $1,917, occupancy reaching a high of 57.4%, and ADRs peaking at $106.
- Conversely, the slowest single month of the year, typically falling within the low season, marks the market's lowest point. In this month, revenue might dip to $719, occupancy could drop to 25.0%, and ADRs may adjust down to $98.
- Understanding both the seasonal averages and these monthly peaks and troughs in revenue, occupancy, and ADR is crucial for maximizing your Airbnb profit potential in Lainate.
Seasonal Strategies for Maximizing Profit
- Peak Season: Maximize revenue through premium pricing and potentially longer minimum stays. Ensure high availability.
- Low Season: Offer competitive pricing, special promotions (e.g., extended stay discounts), and flexible cancellation policies. Target off-season travelers like remote workers or budget-conscious guests.
- Shoulder Seasons: Implement dynamic pricing that balances peak and low rates. Target weekend travelers or specific events. Offer slightly more flexible terms than peak season.
- Regularly analyze your own performance against these Lainate seasonality benchmarks and adjust your pricing and availability strategy accordingly.
Best Areas for Airbnb Investment in Lainate (2025)
Exploring the top neighborhoods for short-term rentals in Lainate? This section highlights key areas, outlining why they are attractive for hosts and guests, along with notable local attractions. Consider these locations based on your target guest profile and investment strategy.
| Neighborhood / Area | Why Host Here? (Target Guests & Appeal) | Key Attractions & Landmarks |
|---|---|---|
| Centro Storico | Lainate's historical center known for its charming architecture and vibrant atmosphere. Ideal for visitors exploring the history and culture of the region, with easy access to local shops and restaurants. | Palazzo Visconti, Church of San Vittore, Piazza della Vittoria, Villa Visconti Borromeo Litta, local shops and cafes |
| Villastanza | A quieter residential area that offers a nice balance between urban convenience and suburban tranquility. Popular with families and longer-stay guests looking for a peaceful environment with access to parks. | Parco del Roccolo, local family-owned restaurants, playgrounds, community events |
| Castano Primo | Nearby town that attracts tourists for day trips. A gateway to natural parks and outdoor activities, appealing to travelers who enjoy nature and outdoor sports. | Sacro Monte di Varese, local trails, day hiking locations, scenic parks |
| Frazione di Barbaiana | Known for its natural beauty and residential charm, this area offers easy access to nature trails and outdoor activities, making it suitable for nature lovers and those seeking tranquility. | nature trails, local parks, scenic views, community events |
| Cascina del Sole | A picturesque farming community that draws visitors interested in agritourism and wine tours, offering a unique rural Italian experience. | vineyards, farm tours, local markets, cultural events |
| Rho | Adjacent town with excellent transport links, popular with business travelers due to proximity to the trade fair district and while still offering leisure options. | Rho Fiera Milano, Parco di Villa Scheibler, historical sites, shopping districts |
| Legnano | A larger town nearby with a rich history and vibrant culture, appealing to a mix of tourists and business travelers seeking variety in their stay. | Castello di Legnano, local museums, art galleries, events in Piazza San Magno |
| Saronno | A bustling town known for its proximity to transport links, ideal for travelers looking to explore Milan and its surrounding areas while experiencing local culture. | Saronno Center, Sacred Heart of Jesus Sanctuary, local dining options, shops and cafes |
Understanding Airbnb License Requirements & STR Laws in Lainate (2025)
Yes, Lainate, Lombardy, Italy enforces high STR regulations. Obtaining a license and ensuring compliance is almost certainly required according to current 2025 STR laws. Always verify the latest short term rental regulations and Airbnb license requirements directly with local government authorities for Lainate to ensure full compliance before hosting.
(Source: AirROI data, 2025, based on 71% licensed listings)
Top Performing Airbnb Properties in Lainate (2025)
Benchmark your potential! Explore examples of top-performing Airbnb properties in Lainatebased on Trailing Twelve Month (TTM) revenue. Analyze their characteristics, revenue, occupancy rate, and ADR to understand what drives success in this market.
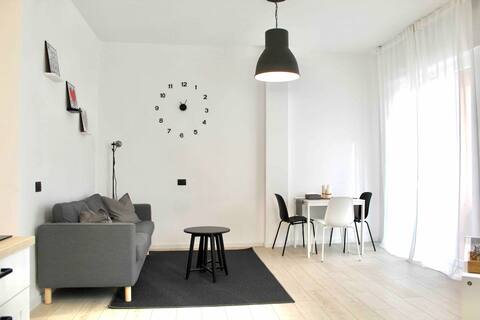
Exclusive - Modern Design - Lainate Rho Fiera
Entire Place • 2 bedrooms
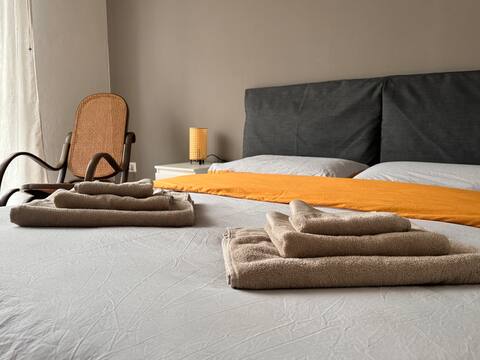
Two rooms with private bathroom - Be Art Homes
Private Room • 2 bedrooms

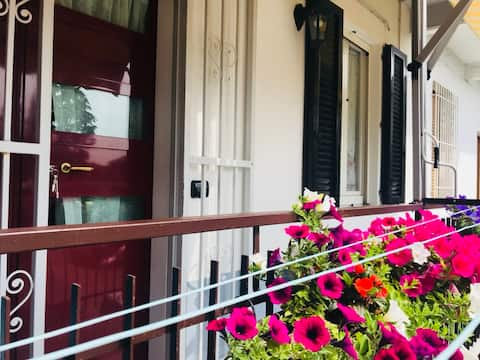
Gemma apartments Lainate Milano Rho Fiera Apt.3
Entire Place • 1 bedroom
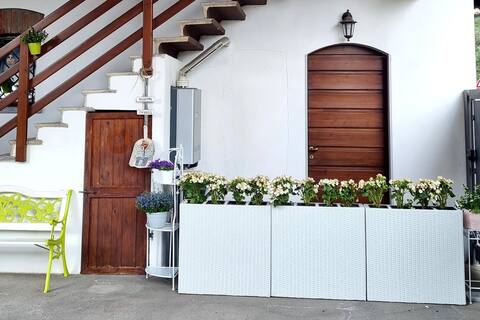
Gemma apartments Lainate Milano Rho Fiera Apt.2
Entire Place • 1 bedroom
Grancia 23 - Nice studio flat in a quiet area
Entire Place • N/A
Right side room - Be Art Homes Lainate
Private Room • N/A
Note: Performance varies based on location, size, amenities, seasonality, and management quality. Data reflects the past 12 months.
Top Performing Airbnb Hosts in Lainate (2025)
Learn from the best! This table showcases top-performing Airbnb hosts in Lainate based on the number of properties managed and estimated total revenue over the past year. Analyze their scale and performance metrics.
| Host Name | Properties | Grossing Revenue | Stay Reviews | Avg Rating |
|---|---|---|---|---|
| Domenico | 1 | $44,402 | 24 | 4.96/5.0 |
| Max | 3 | $40,041 | 132 | 4.95/5.0 |
| Dario | 2 | $28,922 | 225 | 4.86/5.0 |
| Tiziana | 1 | $13,140 | 56 | 4.79/5.0 |
| Host #46944928 | 1 | $10,391 | 0 | 0.00/5.0 |
| Anna | 1 | $10,099 | 13 | 4.69/5.0 |
| Fabio | 2 | $9,722 | 49 | 4.97/5.0 |
| Host #229607843 | 1 | $6,944 | 84 | 4.77/5.0 |
| Davide | 1 | $6,142 | 64 | 4.83/5.0 |
| Monica | 1 | $3,312 | 16 | 4.25/5.0 |
Analyzing the strategies of top hosts, such as their property selection, pricing, and guest communication, can offer valuable lessons for optimizing your own Airbnb operations in Lainate.
Dive Deeper: Advanced Lainate STR Market Data (2025)
Ready to unlock more insights? AirROI provides access to advanced metrics and comprehensive Airbnb data for Lainate. Explore detailed analytics beyond this report to refine your investment strategy, optimize pricing, and maximize your vacation rental profits.
Explore Advanced MetricsLainate Short-Term Rental Market Composition (2025): Property & Room Types
Room Type Distribution
Property Type Distribution
Market Composition Insights for Lainate
- The Lainate Airbnb market composition is heavily skewed towards Entire Home/Apt listings, which make up 64.7% of the 17 active rentals. This indicates strong guest preference for privacy and space.
- However, a notable 35.3% share for Private Rooms suggests opportunities for budget-conscious travelers or hosts renting out spare rooms.
- Looking at the property type distribution in Lainate, Apartment/Condo properties are the most common (70.6%), reflecting the local real estate landscape.
- The presence of 11.8% Hotel/Boutique listings indicates integration with traditional hospitality.
Lainate Airbnb Room Capacity Analysis (2025): Bedroom Distribution
Distribution of Listings by Number of Bedrooms
Room Capacity Insights for Lainate
- The dominant room capacity in Lainate is 1 bedroom listings, making up 52.9% of the market. This suggests a strong demand for properties suitable for couples or solo travelers.
- Together, 1 bedroom and 2 bedrooms properties represent 70.5% of the active Airbnb listings in Lainate, indicating a high concentration in these sizes.
- With over half the market (52.9%) consisting of studios or 1-bedroom units, Lainate is particularly well-suited for individuals or couples.
Lainate Vacation Rental Guest Capacity Trends (2025)
Distribution of Listings by Guest Capacity
Guest Capacity Insights for Lainate
- The most common guest capacity trend in Lainate vacation rentals is listings accommodating 2 guests (52.9%). This suggests the primary traveler segment is likely couples or solo travelers.
- Properties designed for 2 guests and 4 guests dominate the Lainate STR market, accounting for 64.7% of listings.
- A significant 58.8% of listings cater specifically to 1-2 guests, highlighting strong demand from couples and solo travelers in Lainate.
- On average, properties in Lainate are equipped to host 1.8 guests.
Lainate Airbnb Booking Patterns (2025): Available vs. Booked Days
Available Days Distribution
Booked Days Distribution
Booking Pattern Insights for Lainate
- The most common availability pattern in Lainate falls within the 271-366 days range, representing 52.9% of listings. This suggests many properties have significant open periods on their calendars.
- Approximately 64.7% of listings show high availability (181+ days open annually), indicating potential for increased bookings or specific owner usage patterns.
- For booked days, the 31-90 days range is most frequent in Lainate (41.2%), reflecting common guest stay durations or potential owner blocking patterns.
- A notable 35.3% of properties secure long booking periods (181+ days booked per year), highlighting successful long-term rental strategies or significant owner usage.
Lainate Airbnb Minimum Stay Requirements Analysis
Distribution of Listings by Minimum Night Requirement
1 Night
11 listings
68.8% of total
2 Nights
4 listings
25% of total
7-29 Nights
1 listings
6.3% of total
Key Insights
- The most prevalent minimum stay requirement in Lainate is 1 Night, adopted by 68.8% of listings. This highlights the market's preference for shorter, flexible bookings.
- A strong majority (93.8%) of the Lainate Airbnb data shows acceptance of very short stays (1-2 nights), indicating a dynamic, high-turnover market.
Recommendations
- Align with the market by considering a 1 Night minimum stay, as 68.8% of Lainate hosts use this setting.
- Adjust minimum nights based on seasonality – potentially shorter during low season and longer during peak demand periods in Lainate.
Lainate Airbnb Cancellation Policy Trends Analysis (2025)
Flexible
11 listings
73.3% of total
Moderate
3 listings
20% of total
Strict
1 listings
6.7% of total
Cancellation Policy Insights for Lainate
- The prevailing Airbnb cancellation policy trend in Lainate is Flexible, used by 73.3% of listings.
- The market strongly favors guest-friendly terms, with 93.3% of listings offering Flexible or Moderate policies. This suggests guests in Lainate may expect booking flexibility.
- Strict cancellation policies are quite rare (6.7%), potentially making listings with this policy less competitive unless justified by high demand or property type.
Recommendations for Hosts
- Consider adopting a Flexible policy to align with the 73.3% market standard in Lainate.
- Given the high prevalence of Flexible policies (73.3%), offering this can enhance booking appeal, especially during shoulder seasons.
- Using a Strict policy might deter some guests, as only 6.7% of listings use it. Evaluate if potential revenue protection outweighs possible lower booking rates.
- Regularly review your cancellation policy against competitors and market demand shifts in Lainate.
Lainate STR Booking Lead Time Analysis (2025)
Average Booking Lead Time by Month
Booking Lead Time Insights for Lainate
- The overall average booking lead time for vacation rentals in Lainate is 38 days.
- Guests book furthest in advance for stays during April (average 104 days), likely coinciding with peak travel demand or local events.
- The shortest booking windows occur for stays in January (average 14 days), indicating more last-minute travel plans during this time.
- Seasonally, Summer (58 days avg.) sees the longest lead times, while Winter (22 days avg.) has the shortest, reflecting typical travel planning cycles.
Recommendations for Hosts
- Use the overall average lead time (38 days) as a baseline for your pricing and availability strategy in Lainate.
- For April stays, consider implementing length-of-stay discounts or slightly higher rates for bookings made less than 104 days out to capitalize on advance planning.
- During January, focus on last-minute booking availability and promotions, as guests book with very short notice (14 days avg.).
- Target marketing efforts for the Summer season well in advance (at least 58 days) to capture early planners.
- Monitor your own booking lead times against these Lainate averages to identify opportunities for dynamic pricing adjustments.
Popular & Essential Airbnb Amenities in Lainate (2025)
Amenity Prevalence
Amenity Insights for Lainate
- Essential amenities in Lainate that guests expect include: Wifi. Lacking these (this) could significantly impact bookings.
- Popular amenities like Hair dryer, Heating, Kitchen are common but not universal. Offering these can provide a competitive edge.
Recommendations for Hosts
- Ensure your listing includes all essential amenities for Lainate: Wifi.
- Consider adding popular differentiators like Hair dryer or Heating to increase appeal.
- Highlight unique or less common amenities you offer (e.g., hot tub, dedicated workspace, EV charger) in your listing description and photos.
- Regularly check competitor amenities in Lainate to stay competitive.
Lainate Airbnb Guest Demographics & Profile Analysis (2025)
Guest Profile Summary for Lainate
- The typical guest profile for Airbnb in Lainate consists of predominantly international visitors (81%), with top international origins including France, typically belonging to the Post-2000s (Gen Z/Alpha) group (50%), primarily speaking English or Spanish.
- Domestic travelers account for 19.5% of guests.
- Key international markets include Germany (20%) and France (19.5%).
- Top languages spoken are English (34.3%) followed by Spanish (13.4%).
- A significant demographic segment is the Post-2000s (Gen Z/Alpha) group, representing 50% of guests.
Recommendations for Hosts
- Focus marketing internationally, particularly towards travelers from France.
- Tailor amenities and listing descriptions to appeal to the dominant Post-2000s (Gen Z/Alpha) demographic (e.g., highlight fast WiFi, smart home features, local guides).
- Highlight unique local experiences or amenities relevant to the primary guest profile.
- Consider seasonal promotions aligned with peak travel times for key origin markets.
Nearby Short-Term Rental Market Comparison
How does the Lainate Airbnb market stack up against its neighbors? Compare key performance metrics like average monthly revenue, ADR, and occupancy rates in surrounding areas to understand the broader regional STR landscape.
| Market | Active Properties | Monthly Revenue | Daily Rate | Avg. Occupancy |
|---|---|---|---|---|
| Grindelwald | 489 | $4,921 | $345.40 | 57% |
| Laglio | 64 | $4,873 | $463.61 | 47% |
| Brienz (BE) | 141 | $4,353 | $294.17 | 55% |
| Alpnach | 11 | $4,227 | $234.19 | 49% |
| Brenzone sul Garda | 19 | $4,128 | $335.25 | 52% |
| Portofino | 68 | $4,086 | $454.35 | 44% |
| Sala Comacina | 64 | $3,794 | $400.27 | 50% |
| Sachseln | 15 | $3,742 | $262.18 | 56% |
| Cossano Belbo | 13 | $3,632 | $284.21 | 42% |
| Bellagio | 373 | $3,630 | $328.26 | 55% |