Grosotto Airbnb Market Analysis 2025: Short Term Rental Data & Vacation Rental Statistics in Lombardy, Italy
Is Airbnb profitable in Grosotto in 2025? Explore comprehensive Airbnb analytics for Grosotto, Lombardy, Italy to uncover income potential. This 2025 STR market report for Grosotto, based on AirROI data from April 2024 to March 2025, reveals key trends in the niche market of 22 active listings.
Whether you're considering an Airbnb investment in Grosotto, optimizing your existing vacation rental, or exploring rental arbitrage opportunities, understanding the Grosotto Airbnb data is crucial. Navigating the high regulation landscape is key to maximizing your short term rental income potential. Let's dive into the specifics.
Key Grosotto Airbnb Performance Metrics Overview
Monthly Airbnb Revenue Variations & Income Potential in Grosotto (2025)
Understanding the monthly revenue variations for Airbnb listings in Grosotto is key to maximizing your short term rental income potential. Seasonality significantly impacts earnings. Our analysis, based on data from the past 12 months, shows that the peak revenue month for STRs in Grosotto is typically August, while March often presents the lowest earnings, highlighting opportunities for strategic pricing adjustments during shoulder and low seasons. Explore the typical Airbnb income in Grosotto across different performance tiers:
- Best-in-class properties (Top 10%) achieve $3,138+ monthly, often utilizing dynamic pricing and superior guest experiences.
- Strong performing properties (Top 25%) earn $2,097 or more, indicating effective management and desirable locations/amenities.
- Typical properties (Median) generate around $985 per month, representing the average market performance.
- Entry-level properties (Bottom 25%) see earnings around $506, often with potential for optimization.
Average Monthly Airbnb Earnings Trend in Grosotto
Grosotto Airbnb Occupancy Rate Trends (2025)
Maximize your bookings by understanding the Grosotto STR occupancy trends. Seasonal demand shifts significantly influence how often properties are booked. Typically, Augustsees the highest demand (peak season occupancy), while March experiences the lowest (low season). Effective strategies, like adjusting minimum stays or offering promotions, can boost occupancy during slower periods. Here's how different property tiers perform in Grosotto:
- Best-in-class properties (Top 10%) achieve 68%+ occupancy, indicating high desirability and potentially optimized availability.
- Strong performing properties (Top 25%) maintain 49% or higher occupancy, suggesting good market fit and guest satisfaction.
- Typical properties (Median) have an occupancy rate around 29%.
- Entry-level properties (Bottom 25%) average 12% occupancy, potentially facing higher vacancy.
Average Monthly Occupancy Rate Trend in Grosotto
Average Daily Rate (ADR) Airbnb Trends in Grosotto (2025)
Effective short term rental pricing strategy in Grosotto involves understanding monthly ADR fluctuations. The Average Daily Rate (ADR) for Airbnb in Grosotto typically peaks in July and dips lowest during November. Leveraging Airbnb dynamic pricing tools or strategies based on this seasonality can significantly boost revenue. Here's a look at the typical nightly rates achieved:
- Best-in-class properties (Top 10%) command rates of $179+ per night, often due to premium features or locations.
- Strong performing properties (Top 25%) achieve nightly rates of $151 or more.
- Typical properties (Median) charge around $118 per night.
- Entry-level properties (Bottom 25%) earn around $86 per night.
Average Daily Rate (ADR) Trend by Month in Grosotto
Get Live Grosotto Market Intelligence 👇

Explore Real-time Analytics
Airbnb Seasonality Analysis & Trends in Grosotto (2025)
Peak Season (August, May, July)
- Revenue averages $1,880 per month
- Occupancy rates average 43.3%
- Daily rates average $128
Shoulder Season
- Revenue averages $1,466 per month
- Occupancy maintains around 35.6%
- Daily rates hold near $123
Low Season (March, April, December)
- Revenue drops to average $924 per month
- Occupancy decreases to average 22.8%
- Daily rates adjust to average $124
Seasonality Insights for Grosotto
- The Airbnb seasonality in Grosotto shows highly seasonal trends requiring careful strategy. While the sections above show seasonal averages, it's also insightful to look at the extremes:
- During the high season, the absolute peak month showcases Grosotto's highest earning potential, with monthly revenues capable of climbing to $2,134, occupancy reaching a high of 54.2%, and ADRs peaking at $132.
- Conversely, the slowest single month of the year, typically falling within the low season, marks the market's lowest point. In this month, revenue might dip to $692, occupancy could drop to 17.4%, and ADRs may adjust down to $116.
- Understanding both the seasonal averages and these monthly peaks and troughs in revenue, occupancy, and ADR is crucial for maximizing your Airbnb profit potential in Grosotto.
Seasonal Strategies for Maximizing Profit
- Peak Season: Maximize revenue through premium pricing and potentially longer minimum stays. Ensure high availability.
- Low Season: Offer competitive pricing, special promotions (e.g., extended stay discounts), and flexible cancellation policies. Target off-season travelers like remote workers or budget-conscious guests.
- Shoulder Seasons: Implement dynamic pricing that balances peak and low rates. Target weekend travelers or specific events. Offer slightly more flexible terms than peak season.
- Regularly analyze your own performance against these Grosotto seasonality benchmarks and adjust your pricing and availability strategy accordingly.
Best Areas for Airbnb Investment in Grosotto (2025)
Exploring the top neighborhoods for short-term rentals in Grosotto? This section highlights key areas, outlining why they are attractive for hosts and guests, along with notable local attractions. Consider these locations based on your target guest profile and investment strategy.
| Neighborhood / Area | Why Host Here? (Target Guests & Appeal) | Key Attractions & Landmarks |
|---|---|---|
| Grosotto Centre | The heart of Grosotto, offering a mix of local culture and historical charm. Close to essential amenities and attractions, making it a convenient base for visitors. | San Giovanni Battista Church, Civic Museum of Grosotto, Piazza della Libertà, local markets, historical buildings |
| Valtellina Valley | A stunning natural area perfect for outdoor enthusiasts, known for skiing in winter and hiking in summer. Attracts guests looking for adventure and scenic beauty. | Orobie Valtellinesi Park, Ski resorts, Biking trails, Local wineries, Thermal spas |
| Sondrio | Nearby city with a rich history and beautiful architecture, offering additional attractions and amenities. A great option for guests looking to explore beyond Grosotto. | Museo Valtellinese di Storia e Arte, Piazza Garibaldi, Vittoria’s Castle, Wine cellars, Local restaurants |
| Bormio | A popular destination for spa tourism and skiing. Visitors are drawn to the thermal baths and winter sports, making it an attractive spot for Airbnb hosting. | Bormio Thermal Baths, Bormio Ski Resort, Historic center, Ciuk Ski Center, Stelvio National Park |
| Livigno | Famous for skiing and as a duty-free shop area. Attracts tourists all year round for both winter sports and summer hiking. | Livigno Ski Area, Duty-Free Shops, Lake Livigno, Mountain biking trails, Lago di Livigno |
| Aprica | A charming ski resort that is less crowded than others, appealing to families and independent travelers looking for a quieter escape. | Aprica Ski Resort, Hiking trails, Local festivals, Restaurants and bars, Panoramic views |
| Tirano | Gateway to the Bernina Express scenic train. It's ideal for tourists seeking beautiful train journeys and access to the Alps. | Bernina Express, Tirano's Sanctuary, Historic main square, Local wine tasting experiences, Scenic hiking routes |
| Corte di Neto | A hidden gem that offers a tranquil atmosphere and beautiful landscapes, appealing to those looking for a peaceful getaway. | Natural parks, Hiking paths, Cultural events, Local cuisine, Quiet retreats |
Understanding Airbnb License Requirements & STR Laws in Grosotto (2025)
Yes, Grosotto, Lombardy, Italy enforces high STR regulations. Obtaining a license and ensuring compliance is almost certainly required according to current 2025 STR laws. Always verify the latest short term rental regulations and Airbnb license requirements directly with local government authorities for Grosotto to ensure full compliance before hosting.
(Source: AirROI data, 2025, based on 50% licensed listings)
Top Performing Airbnb Properties in Grosotto (2025)
Benchmark your potential! Explore examples of top-performing Airbnb properties in Grosottobased on Trailing Twelve Month (TTM) revenue. Analyze their characteristics, revenue, occupancy rate, and ADR to understand what drives success in this market.
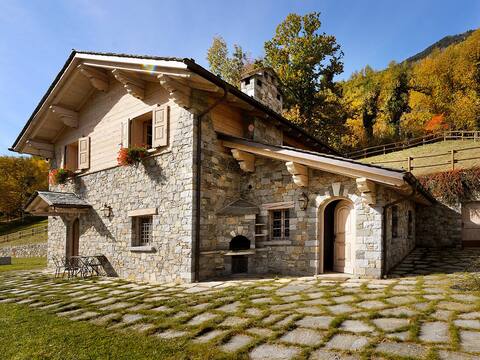
Chalet Anna by Interhome
Entire Place • 3 bedrooms

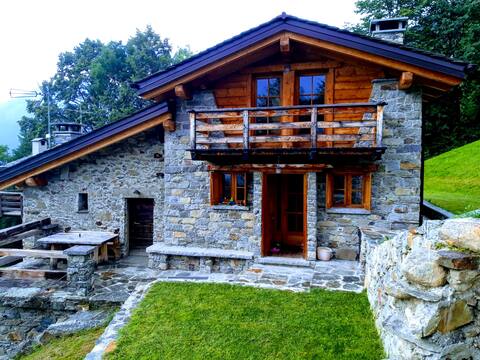
Chalet in the woods
Entire Place • 3 bedrooms
The family house on Mortirolo sport relax and fun
Entire Place • 3 bedrooms
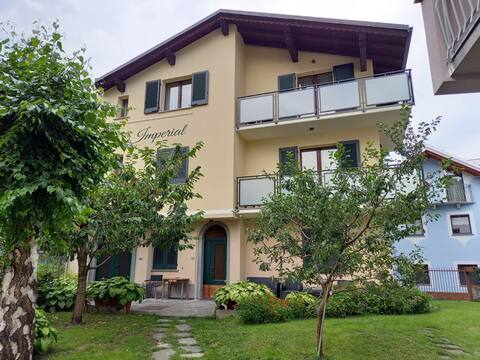
App.Mortirolo-Imperial rooms-8 posti
Entire Place • 3 bedrooms
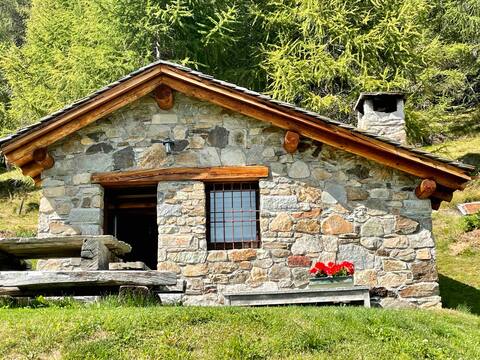
Chalet surrounded by nature
Entire Place • 1 bedroom
Stelvio by Interhome
Entire Place • 3 bedrooms
Note: Performance varies based on location, size, amenities, seasonality, and management quality. Data reflects the past 12 months.
Top Performing Airbnb Hosts in Grosotto (2025)
Learn from the best! This table showcases top-performing Airbnb hosts in Grosotto based on the number of properties managed and estimated total revenue over the past year. Analyze their scale and performance metrics.
| Host Name | Properties | Grossing Revenue | Stay Reviews | Avg Rating |
|---|---|---|---|---|
| Alessandra - Interhome Group | 2 | $44,867 | 42 | 4.92/5.0 |
| Gianni | 1 | $25,251 | 63 | 4.98/5.0 |
| Martino | 1 | $23,221 | 43 | 5.00/5.0 |
| Marcella | 1 | $19,049 | 17 | 4.65/5.0 |
| Laura | 1 | $18,717 | 22 | 4.73/5.0 |
| Host #41699367 | 3 | $17,687 | 0 | 0.00/5.0 |
| Davide | 1 | $10,133 | 33 | 4.91/5.0 |
| Mauro Matteo | 1 | $6,919 | 30 | 4.97/5.0 |
| Alessandro | 3 | $6,464 | 72 | 4.81/5.0 |
| Garnilecorti | 1 | $5,264 | 8 | 4.63/5.0 |
Analyzing the strategies of top hosts, such as their property selection, pricing, and guest communication, can offer valuable lessons for optimizing your own Airbnb operations in Grosotto.
Dive Deeper: Advanced Grosotto STR Market Data (2025)
Ready to unlock more insights? AirROI provides access to advanced metrics and comprehensive Airbnb data for Grosotto. Explore detailed analytics beyond this report to refine your investment strategy, optimize pricing, and maximize your vacation rental profits.
Explore Advanced MetricsGrosotto Short-Term Rental Market Composition (2025): Property & Room Types
Room Type Distribution
Property Type Distribution
Market Composition Insights for Grosotto
- The Grosotto Airbnb market composition is heavily skewed towards Entire Home/Apt listings, which make up 95.5% of the 22 active rentals. This indicates strong guest preference for privacy and space.
- Looking at the property type distribution in Grosotto, Apartment/Condo properties are the most common (36.4%), reflecting the local real estate landscape.
- Houses represent a significant 36.4% portion, catering likely to families or larger groups.
- Smaller segments like hotel/boutique (combined 4.5%) offer potential for unique stay experiences.
Grosotto Airbnb Room Capacity Analysis (2025): Bedroom Distribution
Distribution of Listings by Number of Bedrooms
Room Capacity Insights for Grosotto
- The dominant room capacity in Grosotto is 1 bedroom listings, making up 36.4% of the market. This suggests a strong demand for properties suitable for couples or solo travelers.
- Together, 1 bedroom and 2 bedrooms properties represent 68.2% of the active Airbnb listings in Grosotto, indicating a high concentration in these sizes.
- A significant 31.8% of listings offer 3+ bedrooms, catering to larger groups and families seeking more space in Grosotto.
Grosotto Vacation Rental Guest Capacity Trends (2025)
Distribution of Listings by Guest Capacity
Guest Capacity Insights for Grosotto
- The most common guest capacity trend in Grosotto vacation rentals is listings accommodating 8+ guests (27.3%). This suggests the primary traveler segment is likely larger groups.
- Properties designed for 8+ guests and 4 guests dominate the Grosotto STR market, accounting for 50.0% of listings.
- 40.9% of properties accommodate 6+ guests, serving the market segment for larger families or group travel in Grosotto.
- On average, properties in Grosotto are equipped to host 5.3 guests.
Grosotto Airbnb Booking Patterns (2025): Available vs. Booked Days
Available Days Distribution
Booked Days Distribution
Booking Pattern Insights for Grosotto
- The most common availability pattern in Grosotto falls within the 271-366 days range, representing 68.2% of listings. This suggests many properties have significant open periods on their calendars.
- Approximately 95.5% of listings show high availability (181+ days open annually), indicating potential for increased bookings or specific owner usage patterns.
- For booked days, the 31-90 days range is most frequent in Grosotto (50%), reflecting common guest stay durations or potential owner blocking patterns.
- A notable 4.5% of properties secure long booking periods (181+ days booked per year), highlighting successful long-term rental strategies or significant owner usage.
Grosotto Airbnb Minimum Stay Requirements Analysis
Distribution of Listings by Minimum Night Requirement
1 Night
1 listings
5.9% of total
2 Nights
1 listings
5.9% of total
3 Nights
8 listings
47.1% of total
4-6 Nights
2 listings
11.8% of total
30+ Nights
5 listings
29.4% of total
Key Insights
- The most prevalent minimum stay requirement in Grosotto is 3 Nights, adopted by 47.1% of listings. This highlights the market's preference for longer commitments.
- Very short stays (1-2 nights) are less common (11.8%), suggesting hosts prefer slightly longer bookings to optimize turnover.
- A significant segment (29.4%) caters to monthly stays (30+ nights) in Grosotto, pointing to opportunities in the extended-stay market.
Recommendations
- Align with the market by considering a 3 Nights minimum stay, as 47.1% of Grosotto hosts use this setting.
- If feasible, allowing 1-night stays, especially midweek or during low season, could capture last-minute bookings, as only 5.9% currently do.
- Explore offering discounts for stays of 30+ nights to attract the 29.4% of the market seeking extended stays.
- Adjust minimum nights based on seasonality – potentially shorter during low season and longer during peak demand periods in Grosotto.
Grosotto Airbnb Cancellation Policy Trends Analysis (2025)
Super Strict 30 Days
2 listings
11.8% of total
Flexible
6 listings
35.3% of total
Moderate
8 listings
47.1% of total
Strict
1 listings
5.9% of total
Cancellation Policy Insights for Grosotto
- The prevailing Airbnb cancellation policy trend in Grosotto is Moderate, used by 47.1% of listings.
- The market strongly favors guest-friendly terms, with 82.4% of listings offering Flexible or Moderate policies. This suggests guests in Grosotto may expect booking flexibility.
- Strict cancellation policies are quite rare (5.9%), potentially making listings with this policy less competitive unless justified by high demand or property type.
Recommendations for Hosts
- Consider adopting a Moderate policy to align with the 47.1% market standard in Grosotto.
- Using a Strict policy might deter some guests, as only 5.9% of listings use it. Evaluate if potential revenue protection outweighs possible lower booking rates.
- Regularly review your cancellation policy against competitors and market demand shifts in Grosotto.
Grosotto STR Booking Lead Time Analysis (2025)
Average Booking Lead Time by Month
Booking Lead Time Insights for Grosotto
- The overall average booking lead time for vacation rentals in Grosotto is 67 days.
- Guests book furthest in advance for stays during June (average 149 days), likely coinciding with peak travel demand or local events.
- The shortest booking windows occur for stays in March (average 38 days), indicating more last-minute travel plans during this time.
- Seasonally, Summer (105 days avg.) sees the longest lead times, while Fall (67 days avg.) has the shortest, reflecting typical travel planning cycles.
Recommendations for Hosts
- Use the overall average lead time (67 days) as a baseline for your pricing and availability strategy in Grosotto.
- For June stays, consider implementing length-of-stay discounts or slightly higher rates for bookings made less than 149 days out to capitalize on advance planning.
- Target marketing efforts for the Summer season well in advance (at least 105 days) to capture early planners.
- Monitor your own booking lead times against these Grosotto averages to identify opportunities for dynamic pricing adjustments.
Popular & Essential Airbnb Amenities in Grosotto (2025)
Amenity Prevalence
Amenity Insights for Grosotto
- Essential amenities in Grosotto that guests expect include: Kitchen. Lacking these (this) could significantly impact bookings.
- Popular amenities like TV, Essentials, Hot water are common but not universal. Offering these can provide a competitive edge.
Recommendations for Hosts
- Ensure your listing includes all essential amenities for Grosotto: Kitchen.
- Prioritize adding missing essentials: Kitchen.
- Consider adding popular differentiators like TV or Essentials to increase appeal.
- Highlight unique or less common amenities you offer (e.g., hot tub, dedicated workspace, EV charger) in your listing description and photos.
- Regularly check competitor amenities in Grosotto to stay competitive.
Grosotto Airbnb Guest Demographics & Profile Analysis (2025)
Guest Profile Summary for Grosotto
- The typical guest profile for Airbnb in Grosotto consists of a mix of domestic (47%) and international guests, with top international origins including Netherlands, typically belonging to the Post-2000s (Gen Z/Alpha) group (50%), primarily speaking English or Italian.
- Domestic travelers account for 47.4% of guests.
- Key international markets include Italy (47.4%) and Netherlands (11.8%).
- Top languages spoken are English (36.2%) followed by Italian (25.5%).
- A significant demographic segment is the Post-2000s (Gen Z/Alpha) group, representing 50% of guests.
Recommendations for Hosts
- Balance marketing efforts between domestic and international channels based on the guest mix.
- Tailor amenities and listing descriptions to appeal to the dominant Post-2000s (Gen Z/Alpha) demographic (e.g., highlight fast WiFi, smart home features, local guides).
- Highlight unique local experiences or amenities relevant to the primary guest profile.
- Consider seasonal promotions aligned with peak travel times for key origin markets.
Nearby Short-Term Rental Market Comparison
How does the Grosotto Airbnb market stack up against its neighbors? Compare key performance metrics like average monthly revenue, ADR, and occupancy rates in surrounding areas to understand the broader regional STR landscape.
| Market | Active Properties | Monthly Revenue | Daily Rate | Avg. Occupancy |
|---|---|---|---|---|
| Laglio | 64 | $4,873 | $463.61 | 47% |
| Bayrischzell | 30 | $4,718 | $392.87 | 42% |
| Urtijëi - St. Ulrich in Gröden - Ortisei | 163 | $4,698 | $630.45 | 40% |
| Moos in Passeier - Moso in Passiria | 17 | $4,619 | $547.60 | 27% |
| Steinberg am Rofan | 11 | $4,394 | $311.71 | 40% |
| Brenzone sul Garda | 19 | $4,128 | $335.25 | 52% |
| Bürserberg | 40 | $3,978 | $342.57 | 41% |
| Sala Comacina | 64 | $3,794 | $400.27 | 50% |
| Bellagio | 373 | $3,630 | $328.26 | 55% |
| Brand | 56 | $3,597 | $486.13 | 33% |