Grosio Airbnb Market Analysis 2025: Short Term Rental Data & Vacation Rental Statistics in Lombardy, Italy
Is Airbnb profitable in Grosio in 2025? Explore comprehensive Airbnb analytics for Grosio, Lombardy, Italy to uncover income potential. This 2025 STR market report for Grosio, based on AirROI data from April 2024 to March 2025, reveals key trends in the niche market of 28 active listings.
Whether you're considering an Airbnb investment in Grosio, optimizing your existing vacation rental, or exploring rental arbitrage opportunities, understanding the Grosio Airbnb data is crucial. Navigating the high regulation landscape is key to maximizing your short term rental income potential. Let's dive into the specifics.
Key Grosio Airbnb Performance Metrics Overview
Monthly Airbnb Revenue Variations & Income Potential in Grosio (2025)
Understanding the monthly revenue variations for Airbnb listings in Grosio is key to maximizing your short term rental income potential. Seasonality significantly impacts earnings. Our analysis, based on data from the past 12 months, shows that the peak revenue month for STRs in Grosio is typically August, while March often presents the lowest earnings, highlighting opportunities for strategic pricing adjustments during shoulder and low seasons. Explore the typical Airbnb income in Grosio across different performance tiers:
- Best-in-class properties (Top 10%) achieve $2,519+ monthly, often utilizing dynamic pricing and superior guest experiences.
- Strong performing properties (Top 25%) earn $1,401 or more, indicating effective management and desirable locations/amenities.
- Typical properties (Median) generate around $724 per month, representing the average market performance.
- Entry-level properties (Bottom 25%) see earnings around $432, often with potential for optimization.
Average Monthly Airbnb Earnings Trend in Grosio
Grosio Airbnb Occupancy Rate Trends (2025)
Maximize your bookings by understanding the Grosio STR occupancy trends. Seasonal demand shifts significantly influence how often properties are booked. Typically, Augustsees the highest demand (peak season occupancy), while April experiences the lowest (low season). Effective strategies, like adjusting minimum stays or offering promotions, can boost occupancy during slower periods. Here's how different property tiers perform in Grosio:
- Best-in-class properties (Top 10%) achieve 66%+ occupancy, indicating high desirability and potentially optimized availability.
- Strong performing properties (Top 25%) maintain 41% or higher occupancy, suggesting good market fit and guest satisfaction.
- Typical properties (Median) have an occupancy rate around 26%.
- Entry-level properties (Bottom 25%) average 13% occupancy, potentially facing higher vacancy.
Average Monthly Occupancy Rate Trend in Grosio
Average Daily Rate (ADR) Airbnb Trends in Grosio (2025)
Effective short term rental pricing strategy in Grosio involves understanding monthly ADR fluctuations. The Average Daily Rate (ADR) for Airbnb in Grosio typically peaks in August and dips lowest during March. Leveraging Airbnb dynamic pricing tools or strategies based on this seasonality can significantly boost revenue. Here's a look at the typical nightly rates achieved:
- Best-in-class properties (Top 10%) command rates of $189+ per night, often due to premium features or locations.
- Strong performing properties (Top 25%) achieve nightly rates of $127 or more.
- Typical properties (Median) charge around $96 per night.
- Entry-level properties (Bottom 25%) earn around $80 per night.
Average Daily Rate (ADR) Trend by Month in Grosio
Get Live Grosio Market Intelligence 👇

Explore Real-time Analytics
Airbnb Seasonality Analysis & Trends in Grosio (2025)
Peak Season (August, July, October)
- Revenue averages $1,709 per month
- Occupancy rates average 47.4%
- Daily rates average $147
Shoulder Season
- Revenue averages $959 per month
- Occupancy maintains around 28.2%
- Daily rates hold near $129
Low Season (February, March, April)
- Revenue drops to average $628 per month
- Occupancy decreases to average 19.2%
- Daily rates adjust to average $124
Seasonality Insights for Grosio
- The Airbnb seasonality in Grosio shows highly seasonal trends requiring careful strategy. While the sections above show seasonal averages, it's also insightful to look at the extremes:
- During the high season, the absolute peak month showcases Grosio's highest earning potential, with monthly revenues capable of climbing to $2,257, occupancy reaching a high of 61.5%, and ADRs peaking at $154.
- Conversely, the slowest single month of the year, typically falling within the low season, marks the market's lowest point. In this month, revenue might dip to $538, occupancy could drop to 13.1%, and ADRs may adjust down to $111.
- Understanding both the seasonal averages and these monthly peaks and troughs in revenue, occupancy, and ADR is crucial for maximizing your Airbnb profit potential in Grosio.
Seasonal Strategies for Maximizing Profit
- Peak Season: Maximize revenue through premium pricing and potentially longer minimum stays. Ensure high availability.
- Low Season: Offer competitive pricing, special promotions (e.g., extended stay discounts), and flexible cancellation policies. Target off-season travelers like remote workers or budget-conscious guests.
- Shoulder Seasons: Implement dynamic pricing that balances peak and low rates. Target weekend travelers or specific events. Offer slightly more flexible terms than peak season.
- Regularly analyze your own performance against these Grosio seasonality benchmarks and adjust your pricing and availability strategy accordingly.
Best Areas for Airbnb Investment in Grosio (2025)
Exploring the top neighborhoods for short-term rentals in Grosio? This section highlights key areas, outlining why they are attractive for hosts and guests, along with notable local attractions. Consider these locations based on your target guest profile and investment strategy.
| Neighborhood / Area | Why Host Here? (Target Guests & Appeal) | Key Attractions & Landmarks |
|---|---|---|
| Grosio Center | The main hub of Grosio, featuring charming local shops and eateries, making it a popular choice for visitors wanting to experience small-town Italian life. | Castello di Grosio, Museo dei Fossili, Cascate di Grosio, Pista Ciclabile Valmalenco, Chiesa di San Bartolomeo |
| Valmalenco | A stunning natural area known for outdoor activities like skiing in winter and hiking in summer. Perfect for tourists seeking adventure and breathtaking landscapes. | Ski Resort Valmalenco, Cima Piazzi, Lake Palù, Snow Park Valmalenco, Albedo-Explore |
| Rifugio Malinverni | A beautiful mountain refuge that attracts hikers and nature lovers. Offers cozy accommodations amidst serene nature, making it great for getaway retreats. | Hiking trails, Alpacas of Valmalenco, Mountain viewpoints, Local dining |
| Sondrio | Nearby Sondrio offers a larger variety of services and attractions, making it ideal for those who want a balance of urban and rural experiences. | Valtellinese Museum of History and Art, Pinacoteca Terragni, Sondrio's historic center, Local wine tours |
| Lago di Como | Accessible from Grosio, this famous lake is a major tourist attraction with charming towns, scenic views, and luxury accommodations. | Bellagio, Varenna, Villa del Balbianello, Como town, Water activities |
| Aprica | A popular ski destination close to Grosio, attracting winter sports enthusiasts and those looking for summer hiking opportunities. | Aprica Ski Resort, Mountain biking trails, Family-friendly slopes, Local gastronomy |
| Teglio | Known for its rich history and culinary delights, Teglio offers a unique Italian cultural experience for food lovers and history buffs. | Pizzoccheri, Historical sites, Local wineries, Vallée de Poschiavo |
| Bormio | Famous for its thermal baths and ski slopes, Bormio attracts tourists year-round, making it favorable for Airbnb hosting. | Bormio Ski Resort, Bormio Terme, Stelvio National Park, Ciuk Ski Area, Historic old town |
Understanding Airbnb License Requirements & STR Laws in Grosio (2025)
Yes, Grosio, Lombardy, Italy enforces high STR regulations. Obtaining a license and ensuring compliance is almost certainly required according to current 2025 STR laws. Always verify the latest short term rental regulations and Airbnb license requirements directly with local government authorities for Grosio to ensure full compliance before hosting.
(Source: AirROI data, 2025, based on 86% licensed listings)
Top Performing Airbnb Properties in Grosio (2025)
Benchmark your potential! Explore examples of top-performing Airbnb properties in Grosiobased on Trailing Twelve Month (TTM) revenue. Analyze their characteristics, revenue, occupancy rate, and ADR to understand what drives success in this market.

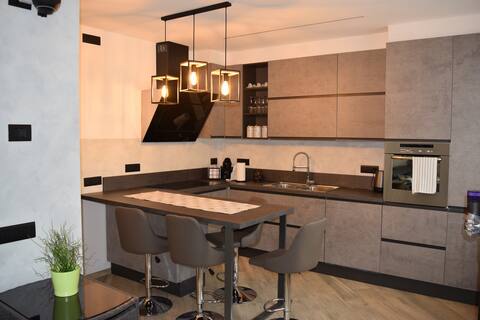
App."Piscen" - Holiday house "In the shade of the Pines"
Entire Place • 1 bedroom
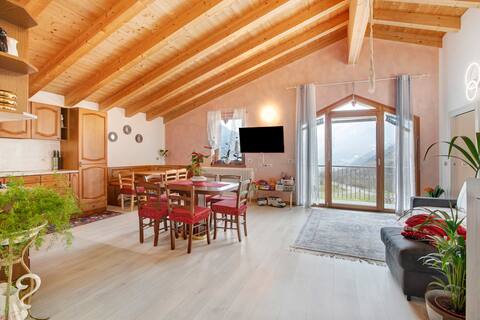
Cabin Valtellina -Relax in the heart of the Alps-
Entire Place • 2 bedrooms

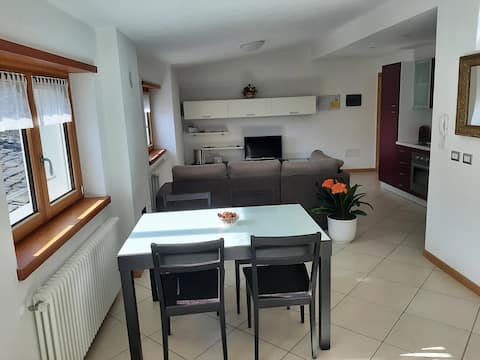
"Baita di Sacco" CIN it014033c2akkimb4l
Entire Place • 3 bedrooms
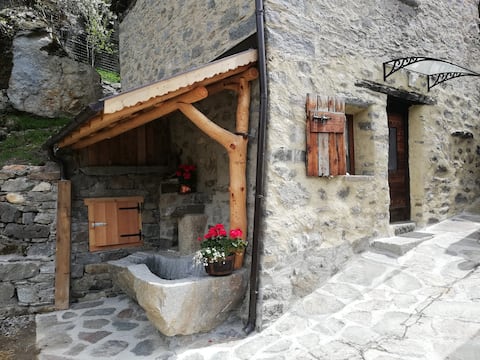
Casa Sergio
Entire Place • 3 bedrooms
Jenny's Penthouse
Entire Place • 2 bedrooms
Valgrosina hut
Entire Place • 3 bedrooms
Note: Performance varies based on location, size, amenities, seasonality, and management quality. Data reflects the past 12 months.
Top Performing Airbnb Hosts in Grosio (2025)
Learn from the best! This table showcases top-performing Airbnb hosts in Grosio based on the number of properties managed and estimated total revenue over the past year. Analyze their scale and performance metrics.
| Host Name | Properties | Grossing Revenue | Stay Reviews | Avg Rating |
|---|---|---|---|---|
| Giorgio | 3 | $48,911 | 220 | 4.88/5.0 |
| Christian | 1 | $19,867 | 3 | 5.00/5.0 |
| Ombretta | 3 | $19,854 | 183 | 4.90/5.0 |
| Giacomo | 1 | $16,530 | 25 | 4.96/5.0 |
| Holidu | 1 | $14,383 | 27 | 4.89/5.0 |
| Jenny | 1 | $14,010 | 43 | 4.95/5.0 |
| Pierino | 1 | $13,760 | 90 | 4.93/5.0 |
| Giorgia | 1 | $12,969 | 104 | 4.89/5.0 |
| Gianfranca | 3 | $11,699 | 277 | 4.91/5.0 |
| Francesca | 1 | $11,257 | 35 | 4.97/5.0 |
Analyzing the strategies of top hosts, such as their property selection, pricing, and guest communication, can offer valuable lessons for optimizing your own Airbnb operations in Grosio.
Dive Deeper: Advanced Grosio STR Market Data (2025)
Ready to unlock more insights? AirROI provides access to advanced metrics and comprehensive Airbnb data for Grosio. Explore detailed analytics beyond this report to refine your investment strategy, optimize pricing, and maximize your vacation rental profits.
Explore Advanced MetricsGrosio Short-Term Rental Market Composition (2025): Property & Room Types
Room Type Distribution
Property Type Distribution
Market Composition Insights for Grosio
- The Grosio Airbnb market composition is heavily skewed towards Entire Home/Apt listings, which make up 78.6% of the 28 active rentals. This indicates strong guest preference for privacy and space.
- Looking at the property type distribution in Grosio, Apartment/Condo properties are the most common (39.3%), reflecting the local real estate landscape.
- Houses represent a significant 32.1% portion, catering likely to families or larger groups.
- The presence of 10.7% Hotel/Boutique listings indicates integration with traditional hospitality.
Grosio Airbnb Room Capacity Analysis (2025): Bedroom Distribution
Distribution of Listings by Number of Bedrooms
Room Capacity Insights for Grosio
- The dominant room capacity in Grosio is 2 bedrooms listings, making up 39.3% of the market. This suggests a strong demand for properties suitable for couples or solo travelers.
- Together, 2 bedrooms and 3 bedrooms properties represent 64.3% of the active Airbnb listings in Grosio, indicating a high concentration in these sizes.
- A significant 28.6% of listings offer 3+ bedrooms, catering to larger groups and families seeking more space in Grosio.
Grosio Vacation Rental Guest Capacity Trends (2025)
Distribution of Listings by Guest Capacity
Guest Capacity Insights for Grosio
- The most common guest capacity trend in Grosio vacation rentals is listings accommodating 4 guests (32.1%). This suggests the primary traveler segment is likely small families or groups.
- Properties designed for 4 guests and 8+ guests dominate the Grosio STR market, accounting for 50.0% of listings.
- 35.7% of properties accommodate 6+ guests, serving the market segment for larger families or group travel in Grosio.
- On average, properties in Grosio are equipped to host 4.3 guests.
Grosio Airbnb Booking Patterns (2025): Available vs. Booked Days
Available Days Distribution
Booked Days Distribution
Booking Pattern Insights for Grosio
- The most common availability pattern in Grosio falls within the 271-366 days range, representing 64.3% of listings. This suggests many properties have significant open periods on their calendars.
- Approximately 96.4% of listings show high availability (181+ days open annually), indicating potential for increased bookings or specific owner usage patterns.
- For booked days, the 31-90 days range is most frequent in Grosio (46.4%), reflecting common guest stay durations or potential owner blocking patterns.
- A notable 3.6% of properties secure long booking periods (181+ days booked per year), highlighting successful long-term rental strategies or significant owner usage.
Grosio Airbnb Minimum Stay Requirements Analysis
Distribution of Listings by Minimum Night Requirement
1 Night
11 listings
39.3% of total
2 Nights
7 listings
25% of total
3 Nights
7 listings
25% of total
4-6 Nights
1 listings
3.6% of total
7-29 Nights
1 listings
3.6% of total
30+ Nights
1 listings
3.6% of total
Key Insights
- The most prevalent minimum stay requirement in Grosio is 1 Night, adopted by 39.3% of listings. This highlights the market's preference for shorter, flexible bookings.
- A strong majority (64.3%) of the Grosio Airbnb data shows acceptance of very short stays (1-2 nights), indicating a dynamic, high-turnover market.
Recommendations
- Align with the market by considering a 1 Night minimum stay, as 39.3% of Grosio hosts use this setting.
- Adjust minimum nights based on seasonality – potentially shorter during low season and longer during peak demand periods in Grosio.
Grosio Airbnb Cancellation Policy Trends Analysis (2025)
Super Strict 30 Days
2 listings
7.1% of total
Flexible
13 listings
46.4% of total
Moderate
13 listings
46.4% of total
Cancellation Policy Insights for Grosio
- The prevailing Airbnb cancellation policy trend in Grosio is Flexible, used by 46.4% of listings.
- The market strongly favors guest-friendly terms, with 92.8% of listings offering Flexible or Moderate policies. This suggests guests in Grosio may expect booking flexibility.
Recommendations for Hosts
- Consider adopting a Flexible policy to align with the 46.4% market standard in Grosio.
- Regularly review your cancellation policy against competitors and market demand shifts in Grosio.
Grosio STR Booking Lead Time Analysis (2025)
Average Booking Lead Time by Month
Booking Lead Time Insights for Grosio
- The overall average booking lead time for vacation rentals in Grosio is 62 days.
- Guests book furthest in advance for stays during June (average 93 days), likely coinciding with peak travel demand or local events.
- The shortest booking windows occur for stays in February (average 26 days), indicating more last-minute travel plans during this time.
- Seasonally, Summer (85 days avg.) sees the longest lead times, while Fall (41 days avg.) has the shortest, reflecting typical travel planning cycles.
Recommendations for Hosts
- Use the overall average lead time (62 days) as a baseline for your pricing and availability strategy in Grosio.
- For June stays, consider implementing length-of-stay discounts or slightly higher rates for bookings made less than 93 days out to capitalize on advance planning.
- Target marketing efforts for the Summer season well in advance (at least 85 days) to capture early planners.
- Monitor your own booking lead times against these Grosio averages to identify opportunities for dynamic pricing adjustments.
Popular & Essential Airbnb Amenities in Grosio (2025)
Amenity Prevalence
Amenity Insights for Grosio
- Popular amenities like Bed linens, Free parking on premises, Essentials are common but not universal. Offering these can provide a competitive edge.
Recommendations for Hosts
- Consider adding popular differentiators like Bed linens or Free parking on premises to increase appeal.
- Highlight unique or less common amenities you offer (e.g., hot tub, dedicated workspace, EV charger) in your listing description and photos.
- Regularly check competitor amenities in Grosio to stay competitive.
Grosio Airbnb Guest Demographics & Profile Analysis (2025)
Guest Profile Summary for Grosio
- The typical guest profile for Airbnb in Grosio consists of a mix of domestic (61%) and international guests, often arriving from nearby Milan, typically belonging to the Post-2000s (Gen Z/Alpha) group (50%), primarily speaking English or Italian.
- Domestic travelers account for 61.0% of guests.
- Key international markets include Italy (61%) and Germany (12.8%).
- Top languages spoken are English (38.2%) followed by Italian (25.5%).
- A significant demographic segment is the Post-2000s (Gen Z/Alpha) group, representing 50% of guests.
Recommendations for Hosts
- Target domestic marketing efforts towards travelers from Milan and Como.
- Tailor amenities and listing descriptions to appeal to the dominant Post-2000s (Gen Z/Alpha) demographic (e.g., highlight fast WiFi, smart home features, local guides).
- Highlight unique local experiences or amenities relevant to the primary guest profile.
- Consider seasonal promotions aligned with peak travel times for key origin markets.
Nearby Short-Term Rental Market Comparison
How does the Grosio Airbnb market stack up against its neighbors? Compare key performance metrics like average monthly revenue, ADR, and occupancy rates in surrounding areas to understand the broader regional STR landscape.
| Market | Active Properties | Monthly Revenue | Daily Rate | Avg. Occupancy |
|---|---|---|---|---|
| Bayrischzell | 30 | $4,718 | $392.87 | 42% |
| Urtijëi - St. Ulrich in Gröden - Ortisei | 163 | $4,698 | $630.45 | 40% |
| Moos in Passeier - Moso in Passiria | 17 | $4,619 | $547.60 | 27% |
| Steinberg am Rofan | 11 | $4,394 | $311.71 | 40% |
| Brenzone sul Garda | 19 | $4,128 | $335.25 | 52% |
| Bürserberg | 40 | $3,978 | $342.57 | 41% |
| Sala Comacina | 64 | $3,794 | $400.27 | 50% |
| Bellagio | 373 | $3,630 | $328.26 | 55% |
| Brand | 56 | $3,597 | $486.13 | 33% |
| Laglio | 64 | $4,873 | $463.61 | 47% |