Erba Airbnb Market Analysis 2025: Short Term Rental Data & Vacation Rental Statistics in Lombardy, Italy
Is Airbnb profitable in Erba in 2025? Explore comprehensive Airbnb analytics for Erba, Lombardy, Italy to uncover income potential. This 2025 STR market report for Erba, based on AirROI data from April 2024 to March 2025, reveals key trends in the niche market of 23 active listings.
Whether you're considering an Airbnb investment in Erba, optimizing your existing vacation rental, or exploring rental arbitrage opportunities, understanding the Erba Airbnb data is crucial. Navigating the high regulation landscape is key to maximizing your short term rental income potential. Let's dive into the specifics.
Key Erba Airbnb Performance Metrics Overview
Monthly Airbnb Revenue Variations & Income Potential in Erba (2025)
Understanding the monthly revenue variations for Airbnb listings in Erba is key to maximizing your short term rental income potential. Seasonality significantly impacts earnings. Our analysis, based on data from the past 12 months, shows that the peak revenue month for STRs in Erba is typically August, while March often presents the lowest earnings, highlighting opportunities for strategic pricing adjustments during shoulder and low seasons. Explore the typical Airbnb income in Erba across different performance tiers:
- Best-in-class properties (Top 10%) achieve $3,291+ monthly, often utilizing dynamic pricing and superior guest experiences.
- Strong performing properties (Top 25%) earn $1,952 or more, indicating effective management and desirable locations/amenities.
- Typical properties (Median) generate around $1,215 per month, representing the average market performance.
- Entry-level properties (Bottom 25%) see earnings around $648, often with potential for optimization.
Average Monthly Airbnb Earnings Trend in Erba
Erba Airbnb Occupancy Rate Trends (2025)
Maximize your bookings by understanding the Erba STR occupancy trends. Seasonal demand shifts significantly influence how often properties are booked. Typically, Augustsees the highest demand (peak season occupancy), while April experiences the lowest (low season). Effective strategies, like adjusting minimum stays or offering promotions, can boost occupancy during slower periods. Here's how different property tiers perform in Erba:
- Best-in-class properties (Top 10%) achieve 79%+ occupancy, indicating high desirability and potentially optimized availability.
- Strong performing properties (Top 25%) maintain 60% or higher occupancy, suggesting good market fit and guest satisfaction.
- Typical properties (Median) have an occupancy rate around 37%.
- Entry-level properties (Bottom 25%) average 19% occupancy, potentially facing higher vacancy.
Average Monthly Occupancy Rate Trend in Erba
Average Daily Rate (ADR) Airbnb Trends in Erba (2025)
Effective short term rental pricing strategy in Erba involves understanding monthly ADR fluctuations. The Average Daily Rate (ADR) for Airbnb in Erba typically peaks in November and dips lowest during October. Leveraging Airbnb dynamic pricing tools or strategies based on this seasonality can significantly boost revenue. Here's a look at the typical nightly rates achieved:
- Best-in-class properties (Top 10%) command rates of $223+ per night, often due to premium features or locations.
- Strong performing properties (Top 25%) achieve nightly rates of $119 or more.
- Typical properties (Median) charge around $82 per night.
- Entry-level properties (Bottom 25%) earn around $66 per night.
Average Daily Rate (ADR) Trend by Month in Erba
Get Live Erba Market Intelligence 👇

Explore Real-time Analytics
Airbnb Seasonality Analysis & Trends in Erba (2025)
Peak Season (August, July, September)
- Revenue averages $2,649 per month
- Occupancy rates average 57.5%
- Daily rates average $144
Shoulder Season
- Revenue averages $1,657 per month
- Occupancy maintains around 35.1%
- Daily rates hold near $149
Low Season (January, February, March)
- Revenue drops to average $880 per month
- Occupancy decreases to average 34.6%
- Daily rates adjust to average $157
Seasonality Insights for Erba
- The Airbnb seasonality in Erba shows highly seasonal trends requiring careful strategy. While the sections above show seasonal averages, it's also insightful to look at the extremes:
- During the high season, the absolute peak month showcases Erba's highest earning potential, with monthly revenues capable of climbing to $2,872, occupancy reaching a high of 72.2%, and ADRs peaking at $163.
- Conversely, the slowest single month of the year, typically falling within the low season, marks the market's lowest point. In this month, revenue might dip to $800, occupancy could drop to 29.2%, and ADRs may adjust down to $141.
- Understanding both the seasonal averages and these monthly peaks and troughs in revenue, occupancy, and ADR is crucial for maximizing your Airbnb profit potential in Erba.
Seasonal Strategies for Maximizing Profit
- Peak Season: Maximize revenue through premium pricing and potentially longer minimum stays. Ensure high availability.
- Low Season: Offer competitive pricing, special promotions (e.g., extended stay discounts), and flexible cancellation policies. Target off-season travelers like remote workers or budget-conscious guests.
- Shoulder Seasons: Implement dynamic pricing that balances peak and low rates. Target weekend travelers or specific events. Offer slightly more flexible terms than peak season.
- Regularly analyze your own performance against these Erba seasonality benchmarks and adjust your pricing and availability strategy accordingly.
Best Areas for Airbnb Investment in Erba (2025)
Exploring the top neighborhoods for short-term rentals in Erba? This section highlights key areas, outlining why they are attractive for hosts and guests, along with notable local attractions. Consider these locations based on your target guest profile and investment strategy.
| Neighborhood / Area | Why Host Here? (Target Guests & Appeal) | Key Attractions & Landmarks |
|---|---|---|
| Centro Storico | The historic center of Erba is rich in culture and charm, attracting tourists interested in history and architecture. It features beautiful old buildings, shops, and cafes. | San Giovanni Battista Church, Villa Amalia, Erba's medieval streets, local artisan shops, Civic Museum of Erba |
| Civiglio | A picturesque area known for its natural beauty and tranquility, perfect for those seeking a peaceful retreat while being close to city amenities. | Civiglio Lake, hiking trails, green parks, local restaurants |
| Pian del Tivano | Located near the lake, this area caters to tourists looking for outdoor activities such as hiking and mountain biking, making it a popular choice for nature lovers. | Lake Pusiano, hiking paths, scenic views, Caves of Rescia |
| Parco della Brughiera | A serene park area that offers nature lovers a place to relax and enjoy outdoor activities. Great for eco-tourism and escape from urban life. | nature trails, wildlife watching, picnic spots, local flora and fauna |
| Arosio | A surrounding town that offers a more local experience, attracting visitors interested in the Lombard lifestyle and culture, while still being close to Erba. | traditional markets, local festivals, homes with historic architecture, nearby restaurants |
| Rancio Valcuvia | A small locality known for its peaceful environment and proximity to hiking trails, ideal for those looking for a quiet getaway in nature. | natural reserves, hiking trails, traditional Lombardy cuisine, local wineries |
| Castello di Erba | The castle and its surroundings attract tourists interested in local history, architecture, and scenic views, making it a unique spot for Airbnb hosting. | Castle of Erba, historic gardens, panoramic views, local history |
| Montorfano | A beautiful area surrounding Lake Montorfano, perfect for visitors who enjoy water sports, outdoor activities, and scenic landscapes. | Lake Montorfano, swimming, boating, surrounding hills and parks |
Understanding Airbnb License Requirements & STR Laws in Erba (2025)
Yes, Erba, Lombardy, Italy enforces high STR regulations. Obtaining a license and ensuring compliance is almost certainly required according to current 2025 STR laws. Always verify the latest short term rental regulations and Airbnb license requirements directly with local government authorities for Erba to ensure full compliance before hosting.
(Source: AirROI data, 2025, based on 70% licensed listings)
Top Performing Airbnb Properties in Erba (2025)
Benchmark your potential! Explore examples of top-performing Airbnb properties in Erbabased on Trailing Twelve Month (TTM) revenue. Analyze their characteristics, revenue, occupancy rate, and ADR to understand what drives success in this market.
VILLA LE DUE TURRETTE lake Como
Entire Place • 9 bedrooms

Historic Villa Belgiojoso
Entire Place • 5 bedrooms
![[The Como Lakes]](https://a0.muscache.com/im/pictures/hosting/Hosting-1088890672451999027/original/4be8580e-9cfe-44bd-9459-c93a8ef72a0f.jpeg?im_w=480&im_format=avif)
[The Como Lakes]
Entire Place • 3 bedrooms

New cozy apartment city center free parking WiFi
Entire Place • 1 bedroom
Casetta in Contrada
Entire Place • N/A

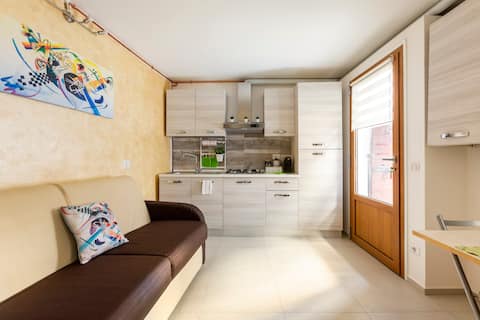
Bilocale Holiday&Work
Entire Place • 1 bedroom
Note: Performance varies based on location, size, amenities, seasonality, and management quality. Data reflects the past 12 months.
Top Performing Airbnb Hosts in Erba (2025)
Learn from the best! This table showcases top-performing Airbnb hosts in Erba based on the number of properties managed and estimated total revenue over the past year. Analyze their scale and performance metrics.
| Host Name | Properties | Grossing Revenue | Stay Reviews | Avg Rating |
|---|---|---|---|---|
| Andrea | 1 | $57,283 | 12 | 4.42/5.0 |
| Marta | 1 | $55,875 | 113 | 4.90/5.0 |
| Paolo | 1 | $42,307 | 28 | 4.93/5.0 |
| Gianluigi | 1 | $30,677 | 25 | 5.00/5.0 |
| Alessandro | 2 | $27,881 | 68 | 4.84/5.0 |
| Manuela | 1 | $19,366 | 24 | 4.92/5.0 |
| Federica | 1 | $18,496 | 57 | 4.91/5.0 |
| Host #43199699 | 2 | $17,170 | 41 | 4.85/5.0 |
| Marco | 1 | $15,001 | 21 | 4.81/5.0 |
| Elisabetta | 1 | $12,680 | 4 | 5.00/5.0 |
Analyzing the strategies of top hosts, such as their property selection, pricing, and guest communication, can offer valuable lessons for optimizing your own Airbnb operations in Erba.
Dive Deeper: Advanced Erba STR Market Data (2025)
Ready to unlock more insights? AirROI provides access to advanced metrics and comprehensive Airbnb data for Erba. Explore detailed analytics beyond this report to refine your investment strategy, optimize pricing, and maximize your vacation rental profits.
Explore Advanced MetricsErba Short-Term Rental Market Composition (2025): Property & Room Types
Room Type Distribution
Property Type Distribution
Market Composition Insights for Erba
- The Erba Airbnb market composition is heavily skewed towards Entire Home/Apt listings, which make up 91.3% of the 23 active rentals. This indicates strong guest preference for privacy and space.
- Looking at the property type distribution in Erba, Apartment/Condo properties are the most common (60.9%), reflecting the local real estate landscape.
- Houses represent a significant 30.4% portion, catering likely to families or larger groups.
- The presence of 8.7% Hotel/Boutique listings indicates integration with traditional hospitality.
Erba Airbnb Room Capacity Analysis (2025): Bedroom Distribution
Distribution of Listings by Number of Bedrooms
Room Capacity Insights for Erba
- The dominant room capacity in Erba is 1 bedroom listings, making up 52.2% of the market. This suggests a strong demand for properties suitable for couples or solo travelers.
- Together, 1 bedroom and 2 bedrooms properties represent 69.6% of the active Airbnb listings in Erba, indicating a high concentration in these sizes.
- With over half the market (52.2%) consisting of studios or 1-bedroom units, Erba is particularly well-suited for individuals or couples.
- A significant 21.7% of listings offer 3+ bedrooms, catering to larger groups and families seeking more space in Erba.
Erba Vacation Rental Guest Capacity Trends (2025)
Distribution of Listings by Guest Capacity
Guest Capacity Insights for Erba
- The most common guest capacity trend in Erba vacation rentals is listings accommodating 4 guests (26.1%). This suggests the primary traveler segment is likely small families or groups.
- Properties designed for 4 guests and 3 guests dominate the Erba STR market, accounting for 47.8% of listings.
- 17.4% of properties accommodate 6+ guests, serving the market segment for larger families or group travel in Erba.
- On average, properties in Erba are equipped to host 4.0 guests.
Erba Airbnb Booking Patterns (2025): Available vs. Booked Days
Available Days Distribution
Booked Days Distribution
Booking Pattern Insights for Erba
- The most common availability pattern in Erba falls within the 271-366 days range, representing 47.8% of listings. This suggests many properties have significant open periods on their calendars.
- Approximately 82.6% of listings show high availability (181+ days open annually), indicating potential for increased bookings or specific owner usage patterns.
- For booked days, the 91-180 days range is most frequent in Erba (43.5%), reflecting common guest stay durations or potential owner blocking patterns.
- A notable 17.4% of properties secure long booking periods (181+ days booked per year), highlighting successful long-term rental strategies or significant owner usage.
Erba Airbnb Minimum Stay Requirements Analysis
Distribution of Listings by Minimum Night Requirement
1 Night
6 listings
28.6% of total
2 Nights
6 listings
28.6% of total
3 Nights
3 listings
14.3% of total
4-6 Nights
2 listings
9.5% of total
7-29 Nights
1 listings
4.8% of total
30+ Nights
3 listings
14.3% of total
Key Insights
- The most prevalent minimum stay requirement in Erba is 1 Night, adopted by 28.6% of listings. This highlights the market's preference for shorter, flexible bookings.
- A significant segment (14.3%) caters to monthly stays (30+ nights) in Erba, pointing to opportunities in the extended-stay market.
Recommendations
- Align with the market by considering a 1 Night minimum stay, as 28.6% of Erba hosts use this setting.
- If feasible, allowing 1-night stays, especially midweek or during low season, could capture last-minute bookings, as only 28.6% currently do.
- Explore offering discounts for stays of 30+ nights to attract the 14.3% of the market seeking extended stays.
- Adjust minimum nights based on seasonality – potentially shorter during low season and longer during peak demand periods in Erba.
Erba Airbnb Cancellation Policy Trends Analysis (2025)
Flexible
8 listings
40% of total
Moderate
8 listings
40% of total
Strict
4 listings
20% of total
Cancellation Policy Insights for Erba
- The prevailing Airbnb cancellation policy trend in Erba is Flexible, used by 40% of listings.
- The market strongly favors guest-friendly terms, with 80.0% of listings offering Flexible or Moderate policies. This suggests guests in Erba may expect booking flexibility.
Recommendations for Hosts
- Consider adopting a Flexible policy to align with the 40% market standard in Erba.
- Regularly review your cancellation policy against competitors and market demand shifts in Erba.
Erba STR Booking Lead Time Analysis (2025)
Average Booking Lead Time by Month
Booking Lead Time Insights for Erba
- The overall average booking lead time for vacation rentals in Erba is 45 days.
- Guests book furthest in advance for stays during June (average 68 days), likely coinciding with peak travel demand or local events.
- The shortest booking windows occur for stays in February (average 15 days), indicating more last-minute travel plans during this time.
- Seasonally, Summer (61 days avg.) sees the longest lead times, while Winter (27 days avg.) has the shortest, reflecting typical travel planning cycles.
Recommendations for Hosts
- Use the overall average lead time (45 days) as a baseline for your pricing and availability strategy in Erba.
- For June stays, consider implementing length-of-stay discounts or slightly higher rates for bookings made less than 68 days out to capitalize on advance planning.
- Target marketing efforts for the Summer season well in advance (at least 61 days) to capture early planners.
- Monitor your own booking lead times against these Erba averages to identify opportunities for dynamic pricing adjustments.
Popular & Essential Airbnb Amenities in Erba (2025)
Amenity Prevalence
Amenity Insights for Erba
- Essential amenities in Erba that guests expect include: Hot water, Heating, TV, Hangers, Hair dryer, Kitchen. Lacking these (any) could significantly impact bookings.
- Popular amenities like Bidet, Essentials, Refrigerator are common but not universal. Offering these can provide a competitive edge.
Recommendations for Hosts
- Ensure your listing includes all essential amenities for Erba: Hot water, Heating, TV, Hangers, Hair dryer, Kitchen.
- Prioritize adding missing essentials: Heating, TV, Hangers, Hair dryer, Kitchen.
- Consider adding popular differentiators like Bidet or Essentials to increase appeal.
- Highlight unique or less common amenities you offer (e.g., hot tub, dedicated workspace, EV charger) in your listing description and photos.
- Regularly check competitor amenities in Erba to stay competitive.
Erba Airbnb Guest Demographics & Profile Analysis (2025)
Guest Profile Summary for Erba
- The typical guest profile for Airbnb in Erba consists of predominantly international visitors (84%), with top international origins including Italy, typically belonging to the Post-2000s (Gen Z/Alpha) group (50%), primarily speaking English or French.
- Domestic travelers account for 16.4% of guests.
- Key international markets include France (28.1%) and Italy (16.4%).
- Top languages spoken are English (37.2%) followed by French (16.2%).
- A significant demographic segment is the Post-2000s (Gen Z/Alpha) group, representing 50% of guests.
Recommendations for Hosts
- Focus marketing internationally, particularly towards travelers from Italy.
- Tailor amenities and listing descriptions to appeal to the dominant Post-2000s (Gen Z/Alpha) demographic (e.g., highlight fast WiFi, smart home features, local guides).
- Highlight unique local experiences or amenities relevant to the primary guest profile.
- Consider seasonal promotions aligned with peak travel times for key origin markets.
Nearby Short-Term Rental Market Comparison
How does the Erba Airbnb market stack up against its neighbors? Compare key performance metrics like average monthly revenue, ADR, and occupancy rates in surrounding areas to understand the broader regional STR landscape.
| Market | Active Properties | Monthly Revenue | Daily Rate | Avg. Occupancy |
|---|---|---|---|---|
| Grindelwald | 489 | $4,921 | $345.40 | 57% |
| Laglio | 64 | $4,873 | $463.61 | 47% |
| Brienz (BE) | 141 | $4,353 | $294.17 | 55% |
| Alpnach | 11 | $4,227 | $234.19 | 49% |
| Brenzone sul Garda | 19 | $4,128 | $335.25 | 52% |
| Portofino | 68 | $4,086 | $454.35 | 44% |
| Sala Comacina | 64 | $3,794 | $400.27 | 50% |
| Sachseln | 15 | $3,742 | $262.18 | 56% |
| Cossano Belbo | 13 | $3,632 | $284.21 | 42% |
| Bellagio | 373 | $3,630 | $328.26 | 55% |