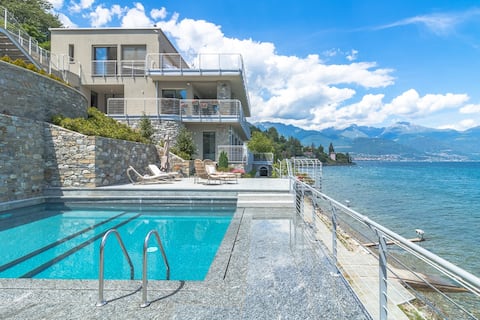
Cremia Airbnb Market Analysis 2025: Short Term Rental Data & Vacation Rental Statistics in Lombardy, Italy
Is Airbnb profitable in Cremia in 2025? Explore comprehensive Airbnb analytics for Cremia, Lombardy, Italy to uncover income potential. This 2025 STR market report for Cremia, based on AirROI data from April 2024 to March 2025, reveals key trends in the niche market of 42 active listings.
Whether you're considering an Airbnb investment in Cremia, optimizing your existing vacation rental, or exploring rental arbitrage opportunities, understanding the Cremia Airbnb data is crucial. Navigating the high regulation landscape is key to maximizing your short term rental income potential. Let's dive into the specifics.
Key Cremia Airbnb Performance Metrics Overview
Monthly Airbnb Revenue Variations & Income Potential in Cremia (2025)
Understanding the monthly revenue variations for Airbnb listings in Cremia is key to maximizing your short term rental income potential. Seasonality significantly impacts earnings. Our analysis, based on data from the past 12 months, shows that the peak revenue month for STRs in Cremia is typically August, while December often presents the lowest earnings, highlighting opportunities for strategic pricing adjustments during shoulder and low seasons. Explore the typical Airbnb income in Cremia across different performance tiers:
- Best-in-class properties (Top 10%) achieve $8,017+ monthly, often utilizing dynamic pricing and superior guest experiences.
- Strong performing properties (Top 25%) earn $3,284 or more, indicating effective management and desirable locations/amenities.
- Typical properties (Median) generate around $1,857 per month, representing the average market performance.
- Entry-level properties (Bottom 25%) see earnings around $1,018, often with potential for optimization.
Average Monthly Airbnb Earnings Trend in Cremia
Cremia Airbnb Occupancy Rate Trends (2025)
Maximize your bookings by understanding the Cremia STR occupancy trends. Seasonal demand shifts significantly influence how often properties are booked. Typically, Augustsees the highest demand (peak season occupancy), while February experiences the lowest (low season). Effective strategies, like adjusting minimum stays or offering promotions, can boost occupancy during slower periods. Here's how different property tiers perform in Cremia:
- Best-in-class properties (Top 10%) achieve 74%+ occupancy, indicating high desirability and potentially optimized availability.
- Strong performing properties (Top 25%) maintain 60% or higher occupancy, suggesting good market fit and guest satisfaction.
- Typical properties (Median) have an occupancy rate around 37%.
- Entry-level properties (Bottom 25%) average 21% occupancy, potentially facing higher vacancy.
Average Monthly Occupancy Rate Trend in Cremia
Average Daily Rate (ADR) Airbnb Trends in Cremia (2025)
Effective short term rental pricing strategy in Cremia involves understanding monthly ADR fluctuations. The Average Daily Rate (ADR) for Airbnb in Cremia typically peaks in July and dips lowest during April. Leveraging Airbnb dynamic pricing tools or strategies based on this seasonality can significantly boost revenue. Here's a look at the typical nightly rates achieved:
- Best-in-class properties (Top 10%) command rates of $302+ per night, often due to premium features or locations.
- Strong performing properties (Top 25%) achieve nightly rates of $242 or more.
- Typical properties (Median) charge around $177 per night.
- Entry-level properties (Bottom 25%) earn around $116 per night.
Average Daily Rate (ADR) Trend by Month in Cremia
Get Live Cremia Market Intelligence 👇

Explore Real-time Analytics
Airbnb Seasonality Analysis & Trends in Cremia (2025)
Peak Season (August, July, June)
- Revenue averages $5,775 per month
- Occupancy rates average 56.9%
- Daily rates average $248
Shoulder Season
- Revenue averages $3,645 per month
- Occupancy maintains around 41.2%
- Daily rates hold near $220
Low Season (February, April, December)
- Revenue drops to average $1,889 per month
- Occupancy decreases to average 25.3%
- Daily rates adjust to average $217
Seasonality Insights for Cremia
- The Airbnb seasonality in Cremia shows highly seasonal trends requiring careful strategy. While the sections above show seasonal averages, it's also insightful to look at the extremes:
- During the high season, the absolute peak month showcases Cremia's highest earning potential, with monthly revenues capable of climbing to $6,035, occupancy reaching a high of 62.4%, and ADRs peaking at $255.
- Conversely, the slowest single month of the year, typically falling within the low season, marks the market's lowest point. In this month, revenue might dip to $1,472, occupancy could drop to 16.7%, and ADRs may adjust down to $207.
- Understanding both the seasonal averages and these monthly peaks and troughs in revenue, occupancy, and ADR is crucial for maximizing your Airbnb profit potential in Cremia.
Seasonal Strategies for Maximizing Profit
- Peak Season: Maximize revenue through premium pricing and potentially longer minimum stays. Ensure high availability.
- Low Season: Offer competitive pricing, special promotions (e.g., extended stay discounts), and flexible cancellation policies. Target off-season travelers like remote workers or budget-conscious guests.
- Shoulder Seasons: Implement dynamic pricing that balances peak and low rates. Target weekend travelers or specific events. Offer slightly more flexible terms than peak season.
- Regularly analyze your own performance against these Cremia seasonality benchmarks and adjust your pricing and availability strategy accordingly.
Best Areas for Airbnb Investment in Cremia (2025)
Exploring the top neighborhoods for short-term rentals in Cremia? This section highlights key areas, outlining why they are attractive for hosts and guests, along with notable local attractions. Consider these locations based on your target guest profile and investment strategy.
| Neighborhood / Area | Why Host Here? (Target Guests & Appeal) | Key Attractions & Landmarks |
|---|---|---|
| Centro Storico | The historic center of Cremia features charming Italian architecture, cobblestone streets, and local culture. Ideal for guests wanting to experience the beauty and history of Lombardy. | Church of San Nicola, Cremia Beach, Castello di Vezio, Museo del Ciclismo, Local village markets |
| Lakeshore | The picturesque lakeshore areas of Cremia offer stunning views of Lake Como. Perfect for those seeking leisure by the lake, water activities, and beautiful sunsets. | Lake Como, Boat rentals, Water sports, Lakeside cafes, Walking trails |
| Valley View | The valley regions offer a serene environment with beautiful landscapes and hiking opportunities. Attracts nature lovers and those looking for peace away from bustling city life. | Hiking trails, Mountain biking, Scenic viewpoints, Picnic areas, Wildlife watching |
| Cremia Waterfront | The waterfront area provides direct access to the lake, with beautiful parks and recreational areas. Suitable for families and individuals looking for outdoor activities. | Waterfront parks, Beach access, Boat tours, Fishing spots, Cycling paths |
| Old Town | Cremia's old town is known for its quaint streets and local shops. Great for tourists looking for authentic Italian experiences and local cuisine. | Local eateries, Artisan shops, Historical landmarks, Cultural festivals, Art galleries |
| Hilltop Retreats | The hilltop areas around Cremia offer breathtaking panoramic views of Lake Como. Suitable for guests seeking tranquility and luxury accommodations. | Panoramic view points, Luxury villas, Wine tasting, Olive oil farms, Nature reserves |
| Cultural District | Known for its rich cultural heritage and local festivals, this area attracts those interested in arts and tradition. | Annual festivals, Musical events, Art exhibitions, Cultural workshops, Historical sites |
| Food and Wine Trail | Cremia is surrounded by rich agricultural land, making it perfect for culinary tourism. Accessible vineyards and farms attract food enthusiasts. | Local wineries, Cheese farms, Cooking classes, Wine tasting tours, Gastronomic events |
Understanding Airbnb License Requirements & STR Laws in Cremia (2025)
Yes, Cremia, Lombardy, Italy enforces high STR regulations. Obtaining a license and ensuring compliance is almost certainly required according to current 2025 STR laws. Always verify the latest short term rental regulations and Airbnb license requirements directly with local government authorities for Cremia to ensure full compliance before hosting.
(Source: AirROI data, 2025, based on 69% licensed listings)
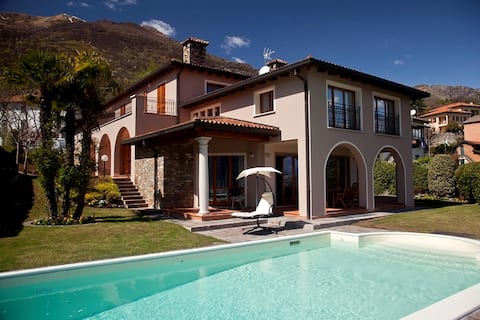
Top Performing Airbnb Properties in Cremia (2025)
Benchmark your potential! Explore examples of top-performing Airbnb properties in Cremiabased on Trailing Twelve Month (TTM) revenue. Analyze their characteristics, revenue, occupancy rate, and ADR to understand what drives success in this market.
Villa Del Sasso - Cremia
Entire Place • 3 bedrooms
PRINCESS VILLA
Entire Place • 7 bedrooms

Panoramic Lake Views at Penthouse di Cremia
Entire Place • 4 bedrooms

Lakeside Villa del Pierangelo
Entire Place • 4 bedrooms
Watch Sunrise in bed, at Casa Clio lake house
Entire Place • 5 bedrooms
Apartment in Cremia Comersee
Entire Place • 2 bedrooms
Note: Performance varies based on location, size, amenities, seasonality, and management quality. Data reflects the past 12 months.
Top Performing Airbnb Hosts in Cremia (2025)
Learn from the best! This table showcases top-performing Airbnb hosts in Cremia based on the number of properties managed and estimated total revenue over the past year. Analyze their scale and performance metrics.
| Host Name | Properties | Grossing Revenue | Stay Reviews | Avg Rating |
|---|---|---|---|---|
| Irina | 3 | $377,711 | 70 | 4.75/5.0 |
| Sandro | 2 | $165,824 | 72 | 4.49/5.0 |
| Leo | 2 | $150,195 | 197 | 4.83/5.0 |
| Alessandro | 1 | $75,093 | 175 | 4.78/5.0 |
| Elisa | 3 | $47,034 | 89 | 4.95/5.0 |
| Mauro | 2 | $44,262 | 70 | 4.89/5.0 |
| Lisa - Interhome Group | 3 | $40,861 | 11 | 4.50/5.0 |
| Giovanni | 1 | $26,352 | 34 | 4.91/5.0 |
| Peter | 1 | $25,963 | 10 | 4.90/5.0 |
| Hans | 1 | $25,917 | 34 | 4.88/5.0 |
Analyzing the strategies of top hosts, such as their property selection, pricing, and guest communication, can offer valuable lessons for optimizing your own Airbnb operations in Cremia.
Dive Deeper: Advanced Cremia STR Market Data (2025)
Ready to unlock more insights? AirROI provides access to advanced metrics and comprehensive Airbnb data for Cremia. Explore detailed analytics beyond this report to refine your investment strategy, optimize pricing, and maximize your vacation rental profits.
Explore Advanced MetricsCremia Short-Term Rental Market Composition (2025): Property & Room Types
Room Type Distribution
Property Type Distribution
Market Composition Insights for Cremia
- The Cremia Airbnb market composition is heavily skewed towards Entire Home/Apt listings, which make up 90.5% of the 42 active rentals. This indicates strong guest preference for privacy and space.
- Looking at the property type distribution in Cremia, House properties are the most common (52.4%), reflecting the local real estate landscape.
- Houses represent a significant 52.4% portion, catering likely to families or larger groups.
- The presence of 7.1% Hotel/Boutique listings indicates integration with traditional hospitality.
Cremia Airbnb Room Capacity Analysis (2025): Bedroom Distribution
Distribution of Listings by Number of Bedrooms
Room Capacity Insights for Cremia
- The dominant room capacity in Cremia is 2 bedrooms listings, making up 52.4% of the market. This suggests a strong demand for properties suitable for couples or solo travelers.
- Together, 2 bedrooms and 1 bedroom properties represent 66.7% of the active Airbnb listings in Cremia, indicating a high concentration in these sizes.
- A significant 26.2% of listings offer 3+ bedrooms, catering to larger groups and families seeking more space in Cremia.
Cremia Vacation Rental Guest Capacity Trends (2025)
Distribution of Listings by Guest Capacity
Guest Capacity Insights for Cremia
- The most common guest capacity trend in Cremia vacation rentals is listings accommodating 4 guests (33.3%). This suggests the primary traveler segment is likely small families or groups.
- Properties designed for 4 guests and 6 guests dominate the Cremia STR market, accounting for 52.3% of listings.
- 38.1% of properties accommodate 6+ guests, serving the market segment for larger families or group travel in Cremia.
- On average, properties in Cremia are equipped to host 4.9 guests.
Cremia Airbnb Booking Patterns (2025): Available vs. Booked Days
Available Days Distribution
Booked Days Distribution
Booking Pattern Insights for Cremia
- The most common availability pattern in Cremia falls within the 271-366 days range, representing 54.8% of listings. This suggests many properties have significant open periods on their calendars.
- Approximately 85.8% of listings show high availability (181+ days open annually), indicating potential for increased bookings or specific owner usage patterns.
- For booked days, the 91-180 days range is most frequent in Cremia (33.3%), reflecting common guest stay durations or potential owner blocking patterns.
- A notable 14.3% of properties secure long booking periods (181+ days booked per year), highlighting successful long-term rental strategies or significant owner usage.
Cremia Airbnb Minimum Stay Requirements Analysis
Distribution of Listings by Minimum Night Requirement
1 Night
10 listings
23.8% of total
2 Nights
10 listings
23.8% of total
3 Nights
9 listings
21.4% of total
4-6 Nights
8 listings
19% of total
30+ Nights
5 listings
11.9% of total
Key Insights
- The most prevalent minimum stay requirement in Cremia is 1 Night, adopted by 23.8% of listings. This highlights the market's preference for shorter, flexible bookings.
- A significant segment (11.9%) caters to monthly stays (30+ nights) in Cremia, pointing to opportunities in the extended-stay market.
Recommendations
- Align with the market by considering a 1 Night minimum stay, as 23.8% of Cremia hosts use this setting.
- If feasible, allowing 1-night stays, especially midweek or during low season, could capture last-minute bookings, as only 23.8% currently do.
- Explore offering discounts for stays of 30+ nights to attract the 11.9% of the market seeking extended stays.
- Adjust minimum nights based on seasonality – potentially shorter during low season and longer during peak demand periods in Cremia.
Cremia Airbnb Cancellation Policy Trends Analysis (2025)
Super Strict 30 Days
9 listings
23.1% of total
Flexible
1 listings
2.6% of total
Moderate
16 listings
41% of total
Strict
13 listings
33.3% of total
Cancellation Policy Insights for Cremia
- The prevailing Airbnb cancellation policy trend in Cremia is Moderate, used by 41% of listings.
- There's a relatively balanced mix between guest-friendly (43.6%) and stricter (33.3%) policies, offering choices for different guest needs.
Recommendations for Hosts
- Consider adopting a Moderate policy to align with the 41% market standard in Cremia.
- With 33.3% using Strict terms, this is a viable option in Cremia, particularly for high-value properties or during peak demand periods.
- Regularly review your cancellation policy against competitors and market demand shifts in Cremia.
Cremia STR Booking Lead Time Analysis (2025)
Average Booking Lead Time by Month
Booking Lead Time Insights for Cremia
- The overall average booking lead time for vacation rentals in Cremia is 85 days.
- Guests book furthest in advance for stays during August (average 129 days), likely coinciding with peak travel demand or local events.
- The shortest booking windows occur for stays in January (average 26 days), indicating more last-minute travel plans during this time.
- Seasonally, Summer (122 days avg.) sees the longest lead times, while Winter (43 days avg.) has the shortest, reflecting typical travel planning cycles.
Recommendations for Hosts
- Use the overall average lead time (85 days) as a baseline for your pricing and availability strategy in Cremia.
- For August stays, consider implementing length-of-stay discounts or slightly higher rates for bookings made less than 129 days out to capitalize on advance planning.
- Target marketing efforts for the Summer season well in advance (at least 122 days) to capture early planners.
- Monitor your own booking lead times against these Cremia averages to identify opportunities for dynamic pricing adjustments.
Popular & Essential Airbnb Amenities in Cremia (2025)
Amenity Prevalence
Amenity Insights for Cremia
- Essential amenities in Cremia that guests expect include: Kitchen. Lacking these (this) could significantly impact bookings.
- Popular amenities like Wifi, TV, Hair dryer are common but not universal. Offering these can provide a competitive edge.
- Warning: Wifi is not universally provided but is considered essential globally. Ensure reliable Wifi is offered.
Recommendations for Hosts
- Ensure your listing includes all essential amenities for Cremia: Kitchen.
- Prioritize adding missing essentials: Kitchen.
- Consider adding popular differentiators like Wifi or TV to increase appeal.
- Highlight unique or less common amenities you offer (e.g., hot tub, dedicated workspace, EV charger) in your listing description and photos.
- Regularly check competitor amenities in Cremia to stay competitive.
Cremia Airbnb Guest Demographics & Profile Analysis (2025)
Guest Profile Summary for Cremia
- The typical guest profile for Airbnb in Cremia consists of predominantly international visitors (98%), with top international origins including France, typically belonging to the Post-2000s (Gen Z/Alpha) group (50%), primarily speaking English or German.
- Domestic travelers account for 1.9% of guests.
- Key international markets include Germany (28.5%) and France (21.5%).
- Top languages spoken are English (38.4%) followed by German (19%).
- A significant demographic segment is the Post-2000s (Gen Z/Alpha) group, representing 50% of guests.
Recommendations for Hosts
- Focus marketing internationally, particularly towards travelers from France.
- Tailor amenities and listing descriptions to appeal to the dominant Post-2000s (Gen Z/Alpha) demographic (e.g., highlight fast WiFi, smart home features, local guides).
- Highlight unique local experiences or amenities relevant to the primary guest profile.
- Consider seasonal promotions aligned with peak travel times for key origin markets.
Nearby Short-Term Rental Market Comparison
How does the Cremia Airbnb market stack up against its neighbors? Compare key performance metrics like average monthly revenue, ADR, and occupancy rates in surrounding areas to understand the broader regional STR landscape.
| Market | Active Properties | Monthly Revenue | Daily Rate | Avg. Occupancy |
|---|---|---|---|---|
| Grindelwald | 489 | $4,921 | $345.40 | 57% |
| Laglio | 64 | $4,873 | $463.61 | 47% |
| Brienz (BE) | 141 | $4,353 | $294.17 | 55% |
| Alpnach | 11 | $4,227 | $234.19 | 49% |
| Vitznau | 29 | $4,171 | $333.53 | 51% |
| Brenzone sul Garda | 19 | $4,128 | $335.25 | 52% |
| Bürserberg | 40 | $3,978 | $342.57 | 41% |
| Lucerne | 371 | $3,870 | $260.48 | 54% |
| Sala Comacina | 64 | $3,794 | $400.27 | 50% |
| Sachseln | 15 | $3,742 | $262.18 | 56% |