Buccinasco Airbnb Market Analysis 2025: Short Term Rental Data & Vacation Rental Statistics in Lombardy, Italy
Is Airbnb profitable in Buccinasco in 2025? Explore comprehensive Airbnb analytics for Buccinasco, Lombardy, Italy to uncover income potential. This 2025 STR market report for Buccinasco, based on AirROI data from April 2024 to March 2025, reveals key trends in the niche market of 26 active listings.
Whether you're considering an Airbnb investment in Buccinasco, optimizing your existing vacation rental, or exploring rental arbitrage opportunities, understanding the Buccinasco Airbnb data is crucial. Navigating the high regulation landscape is key to maximizing your short term rental income potential. Let's dive into the specifics.
Key Buccinasco Airbnb Performance Metrics Overview
Monthly Airbnb Revenue Variations & Income Potential in Buccinasco (2025)
Understanding the monthly revenue variations for Airbnb listings in Buccinasco is key to maximizing your short term rental income potential. Seasonality significantly impacts earnings. Our analysis, based on data from the past 12 months, shows that the peak revenue month for STRs in Buccinasco is typically April, while February often presents the lowest earnings, highlighting opportunities for strategic pricing adjustments during shoulder and low seasons. Explore the typical Airbnb income in Buccinasco across different performance tiers:
- Best-in-class properties (Top 10%) achieve $2,887+ monthly, often utilizing dynamic pricing and superior guest experiences.
- Strong performing properties (Top 25%) earn $2,269 or more, indicating effective management and desirable locations/amenities.
- Typical properties (Median) generate around $1,592 per month, representing the average market performance.
- Entry-level properties (Bottom 25%) see earnings around $825, often with potential for optimization.
Average Monthly Airbnb Earnings Trend in Buccinasco
Buccinasco Airbnb Occupancy Rate Trends (2025)
Maximize your bookings by understanding the Buccinasco STR occupancy trends. Seasonal demand shifts significantly influence how often properties are booked. Typically, Octobersees the highest demand (peak season occupancy), while March experiences the lowest (low season). Effective strategies, like adjusting minimum stays or offering promotions, can boost occupancy during slower periods. Here's how different property tiers perform in Buccinasco:
- Best-in-class properties (Top 10%) achieve 81%+ occupancy, indicating high desirability and potentially optimized availability.
- Strong performing properties (Top 25%) maintain 70% or higher occupancy, suggesting good market fit and guest satisfaction.
- Typical properties (Median) have an occupancy rate around 44%.
- Entry-level properties (Bottom 25%) average 24% occupancy, potentially facing higher vacancy.
Average Monthly Occupancy Rate Trend in Buccinasco
Average Daily Rate (ADR) Airbnb Trends in Buccinasco (2025)
Effective short term rental pricing strategy in Buccinasco involves understanding monthly ADR fluctuations. The Average Daily Rate (ADR) for Airbnb in Buccinasco typically peaks in December and dips lowest during August. Leveraging Airbnb dynamic pricing tools or strategies based on this seasonality can significantly boost revenue. Here's a look at the typical nightly rates achieved:
- Best-in-class properties (Top 10%) command rates of $151+ per night, often due to premium features or locations.
- Strong performing properties (Top 25%) achieve nightly rates of $128 or more.
- Typical properties (Median) charge around $93 per night.
- Entry-level properties (Bottom 25%) earn around $76 per night.
Average Daily Rate (ADR) Trend by Month in Buccinasco
Get Live Buccinasco Market Intelligence 👇

Explore Real-time Analytics
Airbnb Seasonality Analysis & Trends in Buccinasco (2025)
Peak Season (April, May, June)
- Revenue averages $2,297 per month
- Occupancy rates average 49.9%
- Daily rates average $98
Shoulder Season
- Revenue averages $1,684 per month
- Occupancy maintains around 52.5%
- Daily rates hold near $101
Low Season (January, February, March)
- Revenue drops to average $987 per month
- Occupancy decreases to average 33.9%
- Daily rates adjust to average $103
Seasonality Insights for Buccinasco
- The Airbnb seasonality in Buccinasco shows highly seasonal trends requiring careful strategy. While the sections above show seasonal averages, it's also insightful to look at the extremes:
- During the high season, the absolute peak month showcases Buccinasco's highest earning potential, with monthly revenues capable of climbing to $2,409, occupancy reaching a high of 62.1%, and ADRs peaking at $111.
- Conversely, the slowest single month of the year, typically falling within the low season, marks the market's lowest point. In this month, revenue might dip to $819, occupancy could drop to 31.4%, and ADRs may adjust down to $95.
- Understanding both the seasonal averages and these monthly peaks and troughs in revenue, occupancy, and ADR is crucial for maximizing your Airbnb profit potential in Buccinasco.
Seasonal Strategies for Maximizing Profit
- Peak Season: Maximize revenue through premium pricing and potentially longer minimum stays. Ensure high availability.
- Low Season: Offer competitive pricing, special promotions (e.g., extended stay discounts), and flexible cancellation policies. Target off-season travelers like remote workers or budget-conscious guests.
- Shoulder Seasons: Implement dynamic pricing that balances peak and low rates. Target weekend travelers or specific events. Offer slightly more flexible terms than peak season.
- Regularly analyze your own performance against these Buccinasco seasonality benchmarks and adjust your pricing and availability strategy accordingly.
Best Areas for Airbnb Investment in Buccinasco (2025)
Exploring the top neighborhoods for short-term rentals in Buccinasco? This section highlights key areas, outlining why they are attractive for hosts and guests, along with notable local attractions. Consider these locations based on your target guest profile and investment strategy.
| Neighborhood / Area | Why Host Here? (Target Guests & Appeal) | Key Attractions & Landmarks |
|---|---|---|
| Centro Storico | The historic center of Buccinasco offers a blend of culture, history, and local dining experiences. It is a charming area that attracts guests interested in exploring the local Italian lifestyle. | Buccinasco Castle, Piazza San Giovanni, Local trattorias, Art galleries, Historical churches |
| Via XXV Aprile | This area is known for its accessibility and proximity to local amenities, making it appealing for families and business travelers alike. A great location for those who prefer a residential feel with easy access to urban conveniences. | Shopping centers, Parks, Local grocery stores, Cafés, Public transport hubs |
| Navigli | Famous for its canals and vibrant nightlife, the Navigli area is perfect for attracting tourists looking for entertainment and dining. It offers a unique atmosphere that blends history with modern lifestyle. | Navigli Canals, Art studios, Restaurants and bars, Outdoor markets, Cultural events |
| Parco dei Fiori | A peaceful area known for its green spaces and parks. Ideal for families and those looking for a quiet retreat, while still being near the urban center. | Parco dei Fiori, Children's playgrounds, Walking trails, Fitness stations |
| Cascina Moriggia | An attractive residential area that provides a more suburban feel, perfect for guests who prefer tranquility and space, with easy access to the city center. | Local farms, Nature trails, Community events, Farms to table restaurants |
| Corso Italia | A lively area with numerous shops and services, appealing to a diverse range of visitors from shoppers to local culture enthusiasts. | Shopping boutiques, Local festivals, Street food stalls, Cafés |
| Milano Fiori | A modern development area with a mix of residential and commercial spaces. It's a new and evolving area that caters to business travelers visiting the nearby offices and corporations. | Business centers, Shopping malls, Restaurants and bars, Cultural centers |
| Scalo Milano | A popular shopping destination that attracts many visitors for its retail parks and events. It combines modern shopping with a vibrant community atmosphere. | Shopping outlets, Dining areas, Cultural events, Art installations |
Understanding Airbnb License Requirements & STR Laws in Buccinasco (2025)
Yes, Buccinasco, Lombardy, Italy enforces high STR regulations. Obtaining a license and ensuring compliance is almost certainly required according to current 2025 STR laws. Always verify the latest short term rental regulations and Airbnb license requirements directly with local government authorities for Buccinasco to ensure full compliance before hosting.
(Source: AirROI data, 2025, based on 54% licensed listings)
Top Performing Airbnb Properties in Buccinasco (2025)
Benchmark your potential! Explore examples of top-performing Airbnb properties in Buccinascobased on Trailing Twelve Month (TTM) revenue. Analyze their characteristics, revenue, occupancy rate, and ADR to understand what drives success in this market.
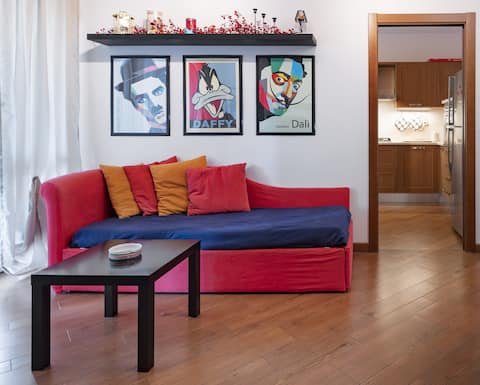
Milano Opi's home with terrace
Entire Place • 1 bedroom
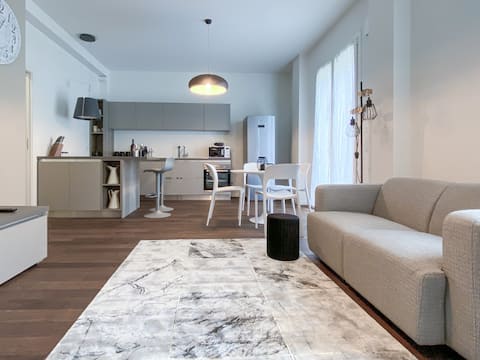
NEW! The Grey Apartment with private garden
Entire Place • 2 bedrooms
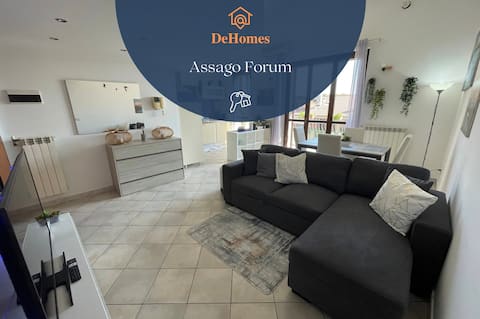
DeHomes - Paganini 8 Assago Forum
Entire Place • 1 bedroom
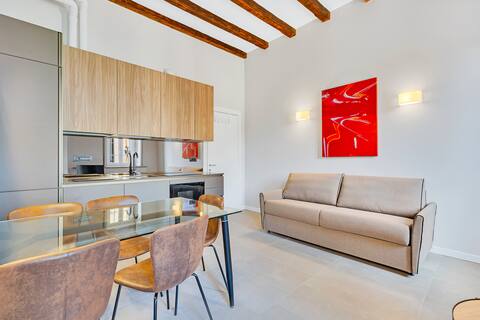
Alessia's Flat-Naviglio Grande14
Entire Place • 2 bedrooms
Alessia's Flat- Naviglio Grande 27
Entire Place • 2 bedrooms

DeHomes - Papa Giovanni XXIII Assago Forum
Entire Place • 2 bedrooms
Note: Performance varies based on location, size, amenities, seasonality, and management quality. Data reflects the past 12 months.
Top Performing Airbnb Hosts in Buccinasco (2025)
Learn from the best! This table showcases top-performing Airbnb hosts in Buccinasco based on the number of properties managed and estimated total revenue over the past year. Analyze their scale and performance metrics.
| Host Name | Properties | Grossing Revenue | Stay Reviews | Avg Rating |
|---|---|---|---|---|
| Alessia'S Flat | 4 | $93,111 | 169 | 4.64/5.0 |
| Host #467650146 | 2 | $49,489 | 20 | 4.07/5.0 |
| Alessandra | 1 | $35,530 | 30 | 4.87/5.0 |
| Giulio | 1 | $34,449 | 18 | 5.00/5.0 |
| YongXia | 3 | $24,904 | 6 | 1.67/5.0 |
| I-Host | 1 | $20,374 | 11 | 4.00/5.0 |
| Ornella | 1 | $19,124 | 31 | 4.90/5.0 |
| Alessandro | 1 | $18,495 | 22 | 5.00/5.0 |
| Simone | 1 | $16,205 | 8 | 3.88/5.0 |
| Federica | 1 | $16,183 | 583 | 4.73/5.0 |
Analyzing the strategies of top hosts, such as their property selection, pricing, and guest communication, can offer valuable lessons for optimizing your own Airbnb operations in Buccinasco.
Dive Deeper: Advanced Buccinasco STR Market Data (2025)
Ready to unlock more insights? AirROI provides access to advanced metrics and comprehensive Airbnb data for Buccinasco. Explore detailed analytics beyond this report to refine your investment strategy, optimize pricing, and maximize your vacation rental profits.
Explore Advanced MetricsBuccinasco Short-Term Rental Market Composition (2025): Property & Room Types
Room Type Distribution
Property Type Distribution
Market Composition Insights for Buccinasco
- The Buccinasco Airbnb market composition is heavily skewed towards Entire Home/Apt listings, which make up 76.9% of the 26 active rentals. This indicates strong guest preference for privacy and space.
- Looking at the property type distribution in Buccinasco, Apartment/Condo properties are the most common (84.6%), reflecting the local real estate landscape.
- The presence of 11.5% Hotel/Boutique listings indicates integration with traditional hospitality.
- Smaller segments like house (combined 3.8%) offer potential for unique stay experiences.
Buccinasco Airbnb Room Capacity Analysis (2025): Bedroom Distribution
Distribution of Listings by Number of Bedrooms
Room Capacity Insights for Buccinasco
- The dominant room capacity in Buccinasco is 1 bedroom listings, making up 61.5% of the market. This suggests a strong demand for properties suitable for couples or solo travelers.
- Together, 1 bedroom and 2 bedrooms properties represent 84.6% of the active Airbnb listings in Buccinasco, indicating a high concentration in these sizes.
- With over half the market (61.5%) consisting of studios or 1-bedroom units, Buccinasco is particularly well-suited for individuals or couples.
Buccinasco Vacation Rental Guest Capacity Trends (2025)
Distribution of Listings by Guest Capacity
Guest Capacity Insights for Buccinasco
- The most common guest capacity trend in Buccinasco vacation rentals is listings accommodating 4 guests (34.6%). This suggests the primary traveler segment is likely small families or groups.
- Properties designed for 4 guests and 2 guests dominate the Buccinasco STR market, accounting for 65.4% of listings.
- 19.2% of properties accommodate 6+ guests, serving the market segment for larger families or group travel in Buccinasco.
- On average, properties in Buccinasco are equipped to host 3.4 guests.
Buccinasco Airbnb Booking Patterns (2025): Available vs. Booked Days
Available Days Distribution
Booked Days Distribution
Booking Pattern Insights for Buccinasco
- The most common availability pattern in Buccinasco falls within the 271-366 days range, representing 38.5% of listings. This suggests many properties have significant open periods on their calendars.
- Approximately 61.6% of listings show high availability (181+ days open annually), indicating potential for increased bookings or specific owner usage patterns.
- For booked days, the 31-90 days range is most frequent in Buccinasco (38.5%), reflecting common guest stay durations or potential owner blocking patterns.
- A notable 42.3% of properties secure long booking periods (181+ days booked per year), highlighting successful long-term rental strategies or significant owner usage.
Buccinasco Airbnb Minimum Stay Requirements Analysis
Distribution of Listings by Minimum Night Requirement
1 Night
5 listings
25% of total
2 Nights
10 listings
50% of total
7-29 Nights
1 listings
5% of total
30+ Nights
4 listings
20% of total
Key Insights
- The most prevalent minimum stay requirement in Buccinasco is 2 Nights, adopted by 50% of listings. This highlights the market's preference for shorter, flexible bookings.
- A strong majority (75.0%) of the Buccinasco Airbnb data shows acceptance of very short stays (1-2 nights), indicating a dynamic, high-turnover market.
- A significant segment (20%) caters to monthly stays (30+ nights) in Buccinasco, pointing to opportunities in the extended-stay market.
Recommendations
- Align with the market by considering a 2 Nights minimum stay, as 50% of Buccinasco hosts use this setting.
- If feasible, allowing 1-night stays, especially midweek or during low season, could capture last-minute bookings, as only 25% currently do.
- Explore offering discounts for stays of 30+ nights to attract the 20% of the market seeking extended stays.
- Adjust minimum nights based on seasonality – potentially shorter during low season and longer during peak demand periods in Buccinasco.
Buccinasco Airbnb Cancellation Policy Trends Analysis (2025)
Flexible
5 listings
31.3% of total
Moderate
10 listings
62.5% of total
Strict
1 listings
6.3% of total
Cancellation Policy Insights for Buccinasco
- The prevailing Airbnb cancellation policy trend in Buccinasco is Moderate, used by 62.5% of listings.
- The market strongly favors guest-friendly terms, with 93.8% of listings offering Flexible or Moderate policies. This suggests guests in Buccinasco may expect booking flexibility.
- Strict cancellation policies are quite rare (6.3%), potentially making listings with this policy less competitive unless justified by high demand or property type.
Recommendations for Hosts
- Consider adopting a Moderate policy to align with the 62.5% market standard in Buccinasco.
- Using a Strict policy might deter some guests, as only 6.3% of listings use it. Evaluate if potential revenue protection outweighs possible lower booking rates.
- Regularly review your cancellation policy against competitors and market demand shifts in Buccinasco.
Buccinasco STR Booking Lead Time Analysis (2025)
Average Booking Lead Time by Month
Booking Lead Time Insights for Buccinasco
- The overall average booking lead time for vacation rentals in Buccinasco is 33 days.
- Guests book furthest in advance for stays during May (average 58 days), likely coinciding with peak travel demand or local events.
- The shortest booking windows occur for stays in October (average 25 days), indicating more last-minute travel plans during this time.
- Seasonally, Spring (46 days avg.) sees the longest lead times, while Fall (33 days avg.) has the shortest, reflecting typical travel planning cycles.
Recommendations for Hosts
- Use the overall average lead time (33 days) as a baseline for your pricing and availability strategy in Buccinasco.
- For May stays, consider implementing length-of-stay discounts or slightly higher rates for bookings made less than 58 days out to capitalize on advance planning.
- Target marketing efforts for the Spring season well in advance (at least 46 days) to capture early planners.
- Monitor your own booking lead times against these Buccinasco averages to identify opportunities for dynamic pricing adjustments.
Popular & Essential Airbnb Amenities in Buccinasco (2025)
Amenity Prevalence
Amenity Insights for Buccinasco
- Essential amenities in Buccinasco that guests expect include: TV, Wifi. Lacking these (any) could significantly impact bookings.
- Popular amenities like Hot water, Heating, Kitchen are common but not universal. Offering these can provide a competitive edge.
Recommendations for Hosts
- Ensure your listing includes all essential amenities for Buccinasco: TV, Wifi.
- Prioritize adding missing essentials: Wifi.
- Consider adding popular differentiators like Hot water or Heating to increase appeal.
- Highlight unique or less common amenities you offer (e.g., hot tub, dedicated workspace, EV charger) in your listing description and photos.
- Regularly check competitor amenities in Buccinasco to stay competitive.
Buccinasco Airbnb Guest Demographics & Profile Analysis (2025)
Guest Profile Summary for Buccinasco
- The typical guest profile for Airbnb in Buccinasco consists of predominantly international visitors (75%), with top international origins including France, typically belonging to the Post-2000s (Gen Z/Alpha) group (50%), primarily speaking English or Italian.
- Domestic travelers account for 25.3% of guests.
- Key international markets include Italy (25.3%) and France (15.4%).
- Top languages spoken are English (37.6%) followed by Italian (12.5%).
- A significant demographic segment is the Post-2000s (Gen Z/Alpha) group, representing 50% of guests.
Recommendations for Hosts
- Focus marketing internationally, particularly towards travelers from France.
- Tailor amenities and listing descriptions to appeal to the dominant Post-2000s (Gen Z/Alpha) demographic (e.g., highlight fast WiFi, smart home features, local guides).
- Highlight unique local experiences or amenities relevant to the primary guest profile.
- Consider seasonal promotions aligned with peak travel times for key origin markets.
Nearby Short-Term Rental Market Comparison
How does the Buccinasco Airbnb market stack up against its neighbors? Compare key performance metrics like average monthly revenue, ADR, and occupancy rates in surrounding areas to understand the broader regional STR landscape.
| Market | Active Properties | Monthly Revenue | Daily Rate | Avg. Occupancy |
|---|---|---|---|---|
| Grindelwald | 489 | $4,921 | $345.40 | 57% |
| Laglio | 64 | $4,873 | $463.61 | 47% |
| Brienz (BE) | 141 | $4,353 | $294.17 | 55% |
| Alpnach | 11 | $4,227 | $234.19 | 49% |
| Brenzone sul Garda | 19 | $4,128 | $335.25 | 52% |
| Portofino | 68 | $4,086 | $454.35 | 44% |
| Sala Comacina | 64 | $3,794 | $400.27 | 50% |
| Sachseln | 15 | $3,742 | $262.18 | 56% |
| Cossano Belbo | 13 | $3,632 | $284.21 | 42% |
| Bellagio | 373 | $3,630 | $328.26 | 55% |