Bellagio Airbnb Market Analysis 2025: Short Term Rental Data & Vacation Rental Statistics in Lombardy, Italy
Is Airbnb profitable in Bellagio in 2025? Explore comprehensive Airbnb analytics for Bellagio, Lombardy, Italy to uncover income potential. This 2025 STR market report for Bellagio, based on AirROI data from April 2024 to March 2025, reveals key trends in the market of 373 active listings.
Whether you're considering an Airbnb investment in Bellagio, optimizing your existing vacation rental, or exploring rental arbitrage opportunities, understanding the Bellagio Airbnb data is crucial. Navigating the high regulation landscape is key to maximizing your short term rental income potential. Let's dive into the specifics.
Key Bellagio Airbnb Performance Metrics Overview
Monthly Airbnb Revenue Variations & Income Potential in Bellagio (2025)
Understanding the monthly revenue variations for Airbnb listings in Bellagio is key to maximizing your short term rental income potential. Seasonality significantly impacts earnings. Our analysis, based on data from the past 12 months, shows that the peak revenue month for STRs in Bellagio is typically August, while February often presents the lowest earnings, highlighting opportunities for strategic pricing adjustments during shoulder and low seasons. Explore the typical Airbnb income in Bellagio across different performance tiers:
- Best-in-class properties (Top 10%) achieve $8,962+ monthly, often utilizing dynamic pricing and superior guest experiences.
- Strong performing properties (Top 25%) earn $5,264 or more, indicating effective management and desirable locations/amenities.
- Typical properties (Median) generate around $3,151 per month, representing the average market performance.
- Entry-level properties (Bottom 25%) see earnings around $1,893, often with potential for optimization.
Average Monthly Airbnb Earnings Trend in Bellagio
Bellagio Airbnb Occupancy Rate Trends (2025)
Maximize your bookings by understanding the Bellagio STR occupancy trends. Seasonal demand shifts significantly influence how often properties are booked. Typically, Augustsees the highest demand (peak season occupancy), while February experiences the lowest (low season). Effective strategies, like adjusting minimum stays or offering promotions, can boost occupancy during slower periods. Here's how different property tiers perform in Bellagio:
- Best-in-class properties (Top 10%) achieve 81%+ occupancy, indicating high desirability and potentially optimized availability.
- Strong performing properties (Top 25%) maintain 64% or higher occupancy, suggesting good market fit and guest satisfaction.
- Typical properties (Median) have an occupancy rate around 47%.
- Entry-level properties (Bottom 25%) average 30% occupancy, potentially facing higher vacancy.
Average Monthly Occupancy Rate Trend in Bellagio
Average Daily Rate (ADR) Airbnb Trends in Bellagio (2025)
Effective short term rental pricing strategy in Bellagio involves understanding monthly ADR fluctuations. The Average Daily Rate (ADR) for Airbnb in Bellagio typically peaks in August and dips lowest during March. Leveraging Airbnb dynamic pricing tools or strategies based on this seasonality can significantly boost revenue. Here's a look at the typical nightly rates achieved:
- Best-in-class properties (Top 10%) command rates of $571+ per night, often due to premium features or locations.
- Strong performing properties (Top 25%) achieve nightly rates of $331 or more.
- Typical properties (Median) charge around $211 per night.
- Entry-level properties (Bottom 25%) earn around $153 per night.
Average Daily Rate (ADR) Trend by Month in Bellagio
Get Live Bellagio Market Intelligence 👇

Explore Real-time Analytics
Airbnb Seasonality Analysis & Trends in Bellagio (2025)
Peak Season (August, July, June)
- Revenue averages $7,366 per month
- Occupancy rates average 71.2%
- Daily rates average $352
Shoulder Season
- Revenue averages $4,516 per month
- Occupancy maintains around 47.4%
- Daily rates hold near $329
Low Season (January, February, March)
- Revenue drops to average $1,610 per month
- Occupancy decreases to average 23.4%
- Daily rates adjust to average $303
Seasonality Insights for Bellagio
- The Airbnb seasonality in Bellagio shows highly seasonal trends requiring careful strategy. While the sections above show seasonal averages, it's also insightful to look at the extremes:
- During the high season, the absolute peak month showcases Bellagio's highest earning potential, with monthly revenues capable of climbing to $7,481, occupancy reaching a high of 74.5%, and ADRs peaking at $355.
- Conversely, the slowest single month of the year, typically falling within the low season, marks the market's lowest point. In this month, revenue might dip to $1,312, occupancy could drop to 21.6%, and ADRs may adjust down to $300.
- Understanding both the seasonal averages and these monthly peaks and troughs in revenue, occupancy, and ADR is crucial for maximizing your Airbnb profit potential in Bellagio.
Seasonal Strategies for Maximizing Profit
- Peak Season: Maximize revenue through premium pricing and potentially longer minimum stays. Ensure high availability.
- Low Season: Offer competitive pricing, special promotions (e.g., extended stay discounts), and flexible cancellation policies. Target off-season travelers like remote workers or budget-conscious guests.
- Shoulder Seasons: Implement dynamic pricing that balances peak and low rates. Target weekend travelers or specific events. Offer slightly more flexible terms than peak season.
- Regularly analyze your own performance against these Bellagio seasonality benchmarks and adjust your pricing and availability strategy accordingly.
Best Areas for Airbnb Investment in Bellagio (2025)
Exploring the top neighborhoods for short-term rentals in Bellagio? This section highlights key areas, outlining why they are attractive for hosts and guests, along with notable local attractions. Consider these locations based on your target guest profile and investment strategy.
| Neighborhood / Area | Why Host Here? (Target Guests & Appeal) | Key Attractions & Landmarks |
|---|---|---|
| Centro Storico | The historic center of Bellagio offers stunning views of the lake and is rich with history. It's a popular area among tourists who want to explore charming streets and local shops. | Piazza della Chiesa, Villa Melzi, Garden of Villa Melzi, Basilica di San Giacomo, Bellagio Ferry Terminal |
| Lakefront Promenade | This prime location along the lake is perfect for those seeking picturesque views and easy access to waterfront activities. It's ideal for guests who want a relaxing holiday by the water. | Lakeside Walks, Boat Rentals, Fishing Spots, Beach Areas, Scenic Views of Varenna |
| Pescallo | A quiet, charming fishing village that’s just a short walk from Bellagio's main attractions. It offers a peaceful atmosphere, which appeals to couples and families looking for tranquility. | Pescallo Beach, Fishing Village Charm, Walking Trails, Cafe del Porto, Scenic Sunsets |
| San Giovanni | This residential area offers a more local experience, with easy access to the amenities of Bellagio and a family-friendly environment. Ideal for longer stays and lower costs. | Local Markets, Cafes and Restaurants, Parks for Children, Ferry Access, Hiking Trails |
| Riva di Bellagio | Located along the eastern shore of Bellagio, this area is perfect for those looking to engage in outdoor activities such as hiking and biking, while enjoying stunning lake views. | Hiking Trails, Riva Beach, Picnic Areas, Zinola Beach, Nature Reserves |
| Via Roma | A vibrant street filled with shops, restaurants, and cafes. It's a bustling area that offers a lively atmosphere and is perfect for guests who enjoy being in the heart of the action. | Shopping and Dining, Artisans' Workshops, Historical Buildings, Cafes, Gelato Shops |
| Lecco Road | This area offers great access to transportation and is close to both Bellagio and Lecco. It’s ideal for guests who wish to explore wider Lombardy while staying close to Bellagio. | Lecco Lake Access, Historic Sites, Camping Areas, Local Vineyards, Cultural Tours |
| Albano | A picturesque village near Bellagio that appeals to those looking for a quiet retreat. Ideal for guests who love nature and hiking, with breathtaking views and tranquility. | Hiking Trails, Natural Reserves, Wine Tasting Tours, Local Craft Shops, Artistic Workshops |
Understanding Airbnb License Requirements & STR Laws in Bellagio (2025)
Yes, Bellagio, Lombardy, Italy enforces high STR regulations. Obtaining a license and ensuring compliance is almost certainly required according to current 2025 STR laws. Always verify the latest short term rental regulations and Airbnb license requirements directly with local government authorities for Bellagio to ensure full compliance before hosting.
(Source: AirROI data, 2025, based on 77% licensed listings)
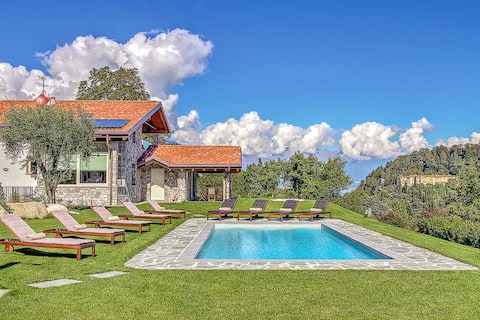
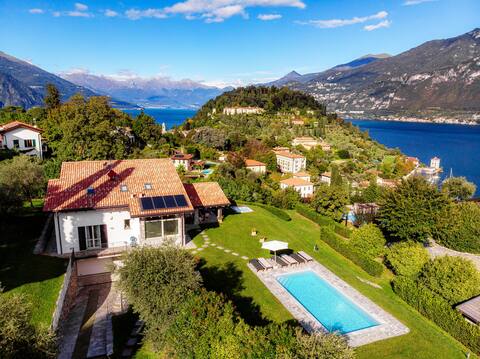
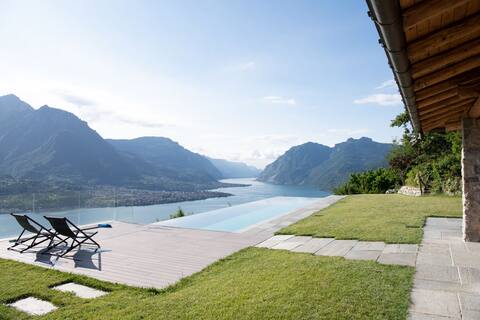
Top Performing Airbnb Properties in Bellagio (2025)
Benchmark your potential! Explore examples of top-performing Airbnb properties in Bellagiobased on Trailing Twelve Month (TTM) revenue. Analyze their characteristics, revenue, occupancy rate, and ADR to understand what drives success in this market.
Villa Sissi
Entire Place • 4 bedrooms
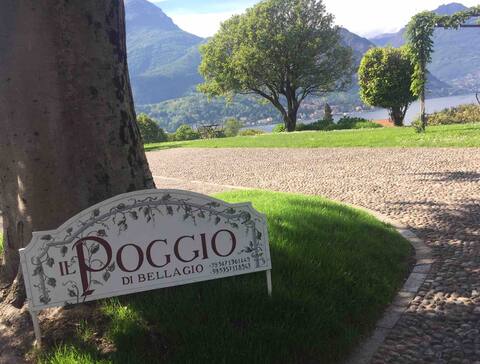
Il Poggio di Bellagio
Entire Place • 5 bedrooms
Villa Sissi
Entire Place • 5 bedrooms
Bellagio - Villa with pool
Entire Place • 4 bedrooms
Villa Lilla Bellagio | Luxury Pool&Wine Lake View
Entire Place • 3 bedrooms
Villa Breva - Bellagio new owner page
Entire Place • 5 bedrooms
Note: Performance varies based on location, size, amenities, seasonality, and management quality. Data reflects the past 12 months.
Top Performing Airbnb Hosts in Bellagio (2025)
Learn from the best! This table showcases top-performing Airbnb hosts in Bellagio based on the number of properties managed and estimated total revenue over the past year. Analyze their scale and performance metrics.
| Host Name | Properties | Grossing Revenue | Stay Reviews | Avg Rating |
|---|---|---|---|---|
| Francesca | 7 | $505,726 | 1024 | 4.69/5.0 |
| KlabHouse | 5 | $471,187 | 440 | 4.90/5.0 |
| Francesca | 8 | $454,086 | 1871 | 4.79/5.0 |
| Martina | 2 | $355,753 | 279 | 4.95/5.0 |
| IC Bellagio | 1 | $348,212 | 14 | 5.00/5.0 |
| Francesca | 1 | $343,927 | 28 | 5.00/5.0 |
| Giuliano | 1 | $289,075 | 15 | 4.53/5.0 |
| Alessandro | 5 | $282,065 | 99 | 4.90/5.0 |
| Gilberto | 5 | $266,165 | 411 | 4.90/5.0 |
| Eugenia | 1 | $260,164 | 34 | 4.97/5.0 |
Analyzing the strategies of top hosts, such as their property selection, pricing, and guest communication, can offer valuable lessons for optimizing your own Airbnb operations in Bellagio.
Dive Deeper: Advanced Bellagio STR Market Data (2025)
Ready to unlock more insights? AirROI provides access to advanced metrics and comprehensive Airbnb data for Bellagio. Explore detailed analytics beyond this report to refine your investment strategy, optimize pricing, and maximize your vacation rental profits.
Explore Advanced MetricsBellagio Short-Term Rental Market Composition (2025): Property & Room Types
Room Type Distribution
Property Type Distribution
Market Composition Insights for Bellagio
- The Bellagio Airbnb market composition is heavily skewed towards Entire Home/Apt listings, which make up 95.2% of the 373 active rentals. This indicates strong guest preference for privacy and space.
- Looking at the property type distribution in Bellagio, Apartment/Condo properties are the most common (74%), reflecting the local real estate landscape.
- Houses represent a significant 21.7% portion, catering likely to families or larger groups.
- Smaller segments like hotel/boutique, others (combined 4.3%) offer potential for unique stay experiences.
Bellagio Airbnb Room Capacity Analysis (2025): Bedroom Distribution
Distribution of Listings by Number of Bedrooms
Room Capacity Insights for Bellagio
- The dominant room capacity in Bellagio is 1 bedroom listings, making up 48.3% of the market. This suggests a strong demand for properties suitable for couples or solo travelers.
- Together, 1 bedroom and 2 bedrooms properties represent 82.1% of the active Airbnb listings in Bellagio, indicating a high concentration in these sizes.
Bellagio Vacation Rental Guest Capacity Trends (2025)
Distribution of Listings by Guest Capacity
Guest Capacity Insights for Bellagio
- The most common guest capacity trend in Bellagio vacation rentals is listings accommodating 4 guests (39.7%). This suggests the primary traveler segment is likely small families or groups.
- Properties designed for 4 guests and 2 guests dominate the Bellagio STR market, accounting for 61.4% of listings.
- 20.9% of properties accommodate 6+ guests, serving the market segment for larger families or group travel in Bellagio.
- On average, properties in Bellagio are equipped to host 4.0 guests.
Bellagio Airbnb Booking Patterns (2025): Available vs. Booked Days
Available Days Distribution
Booked Days Distribution
Booking Pattern Insights for Bellagio
- The most common availability pattern in Bellagio falls within the 181-270 days range, representing 48.8% of listings. This suggests many properties have significant open periods on their calendars.
- Approximately 71.6% of listings show high availability (181+ days open annually), indicating potential for increased bookings or specific owner usage patterns.
- For booked days, the 91-180 days range is most frequent in Bellagio (47.2%), reflecting common guest stay durations or potential owner blocking patterns.
- A notable 30.8% of properties secure long booking periods (181+ days booked per year), highlighting successful long-term rental strategies or significant owner usage.
Bellagio Airbnb Minimum Stay Requirements Analysis
Distribution of Listings by Minimum Night Requirement
1 Night
31 listings
8.8% of total
2 Nights
97 listings
27.6% of total
3 Nights
109 listings
31.1% of total
4-6 Nights
26 listings
7.4% of total
7-29 Nights
20 listings
5.7% of total
30+ Nights
68 listings
19.4% of total
Key Insights
- The most prevalent minimum stay requirement in Bellagio is 3 Nights, adopted by 31.1% of listings. This highlights the market's preference for longer commitments.
- A significant segment (19.4%) caters to monthly stays (30+ nights) in Bellagio, pointing to opportunities in the extended-stay market.
Recommendations
- Align with the market by considering a 3 Nights minimum stay, as 31.1% of Bellagio hosts use this setting.
- If feasible, allowing 1-night stays, especially midweek or during low season, could capture last-minute bookings, as only 8.8% currently do.
- Explore offering discounts for stays of 30+ nights to attract the 19.4% of the market seeking extended stays.
- Adjust minimum nights based on seasonality – potentially shorter during low season and longer during peak demand periods in Bellagio.
Bellagio Airbnb Cancellation Policy Trends Analysis (2025)
Super Strict 60 Days
5 listings
1.5% of total
Super Strict 30 Days
12 listings
3.6% of total
Flexible
65 listings
19.5% of total
Moderate
159 listings
47.7% of total
Strict
92 listings
27.6% of total
Cancellation Policy Insights for Bellagio
- The prevailing Airbnb cancellation policy trend in Bellagio is Moderate, used by 47.7% of listings.
- There's a relatively balanced mix between guest-friendly (67.2%) and stricter (27.6%) policies, offering choices for different guest needs.
Recommendations for Hosts
- Consider adopting a Moderate policy to align with the 47.7% market standard in Bellagio.
- Regularly review your cancellation policy against competitors and market demand shifts in Bellagio.
Bellagio STR Booking Lead Time Analysis (2025)
Average Booking Lead Time by Month
Booking Lead Time Insights for Bellagio
- The overall average booking lead time for vacation rentals in Bellagio is 78 days.
- Guests book furthest in advance for stays during July (average 120 days), likely coinciding with peak travel demand or local events.
- The shortest booking windows occur for stays in March (average 42 days), indicating more last-minute travel plans during this time.
- Seasonally, Summer (112 days avg.) sees the longest lead times, while Winter (49 days avg.) has the shortest, reflecting typical travel planning cycles.
Recommendations for Hosts
- Use the overall average lead time (78 days) as a baseline for your pricing and availability strategy in Bellagio.
- For July stays, consider implementing length-of-stay discounts or slightly higher rates for bookings made less than 120 days out to capitalize on advance planning.
- Target marketing efforts for the Summer season well in advance (at least 112 days) to capture early planners.
- Monitor your own booking lead times against these Bellagio averages to identify opportunities for dynamic pricing adjustments.
Popular & Essential Airbnb Amenities in Bellagio (2025)
Amenity Prevalence
Amenity Insights for Bellagio
- Essential amenities in Bellagio that guests expect include: Wifi, Heating, Kitchen, Essentials. Lacking these (any) could significantly impact bookings.
- Popular amenities like Hair dryer, Hot water, TV are common but not universal. Offering these can provide a competitive edge.
Recommendations for Hosts
- Ensure your listing includes all essential amenities for Bellagio: Wifi, Heating, Kitchen, Essentials.
- Prioritize adding missing essentials: Wifi, Heating, Kitchen, Essentials.
- Consider adding popular differentiators like Hair dryer or Hot water to increase appeal.
- Highlight unique or less common amenities you offer (e.g., hot tub, dedicated workspace, EV charger) in your listing description and photos.
- Regularly check competitor amenities in Bellagio to stay competitive.
Bellagio Airbnb Guest Demographics & Profile Analysis (2025)
Guest Profile Summary for Bellagio
- The typical guest profile for Airbnb in Bellagio consists of predominantly international visitors (99%), with top international origins including United Kingdom, typically belonging to the Post-2000s (Gen Z/Alpha) group (50%), primarily speaking English or French.
- Domestic travelers account for 0.9% of guests.
- Key international markets include United States (45.4%) and United Kingdom (13.9%).
- Top languages spoken are English (57%) followed by French (8.6%).
- A significant demographic segment is the Post-2000s (Gen Z/Alpha) group, representing 50% of guests.
Recommendations for Hosts
- Focus marketing internationally, particularly towards travelers from United Kingdom.
- Tailor amenities and listing descriptions to appeal to the dominant Post-2000s (Gen Z/Alpha) demographic (e.g., highlight fast WiFi, smart home features, local guides).
- Highlight unique local experiences or amenities relevant to the primary guest profile.
- Consider seasonal promotions aligned with peak travel times for key origin markets.
Nearby Short-Term Rental Market Comparison
How does the Bellagio Airbnb market stack up against its neighbors? Compare key performance metrics like average monthly revenue, ADR, and occupancy rates in surrounding areas to understand the broader regional STR landscape.
| Market | Active Properties | Monthly Revenue | Daily Rate | Avg. Occupancy |
|---|---|---|---|---|
| Grindelwald | 489 | $4,921 | $345.40 | 57% |
| Laglio | 64 | $4,873 | $463.61 | 47% |
| Brienz (BE) | 141 | $4,353 | $294.17 | 55% |
| Alpnach | 11 | $4,227 | $234.19 | 49% |
| Brenzone sul Garda | 19 | $4,128 | $335.25 | 52% |
| Portofino | 68 | $4,086 | $454.35 | 44% |
| Sala Comacina | 64 | $3,794 | $400.27 | 50% |
| Sachseln | 15 | $3,742 | $262.18 | 56% |
| Cossano Belbo | 13 | $3,632 | $284.21 | 42% |
| Meiringen | 61 | $3,550 | $256.12 | 52% |