Aprica Airbnb Market Analysis 2025: Short Term Rental Data & Vacation Rental Statistics in Lombardy, Italy
Is Airbnb profitable in Aprica in 2025? Explore comprehensive Airbnb analytics for Aprica, Lombardy, Italy to uncover income potential. This 2025 STR market report for Aprica, based on AirROI data from April 2024 to March 2025, reveals key trends in the niche market of 68 active listings.
Whether you're considering an Airbnb investment in Aprica, optimizing your existing vacation rental, or exploring rental arbitrage opportunities, understanding the Aprica Airbnb data is crucial. Navigating the high regulation landscape is key to maximizing your short term rental income potential. Let's dive into the specifics.
Key Aprica Airbnb Performance Metrics Overview
Monthly Airbnb Revenue Variations & Income Potential in Aprica (2025)
Understanding the monthly revenue variations for Airbnb listings in Aprica is key to maximizing your short term rental income potential. Seasonality significantly impacts earnings. Our analysis, based on data from the past 12 months, shows that the peak revenue month for STRs in Aprica is typically February, while November often presents the lowest earnings, highlighting opportunities for strategic pricing adjustments during shoulder and low seasons. Explore the typical Airbnb income in Aprica across different performance tiers:
- Best-in-class properties (Top 10%) achieve $3,323+ monthly, often utilizing dynamic pricing and superior guest experiences.
- Strong performing properties (Top 25%) earn $2,150 or more, indicating effective management and desirable locations/amenities.
- Typical properties (Median) generate around $1,013 per month, representing the average market performance.
- Entry-level properties (Bottom 25%) see earnings around $514, often with potential for optimization.
Average Monthly Airbnb Earnings Trend in Aprica
Aprica Airbnb Occupancy Rate Trends (2025)
Maximize your bookings by understanding the Aprica STR occupancy trends. Seasonal demand shifts significantly influence how often properties are booked. Typically, Augustsees the highest demand (peak season occupancy), while June experiences the lowest (low season). Effective strategies, like adjusting minimum stays or offering promotions, can boost occupancy during slower periods. Here's how different property tiers perform in Aprica:
- Best-in-class properties (Top 10%) achieve 55%+ occupancy, indicating high desirability and potentially optimized availability.
- Strong performing properties (Top 25%) maintain 40% or higher occupancy, suggesting good market fit and guest satisfaction.
- Typical properties (Median) have an occupancy rate around 24%.
- Entry-level properties (Bottom 25%) average 11% occupancy, potentially facing higher vacancy.
Average Monthly Occupancy Rate Trend in Aprica
Average Daily Rate (ADR) Airbnb Trends in Aprica (2025)
Effective short term rental pricing strategy in Aprica involves understanding monthly ADR fluctuations. The Average Daily Rate (ADR) for Airbnb in Aprica typically peaks in December and dips lowest during November. Leveraging Airbnb dynamic pricing tools or strategies based on this seasonality can significantly boost revenue. Here's a look at the typical nightly rates achieved:
- Best-in-class properties (Top 10%) command rates of $216+ per night, often due to premium features or locations.
- Strong performing properties (Top 25%) achieve nightly rates of $163 or more.
- Typical properties (Median) charge around $127 per night.
- Entry-level properties (Bottom 25%) earn around $96 per night.
Average Daily Rate (ADR) Trend by Month in Aprica
Get Live Aprica Market Intelligence 👇

Explore Real-time Analytics
Airbnb Seasonality Analysis & Trends in Aprica (2025)
Peak Season (February, August, April)
- Revenue averages $2,215 per month
- Occupancy rates average 40.8%
- Daily rates average $151
Shoulder Season
- Revenue averages $1,463 per month
- Occupancy maintains around 25.5%
- Daily rates hold near $152
Low Season (September, October, November)
- Revenue drops to average $793 per month
- Occupancy decreases to average 20.5%
- Daily rates adjust to average $135
Seasonality Insights for Aprica
- The Airbnb seasonality in Aprica shows highly seasonal trends requiring careful strategy. While the sections above show seasonal averages, it's also insightful to look at the extremes:
- During the high season, the absolute peak month showcases Aprica's highest earning potential, with monthly revenues capable of climbing to $2,380, occupancy reaching a high of 57.1%, and ADRs peaking at $165.
- Conversely, the slowest single month of the year, typically falling within the low season, marks the market's lowest point. In this month, revenue might dip to $751, occupancy could drop to 14.4%, and ADRs may adjust down to $128.
- Understanding both the seasonal averages and these monthly peaks and troughs in revenue, occupancy, and ADR is crucial for maximizing your Airbnb profit potential in Aprica.
Seasonal Strategies for Maximizing Profit
- Peak Season: Maximize revenue through premium pricing and potentially longer minimum stays. Ensure high availability.
- Low Season: Offer competitive pricing, special promotions (e.g., extended stay discounts), and flexible cancellation policies. Target off-season travelers like remote workers or budget-conscious guests.
- Shoulder Seasons: Implement dynamic pricing that balances peak and low rates. Target weekend travelers or specific events. Offer slightly more flexible terms than peak season.
- Regularly analyze your own performance against these Aprica seasonality benchmarks and adjust your pricing and availability strategy accordingly.
Best Areas for Airbnb Investment in Aprica (2025)
Exploring the top neighborhoods for short-term rentals in Aprica? This section highlights key areas, outlining why they are attractive for hosts and guests, along with notable local attractions. Consider these locations based on your target guest profile and investment strategy.
| Neighborhood / Area | Why Host Here? (Target Guests & Appeal) | Key Attractions & Landmarks |
|---|---|---|
| Aprica Centro | The heart of Aprica, close to shops, restaurants, and the main ski lifts. Ideal for tourists looking to enjoy both the ski slopes in winter and vibrant village life in summer. | Aprica Ski Area, Ponte di Aprica, Parco delle Orobie, Chiesa di San Giovanni Battista, Local restaurants and cafés |
| Palabione | Known for its ski facilities and proximity to the ski slopes, Palabione attracts winter sports enthusiasts and families looking for active holidays. | Palabione Ski Lift, Baradello Ski Lift, Aprica Ski Area, Ski schools, Local hotels and lodges |
| Stabilimento Balneare | A beautiful beach area by the lake, perfect for summer retreats and water sports, drawing in tourists looking for relaxation and nature. | Lake Como, Beach access, Water sports rentals, Local picnic areas, Scenic hiking trails |
| Montecampione | Not far from Aprica, Montecampione offers excellent skiing and stunning mountain views, appealing to adventure seekers and outdoor lovers. | Montecampione Ski Resort, Hiking trails, Mountain biking paths, Scenic views, Ski schools |
| Valtellina | A charming valley known for its wines and cuisine, Valtellina is perfect for tourists interested in local gastronomy and natural beauty throughout the year. | Wine tasting tours, Local restaurants, Scenic landscapes, Hiking trails, Cultural sites |
| Teglio | Famous for its pizzoccheri (local dish) and Alpine scenery, Teglio attracts culinary enthusiasts and those interested in cultural experiences. | Pizzoccheri restaurants, Historical sites, Scenic viewpoints, Hiking paths, Local festivals |
| Bormio | A bit further but within reach, Bormio is well-known for its spa resorts and ski facilities, popular with both wellness seekers and winter sports fans. | Bormio Ski Area, Thermal baths, Bormio town, Historical sites, Outdoor activities |
| Livigno | Another great location nearby, Livigno is a famous ski resort and tax-free zone, appealing to both skiers and shoppers looking for deals. | Livigno Ski Area, Shopping outlets, Nightlife, Italian Alps views, Outdoor activities |
Understanding Airbnb License Requirements & STR Laws in Aprica (2025)
Yes, Aprica, Lombardy, Italy enforces high STR regulations. Obtaining a license and ensuring compliance is almost certainly required according to current 2025 STR laws. Always verify the latest short term rental regulations and Airbnb license requirements directly with local government authorities for Aprica to ensure full compliance before hosting.
(Source: AirROI data, 2025, based on 46% licensed listings)
Top Performing Airbnb Properties in Aprica (2025)
Benchmark your potential! Explore examples of top-performing Airbnb properties in Apricabased on Trailing Twelve Month (TTM) revenue. Analyze their characteristics, revenue, occupancy rate, and ADR to understand what drives success in this market.
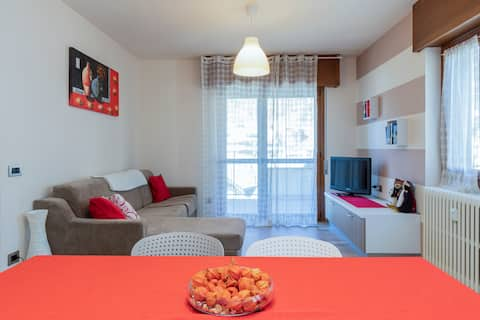
![La casa di Gloriana [500 metres from slopes]](https://a0.muscache.com/im/pictures/miso/Hosting-1051435435893349183/original/2dd81d1d-9e78-419f-8505-34207877f064.jpeg?im_w=480&im_format=avif)
La casa di Gloriana [500 metres from slopes]
Entire Place • 3 bedrooms
Aprica tra sport e divertimento
Entire Place • 2 bedrooms
Trilocale nel centro di Aprica
Entire Place • 2 bedrooms
Comodo appartamento sulle piste!
Entire Place • 2 bedrooms
Europe - renovated new - nearby slopes
Entire Place • 2 bedrooms
Three-room Super Panoramic in Aprica Centro
Entire Place • 2 bedrooms
Note: Performance varies based on location, size, amenities, seasonality, and management quality. Data reflects the past 12 months.
Top Performing Airbnb Hosts in Aprica (2025)
Learn from the best! This table showcases top-performing Airbnb hosts in Aprica based on the number of properties managed and estimated total revenue over the past year. Analyze their scale and performance metrics.
| Host Name | Properties | Grossing Revenue | Stay Reviews | Avg Rating |
|---|---|---|---|---|
| Master Guest | 4 | $52,155 | 25 | 3.23/5.0 |
| Master Guest | 3 | $51,219 | 28 | 4.40/5.0 |
| Davide | 1 | $47,322 | 26 | 4.88/5.0 |
| Host #393811744 | 6 | $42,920 | 4 | 0.00/5.0 |
| Host #514074713 | 1 | $32,239 | 1 | 0.00/5.0 |
| Raffaella | 3 | $27,552 | 20 | 3.16/5.0 |
| Host #403701290 | 1 | $26,762 | 1 | 0.00/5.0 |
| Host #34432779 | 1 | $21,279 | 9 | 4.67/5.0 |
| Paolo | 1 | $19,922 | 20 | 4.75/5.0 |
| Marco | 1 | $18,963 | 8 | 4.88/5.0 |
Analyzing the strategies of top hosts, such as their property selection, pricing, and guest communication, can offer valuable lessons for optimizing your own Airbnb operations in Aprica.
Dive Deeper: Advanced Aprica STR Market Data (2025)
Ready to unlock more insights? AirROI provides access to advanced metrics and comprehensive Airbnb data for Aprica. Explore detailed analytics beyond this report to refine your investment strategy, optimize pricing, and maximize your vacation rental profits.
Explore Advanced MetricsAprica Short-Term Rental Market Composition (2025): Property & Room Types
Room Type Distribution
Property Type Distribution
Market Composition Insights for Aprica
- The Aprica Airbnb market composition is heavily skewed towards Entire Home/Apt listings, which make up 100% of the 68 active rentals. This indicates strong guest preference for privacy and space.
- Looking at the property type distribution in Aprica, Apartment/Condo properties are the most common (85.3%), reflecting the local real estate landscape.
Aprica Airbnb Room Capacity Analysis (2025): Bedroom Distribution
Distribution of Listings by Number of Bedrooms
Room Capacity Insights for Aprica
- The dominant room capacity in Aprica is 2 bedrooms listings, making up 42.6% of the market. This suggests a strong demand for properties suitable for couples or solo travelers.
- Together, 2 bedrooms and 1 bedroom properties represent 82.3% of the active Airbnb listings in Aprica, indicating a high concentration in these sizes.
- Listings with 3+ bedrooms (8.8%) represent a smaller niche, potentially indicating an underserved market for larger group accommodations in Aprica.
Aprica Vacation Rental Guest Capacity Trends (2025)
Distribution of Listings by Guest Capacity
Guest Capacity Insights for Aprica
- The most common guest capacity trend in Aprica vacation rentals is listings accommodating 4 guests (44.1%). This suggests the primary traveler segment is likely small families or groups.
- Properties designed for 4 guests and 6 guests dominate the Aprica STR market, accounting for 61.7% of listings.
- 26.4% of properties accommodate 6+ guests, serving the market segment for larger families or group travel in Aprica.
- On average, properties in Aprica are equipped to host 4.6 guests.
Aprica Airbnb Booking Patterns (2025): Available vs. Booked Days
Available Days Distribution
Booked Days Distribution
Booking Pattern Insights for Aprica
- The most common availability pattern in Aprica falls within the 271-366 days range, representing 76.5% of listings. This suggests many properties have significant open periods on their calendars.
- Approximately 95.6% of listings show high availability (181+ days open annually), indicating potential for increased bookings or specific owner usage patterns.
- For booked days, the 31-90 days range is most frequent in Aprica (48.5%), reflecting common guest stay durations or potential owner blocking patterns.
- A notable 4.4% of properties secure long booking periods (181+ days booked per year), highlighting successful long-term rental strategies or significant owner usage.
Aprica Airbnb Minimum Stay Requirements Analysis
Distribution of Listings by Minimum Night Requirement
1 Night
4 listings
6.6% of total
2 Nights
23 listings
37.7% of total
3 Nights
3 listings
4.9% of total
4-6 Nights
9 listings
14.8% of total
7-29 Nights
10 listings
16.4% of total
30+ Nights
12 listings
19.7% of total
Key Insights
- The most prevalent minimum stay requirement in Aprica is 2 Nights, adopted by 37.7% of listings. This highlights the market's preference for shorter, flexible bookings.
- A significant segment (19.7%) caters to monthly stays (30+ nights) in Aprica, pointing to opportunities in the extended-stay market.
Recommendations
- Align with the market by considering a 2 Nights minimum stay, as 37.7% of Aprica hosts use this setting.
- If feasible, allowing 1-night stays, especially midweek or during low season, could capture last-minute bookings, as only 6.6% currently do.
- A 2-night minimum appears standard (37.7%). Consider this for weekends or peak periods.
- Explore offering discounts for stays of 30+ nights to attract the 19.7% of the market seeking extended stays.
- Adjust minimum nights based on seasonality – potentially shorter during low season and longer during peak demand periods in Aprica.
Aprica Airbnb Cancellation Policy Trends Analysis (2025)
Flexible
13 listings
27.1% of total
Moderate
24 listings
50% of total
Strict
11 listings
22.9% of total
Cancellation Policy Insights for Aprica
- The prevailing Airbnb cancellation policy trend in Aprica is Moderate, used by 50% of listings.
- The market strongly favors guest-friendly terms, with 77.1% of listings offering Flexible or Moderate policies. This suggests guests in Aprica may expect booking flexibility.
Recommendations for Hosts
- Consider adopting a Moderate policy to align with the 50% market standard in Aprica.
- Regularly review your cancellation policy against competitors and market demand shifts in Aprica.
Aprica STR Booking Lead Time Analysis (2025)
Average Booking Lead Time by Month
Booking Lead Time Insights for Aprica
- The overall average booking lead time for vacation rentals in Aprica is 46 days.
- Guests book furthest in advance for stays during October (average 90 days), likely coinciding with peak travel demand or local events.
- The shortest booking windows occur for stays in September (average 20 days), indicating more last-minute travel plans during this time.
- Seasonally, Winter (56 days avg.) sees the longest lead times, while Spring (46 days avg.) has the shortest, reflecting typical travel planning cycles.
Recommendations for Hosts
- Use the overall average lead time (46 days) as a baseline for your pricing and availability strategy in Aprica.
- For October stays, consider implementing length-of-stay discounts or slightly higher rates for bookings made less than 90 days out to capitalize on advance planning.
- Target marketing efforts for the Winter season well in advance (at least 56 days) to capture early planners.
- Monitor your own booking lead times against these Aprica averages to identify opportunities for dynamic pricing adjustments.
Popular & Essential Airbnb Amenities in Aprica (2025)
Amenity Prevalence
Amenity Insights for Aprica
- Essential amenities in Aprica that guests expect include: Kitchen, Heating, TV, Hot water. Lacking these (any) could significantly impact bookings.
- Popular amenities like Dishes and silverware, Refrigerator, Hair dryer are common but not universal. Offering these can provide a competitive edge.
Recommendations for Hosts
- Ensure your listing includes all essential amenities for Aprica: Kitchen, Heating, TV, Hot water.
- Prioritize adding missing essentials: Heating, TV, Hot water.
- Consider adding popular differentiators like Dishes and silverware or Refrigerator to increase appeal.
- Highlight unique or less common amenities you offer (e.g., hot tub, dedicated workspace, EV charger) in your listing description and photos.
- Regularly check competitor amenities in Aprica to stay competitive.
Aprica Airbnb Guest Demographics & Profile Analysis (2025)
Guest Profile Summary for Aprica
- The typical guest profile for Airbnb in Aprica consists of primarily domestic travelers (72%), often arriving from nearby Milan, typically belonging to the Post-2000s (Gen Z/Alpha) group (50%), primarily speaking English or Italian.
- Domestic travelers account for 71.9% of guests.
- Key international markets include Italy (71.9%) and United Kingdom (7.9%).
- Top languages spoken are English (39.4%) followed by Italian (31.9%).
- A significant demographic segment is the Post-2000s (Gen Z/Alpha) group, representing 50% of guests.
Recommendations for Hosts
- Target domestic marketing efforts towards travelers from Milan and Monza.
- Tailor amenities and listing descriptions to appeal to the dominant Post-2000s (Gen Z/Alpha) demographic (e.g., highlight fast WiFi, smart home features, local guides).
- Highlight unique local experiences or amenities relevant to the primary guest profile.
- Consider seasonal promotions aligned with peak travel times for key origin markets.
Nearby Short-Term Rental Market Comparison
How does the Aprica Airbnb market stack up against its neighbors? Compare key performance metrics like average monthly revenue, ADR, and occupancy rates in surrounding areas to understand the broader regional STR landscape.
| Market | Active Properties | Monthly Revenue | Daily Rate | Avg. Occupancy |
|---|---|---|---|---|
| Laglio | 64 | $4,873 | $463.61 | 47% |
| Bayrischzell | 30 | $4,718 | $392.87 | 42% |
| Urtijëi - St. Ulrich in Gröden - Ortisei | 163 | $4,698 | $630.45 | 40% |
| Moos in Passeier - Moso in Passiria | 17 | $4,619 | $547.60 | 27% |
| Steinberg am Rofan | 11 | $4,394 | $311.71 | 40% |
| Brenzone sul Garda | 19 | $4,128 | $335.25 | 52% |
| Bürserberg | 40 | $3,978 | $342.57 | 41% |
| Sala Comacina | 64 | $3,794 | $400.27 | 50% |
| Bellagio | 373 | $3,630 | $328.26 | 55% |
| Brand | 56 | $3,597 | $486.13 | 33% |