Anfo Airbnb Market Analysis 2025: Short Term Rental Data & Vacation Rental Statistics in Lombardy, Italy
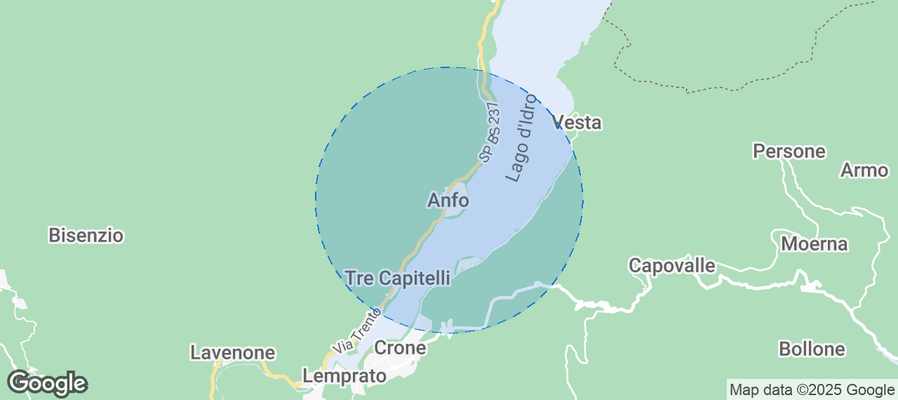
Is Airbnb profitable in Anfo in 2025? Explore comprehensive Airbnb analytics for Anfo, Lombardy, Italy to uncover income potential. This 2025 STR market report for Anfo, based on AirROI data from April 2024 to March 2025, reveals key trends in the niche market of 18 active listings.
Whether you're considering an Airbnb investment in Anfo, optimizing your existing vacation rental, or exploring rental arbitrage opportunities, understanding the Anfo Airbnb data is crucial. Navigating the high regulation landscape is key to maximizing your short term rental income potential. Let's dive into the specifics.
Key Anfo Airbnb Performance Metrics Overview
Monthly Airbnb Revenue Variations & Income Potential in Anfo (2025)
Understanding the monthly revenue variations for Airbnb listings in Anfo is key to maximizing your short term rental income potential. Seasonality significantly impacts earnings. Our analysis, based on data from the past 12 months, shows that the peak revenue month for STRs in Anfo is typically July, while February often presents the lowest earnings, highlighting opportunities for strategic pricing adjustments during shoulder and low seasons. Explore the typical Airbnb income in Anfo across different performance tiers:
- Best-in-class properties (Top 10%) achieve $4,057+ monthly, often utilizing dynamic pricing and superior guest experiences.
- Strong performing properties (Top 25%) earn $2,608 or more, indicating effective management and desirable locations/amenities.
- Typical properties (Median) generate around $1,796 per month, representing the average market performance.
- Entry-level properties (Bottom 25%) see earnings around $1,056, often with potential for optimization.
Average Monthly Airbnb Earnings Trend in Anfo
Anfo Airbnb Occupancy Rate Trends (2025)
Maximize your bookings by understanding the Anfo STR occupancy trends. Seasonal demand shifts significantly influence how often properties are booked. Typically, Julysees the highest demand (peak season occupancy), while February experiences the lowest (low season). Effective strategies, like adjusting minimum stays or offering promotions, can boost occupancy during slower periods. Here's how different property tiers perform in Anfo:
- Best-in-class properties (Top 10%) achieve 78%+ occupancy, indicating high desirability and potentially optimized availability.
- Strong performing properties (Top 25%) maintain 59% or higher occupancy, suggesting good market fit and guest satisfaction.
- Typical properties (Median) have an occupancy rate around 47%.
- Entry-level properties (Bottom 25%) average 24% occupancy, potentially facing higher vacancy.
Average Monthly Occupancy Rate Trend in Anfo
Average Daily Rate (ADR) Airbnb Trends in Anfo (2025)
Effective short term rental pricing strategy in Anfo involves understanding monthly ADR fluctuations. The Average Daily Rate (ADR) for Airbnb in Anfo typically peaks in November and dips lowest during April. Leveraging Airbnb dynamic pricing tools or strategies based on this seasonality can significantly boost revenue. Here's a look at the typical nightly rates achieved:
- Best-in-class properties (Top 10%) command rates of $270+ per night, often due to premium features or locations.
- Strong performing properties (Top 25%) achieve nightly rates of $179 or more.
- Typical properties (Median) charge around $114 per night.
- Entry-level properties (Bottom 25%) earn around $89 per night.
Average Daily Rate (ADR) Trend by Month in Anfo
Get Live Anfo Market Intelligence 👇
Explore Real-time Analytics
Airbnb Seasonality Analysis & Trends in Anfo (2025)
Peak Season (July, August, June)
- Revenue averages $3,286 per month
- Occupancy rates average 67.3%
- Daily rates average $138
Shoulder Season
- Revenue averages $2,037 per month
- Occupancy maintains around 49.7%
- Daily rates hold near $141
Low Season (January, February, March)
- Revenue drops to average $614 per month
- Occupancy decreases to average 18.5%
- Daily rates adjust to average $148
Seasonality Insights for Anfo
- The Airbnb seasonality in Anfo shows highly seasonal trends requiring careful strategy. While the sections above show seasonal averages, it's also insightful to look at the extremes:
- During the high season, the absolute peak month showcases Anfo's highest earning potential, with monthly revenues capable of climbing to $3,463, occupancy reaching a high of 76.4%, and ADRs peaking at $151.
- Conversely, the slowest single month of the year, typically falling within the low season, marks the market's lowest point. In this month, revenue might dip to $200, occupancy could drop to 7.1%, and ADRs may adjust down to $127.
- Understanding both the seasonal averages and these monthly peaks and troughs in revenue, occupancy, and ADR is crucial for maximizing your Airbnb profit potential in Anfo.
Seasonal Strategies for Maximizing Profit
- Peak Season: Maximize revenue through premium pricing and potentially longer minimum stays. Ensure high availability.
- Low Season: Offer competitive pricing, special promotions (e.g., extended stay discounts), and flexible cancellation policies. Target off-season travelers like remote workers or budget-conscious guests.
- Shoulder Seasons: Implement dynamic pricing that balances peak and low rates. Target weekend travelers or specific events. Offer slightly more flexible terms than peak season.
- Regularly analyze your own performance against these Anfo seasonality benchmarks and adjust your pricing and availability strategy accordingly.
Best Areas for Airbnb Investment in Anfo (2025)
Exploring the top neighborhoods for short-term rentals in Anfo? This section highlights key areas, outlining why they are attractive for hosts and guests, along with notable local attractions. Consider these locations based on your target guest profile and investment strategy.
| Neighborhood / Area | Why Host Here? (Target Guests & Appeal) | Key Attractions & Landmarks |
|---|---|---|
| Centro Storico | The historical center of Anfo offers a glimpse into the past with its traditional Italian architecture and scenic views. It's a charming area that attracts tourists looking for a cultural experience. | Castello di Anfo, Porta delle Sabine, local restaurants and cafes, the scenic lakeside, historical churches |
| Lago d'Idro | This area is known for its beautiful lake and outdoor activities. It's perfect for nature lovers and those seeking water sports, making it a great location for summer tourists. | Lake Idro, hiking trails, water sports activities, local beaches, nature parks |
| Montagne di Anfo | The mountains surrounding Anfo are ideal for trekking and skiing. This attracts adventure tourists and those looking to explore the natural beauty of Lombardy. | Alpine hiking trails, ski resorts in winter, wildlife spotting, breathtaking viewpoints, eco tours |
| Località Pieve | A quieter area that offers a chance to experience local life and traditions. It’s particularly appealing for tourists looking for a peaceful retreat. | traditional markets, local festivals, artisanal shops, walking trails, vineyards |
| Val Trompia | Famous for its valleys and stunning landscapes, Val Trompia is excellent for outdoor enthusiasts and provides a more rustic Italian experience. | natural parks, mountain biking routes, historical mining sites, picturesque villages, local farms |
| Isola di Garda | A beautiful island on Lake Garda known for its lush gardens and elegance. It attracts those looking for an upscale and idyllic getaway. | Botanic Gardens, historic villas, private beaches, water activities, scenic boat tours |
| Brescia | The nearest city with historical significance and urban amenities. It's ideal for hosting business travelers and tourists who want city experiences close to nature. | Castle of Brescia, Museo di Santa Giulia, Piazza della Loggia, local dining and nightlife, shopping districts |
| Salo' | Located by Lake Garda, Salo' is known for its beautiful lakeside promenade and vibrant atmosphere. It's a favored spot for tourists looking for relaxation and leisure activities. | Lakeside promenade, historical architecture, local eateries, waterfront parks, regional events |
Understanding Airbnb License Requirements & STR Laws in Anfo (2025)
Yes, Anfo, Lombardy, Italy enforces high STR regulations. Obtaining a license and ensuring compliance is almost certainly required according to current 2025 STR laws. Always verify the latest short term rental regulations and Airbnb license requirements directly with local government authorities for Anfo to ensure full compliance before hosting.
(Source: AirROI data, 2025, based on 50% licensed listings)
Top Performing Airbnb Properties in Anfo (2025)
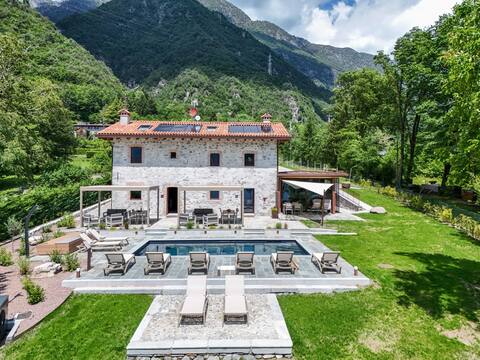
Benchmark your potential! Explore examples of top-performing Airbnb properties in Anfobased on Trailing Twelve Month (TTM) revenue. Analyze their characteristics, revenue, occupancy rate, and ADR to understand what drives success in this market.

House directly on Lake Idro with private beach
Entire Place • 3 bedrooms

Vacation home "Miralago" directly on Lake Idro
Entire Place • 2 bedrooms

Luxury Apartment with Privat Jacuzzi
Entire Place • 2 bedrooms
Luxury Apartment front lake
Entire Place • 2 bedrooms

Dolce Vita Apartment
Entire Place • 1 bedroom
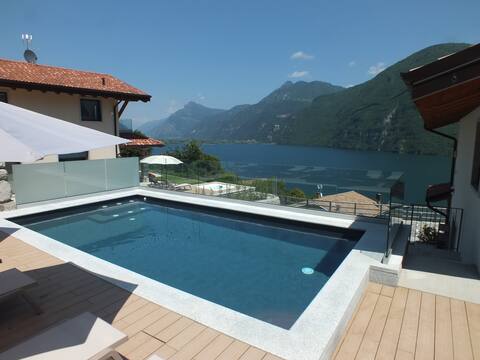
Appartamento vista lago con piscina e Jacuzzi
Entire Place • 2 bedrooms
Note: Performance varies based on location, size, amenities, seasonality, and management quality. Data reflects the past 12 months.
Top Performing Airbnb Hosts in Anfo (2025)
Learn from the best! This table showcases top-performing Airbnb hosts in Anfo based on the number of properties managed and estimated total revenue over the past year. Analyze their scale and performance metrics.
| Host Name | Properties | Grossing Revenue | Stay Reviews | Avg Rating |
|---|---|---|---|---|
| Mirco | 8 | $96,769 | 13 | 1.25/5.0 |
| Paul | 1 | $31,164 | 45 | 4.93/5.0 |
| Nicole | 1 | $26,633 | 89 | 4.85/5.0 |
| Matteo | 1 | $18,721 | 30 | 4.87/5.0 |
| Edoardo | 1 | $17,046 | 9 | 4.89/5.0 |
| Francesca | 1 | $14,102 | 13 | 4.85/5.0 |
| Andrea Massimiliano | 1 | $11,581 | 31 | 4.90/5.0 |
| Host #446677272 | 1 | $11,130 | 24 | 4.96/5.0 |
| Host #43263077 | 1 | $8,746 | 52 | 4.71/5.0 |
| Irene Cora | 1 | $7,839 | 140 | 4.88/5.0 |
Analyzing the strategies of top hosts, such as their property selection, pricing, and guest communication, can offer valuable lessons for optimizing your own Airbnb operations in Anfo.
Dive Deeper: Advanced Anfo STR Market Data (2025)
Ready to unlock more insights? AirROI provides access to advanced metrics and comprehensive Airbnb data for Anfo. Explore detailed analytics beyond this report to refine your investment strategy, optimize pricing, and maximize your vacation rental profits.
Explore Advanced MetricsAnfo Short-Term Rental Market Composition (2025): Property & Room Types
Room Type Distribution
Property Type Distribution
Market Composition Insights for Anfo
- The Anfo Airbnb market composition is heavily skewed towards Entire Home/Apt listings, which make up 100% of the 18 active rentals. This indicates strong guest preference for privacy and space.
- Looking at the property type distribution in Anfo, Apartment/Condo properties are the most common (77.8%), reflecting the local real estate landscape.
- Houses represent a significant 16.7% portion, catering likely to families or larger groups.
Anfo Airbnb Room Capacity Analysis (2025): Bedroom Distribution
Distribution of Listings by Number of Bedrooms
Room Capacity Insights for Anfo
- The dominant room capacity in Anfo is 2 bedrooms listings, making up 61.1% of the market. This suggests a strong demand for properties suitable for couples or solo travelers.
- Together, 2 bedrooms and 1 bedroom properties represent 88.9% of the active Airbnb listings in Anfo, indicating a high concentration in these sizes.
Anfo Vacation Rental Guest Capacity Trends (2025)
Distribution of Listings by Guest Capacity
Guest Capacity Insights for Anfo
- The most common guest capacity trend in Anfo vacation rentals is listings accommodating 4 guests (55.6%). This suggests the primary traveler segment is likely small families or groups.
- Properties designed for 4 guests and 6 guests dominate the Anfo STR market, accounting for 72.3% of listings.
- 16.7% of properties accommodate 6+ guests, serving the market segment for larger families or group travel in Anfo.
- On average, properties in Anfo are equipped to host 4.3 guests.
Anfo Airbnb Booking Patterns (2025): Available vs. Booked Days
Available Days Distribution
Booked Days Distribution
Booking Pattern Insights for Anfo
- The most common availability pattern in Anfo falls within the 271-366 days range, representing 44.4% of listings. This suggests many properties have significant open periods on their calendars.
- Approximately 88.8% of listings show high availability (181+ days open annually), indicating potential for increased bookings or specific owner usage patterns.
- For booked days, the 91-180 days range is most frequent in Anfo (38.9%), reflecting common guest stay durations or potential owner blocking patterns.
- A notable 16.7% of properties secure long booking periods (181+ days booked per year), highlighting successful long-term rental strategies or significant owner usage.
Anfo Airbnb Minimum Stay Requirements Analysis
Distribution of Listings by Minimum Night Requirement
2 Nights
1 listings
6.3% of total
3 Nights
4 listings
25% of total
4-6 Nights
6 listings
37.5% of total
7-29 Nights
3 listings
18.8% of total
30+ Nights
2 listings
12.5% of total
Key Insights
- The most prevalent minimum stay requirement in Anfo is 4-6 Nights, adopted by 37.5% of listings. This highlights the market's preference for longer commitments.
- Very short stays (1-2 nights) are less common (6.3%), suggesting hosts prefer slightly longer bookings to optimize turnover.
- A significant segment (12.5%) caters to monthly stays (30+ nights) in Anfo, pointing to opportunities in the extended-stay market.
Recommendations
- Align with the market by considering a 4-6 Nights minimum stay, as 37.5% of Anfo hosts use this setting.
- Explore offering discounts for stays of 30+ nights to attract the 12.5% of the market seeking extended stays.
- Adjust minimum nights based on seasonality – potentially shorter during low season and longer during peak demand periods in Anfo.
Anfo Airbnb Cancellation Policy Trends Analysis (2025)
Flexible
4 listings
36.4% of total
Moderate
4 listings
36.4% of total
Strict
3 listings
27.3% of total
Cancellation Policy Insights for Anfo
- The prevailing Airbnb cancellation policy trend in Anfo is Flexible, used by 36.4% of listings.
- The market strongly favors guest-friendly terms, with 72.8% of listings offering Flexible or Moderate policies. This suggests guests in Anfo may expect booking flexibility.
Recommendations for Hosts
- Consider adopting a Flexible policy to align with the 36.4% market standard in Anfo.
- Regularly review your cancellation policy against competitors and market demand shifts in Anfo.
Anfo STR Booking Lead Time Analysis (2025)
Average Booking Lead Time by Month
Booking Lead Time Insights for Anfo
- The overall average booking lead time for vacation rentals in Anfo is 49 days.
- Guests book furthest in advance for stays during October (average 154 days), likely coinciding with peak travel demand or local events.
- The shortest booking windows occur for stays in December (average 0 days), indicating more last-minute travel plans during this time.
- Seasonally, Fall (107 days avg.) sees the longest lead times, while Winter (0 days avg.) has the shortest, reflecting typical travel planning cycles.
Recommendations for Hosts
- Use the overall average lead time (49 days) as a baseline for your pricing and availability strategy in Anfo.
- For October stays, consider implementing length-of-stay discounts or slightly higher rates for bookings made less than 154 days out to capitalize on advance planning.
- During December, focus on last-minute booking availability and promotions, as guests book with very short notice (0 days avg.).
- Target marketing efforts for the Fall season well in advance (at least 107 days) to capture early planners.
- Monitor your own booking lead times against these Anfo averages to identify opportunities for dynamic pricing adjustments.
Popular & Essential Airbnb Amenities in Anfo (2025)
Amenity Prevalence
Amenity Insights for Anfo
- Essential amenities in Anfo that guests expect include: Essentials, Hair dryer, Kitchen, Hot water. Lacking these (any) could significantly impact bookings.
- Popular amenities like Heating, TV, Coffee maker are common but not universal. Offering these can provide a competitive edge.
- Warning: Wifi is not universally provided but is considered essential globally. Ensure reliable Wifi is offered.
Recommendations for Hosts
- Ensure your listing includes all essential amenities for Anfo: Essentials, Hair dryer, Kitchen, Hot water.
- Consider adding popular differentiators like Heating or TV to increase appeal.
- Highlight unique or less common amenities you offer (e.g., hot tub, dedicated workspace, EV charger) in your listing description and photos.
- Regularly check competitor amenities in Anfo to stay competitive.
Anfo Airbnb Guest Demographics & Profile Analysis (2025)
Guest Profile Summary for Anfo
- The typical guest profile for Airbnb in Anfo consists of predominantly international visitors (94%), with top international origins including Italy, typically belonging to the Post-2000s (Gen Z/Alpha) group (50%), primarily speaking English or German.
- Domestic travelers account for 5.8% of guests.
- Key international markets include Germany (59.4%) and Italy (5.8%).
- Top languages spoken are English (41.6%) followed by German (27%).
- A significant demographic segment is the Post-2000s (Gen Z/Alpha) group, representing 50% of guests.
Recommendations for Hosts
- Focus marketing internationally, particularly towards travelers from Italy.
- Tailor amenities and listing descriptions to appeal to the dominant Post-2000s (Gen Z/Alpha) demographic (e.g., highlight fast WiFi, smart home features, local guides).
- Highlight unique local experiences or amenities relevant to the primary guest profile.
- Consider seasonal promotions aligned with peak travel times for key origin markets.
Nearby Short-Term Rental Market Comparison
How does the Anfo Airbnb market stack up against its neighbors? Compare key performance metrics like average monthly revenue, ADR, and occupancy rates in surrounding areas to understand the broader regional STR landscape.
| Market | Active Properties | Monthly Revenue | Daily Rate | Avg. Occupancy |
|---|---|---|---|---|
| Laglio | 64 | $4,873 | $463.61 | 47% |
| Urtijëi - St. Ulrich in Gröden - Ortisei | 163 | $4,698 | $630.45 | 40% |
| Moos in Passeier - Moso in Passiria | 17 | $4,619 | $547.60 | 27% |
| Brenzone sul Garda | 19 | $4,128 | $335.25 | 52% |
| Portofino | 68 | $4,086 | $454.35 | 44% |
| Sala Comacina | 64 | $3,794 | $400.27 | 50% |
| Bellagio | 373 | $3,630 | $328.26 | 55% |
| Oliveto Lario | 99 | $3,509 | $327.42 | 55% |
| Varenna | 216 | $3,419 | $272.27 | 56% |
| Carate Urio | 71 | $3,379 | $331.90 | 44% |