Villa Faraldi Airbnb Market Analysis 2025: Short Term Rental Data & Vacation Rental Statistics in Liguria, Italy
Is Airbnb profitable in Villa Faraldi in 2025? Explore comprehensive Airbnb analytics for Villa Faraldi, Liguria, Italy to uncover income potential. This 2025 STR market report for Villa Faraldi, based on AirROI data from April 2024 to March 2025, reveals key trends in the niche market of 21 active listings.
Whether you're considering an Airbnb investment in Villa Faraldi, optimizing your existing vacation rental, or exploring rental arbitrage opportunities, understanding the Villa Faraldi Airbnb data is crucial. Navigating the high regulation landscape is key to maximizing your short term rental income potential. Let's dive into the specifics.
Key Villa Faraldi Airbnb Performance Metrics Overview
Monthly Airbnb Revenue Variations & Income Potential in Villa Faraldi (2025)
Understanding the monthly revenue variations for Airbnb listings in Villa Faraldi is key to maximizing your short term rental income potential. Seasonality significantly impacts earnings. Our analysis, based on data from the past 12 months, shows that the peak revenue month for STRs in Villa Faraldi is typically August, while December often presents the lowest earnings, highlighting opportunities for strategic pricing adjustments during shoulder and low seasons. Explore the typical Airbnb income in Villa Faraldi across different performance tiers:
- Best-in-class properties (Top 10%) achieve $1,882+ monthly, often utilizing dynamic pricing and superior guest experiences.
- Strong performing properties (Top 25%) earn $1,315 or more, indicating effective management and desirable locations/amenities.
- Typical properties (Median) generate around $956 per month, representing the average market performance.
- Entry-level properties (Bottom 25%) see earnings around $438, often with potential for optimization.
Average Monthly Airbnb Earnings Trend in Villa Faraldi
Villa Faraldi Airbnb Occupancy Rate Trends (2025)
Maximize your bookings by understanding the Villa Faraldi STR occupancy trends. Seasonal demand shifts significantly influence how often properties are booked. Typically, Augustsees the highest demand (peak season occupancy), while December experiences the lowest (low season). Effective strategies, like adjusting minimum stays or offering promotions, can boost occupancy during slower periods. Here's how different property tiers perform in Villa Faraldi:
- Best-in-class properties (Top 10%) achieve 82%+ occupancy, indicating high desirability and potentially optimized availability.
- Strong performing properties (Top 25%) maintain 57% or higher occupancy, suggesting good market fit and guest satisfaction.
- Typical properties (Median) have an occupancy rate around 35%.
- Entry-level properties (Bottom 25%) average 16% occupancy, potentially facing higher vacancy.
Average Monthly Occupancy Rate Trend in Villa Faraldi
Average Daily Rate (ADR) Airbnb Trends in Villa Faraldi (2025)
Effective short term rental pricing strategy in Villa Faraldi involves understanding monthly ADR fluctuations. The Average Daily Rate (ADR) for Airbnb in Villa Faraldi typically peaks in July and dips lowest during March. Leveraging Airbnb dynamic pricing tools or strategies based on this seasonality can significantly boost revenue. Here's a look at the typical nightly rates achieved:
- Best-in-class properties (Top 10%) command rates of $131+ per night, often due to premium features or locations.
- Strong performing properties (Top 25%) achieve nightly rates of $95 or more.
- Typical properties (Median) charge around $76 per night.
- Entry-level properties (Bottom 25%) earn around $63 per night.
Average Daily Rate (ADR) Trend by Month in Villa Faraldi
Get Live Villa Faraldi Market Intelligence 👇

Explore Real-time Analytics
Airbnb Seasonality Analysis & Trends in Villa Faraldi (2025)
Peak Season (August, July, September)
- Revenue averages $1,602 per month
- Occupancy rates average 59.3%
- Daily rates average $95
Shoulder Season
- Revenue averages $907 per month
- Occupancy maintains around 37.5%
- Daily rates hold near $83
Low Season (March, October, December)
- Revenue drops to average $522 per month
- Occupancy decreases to average 25.9%
- Daily rates adjust to average $78
Seasonality Insights for Villa Faraldi
- The Airbnb seasonality in Villa Faraldi shows highly seasonal trends requiring careful strategy. While the sections above show seasonal averages, it's also insightful to look at the extremes:
- During the high season, the absolute peak month showcases Villa Faraldi's highest earning potential, with monthly revenues capable of climbing to $1,839, occupancy reaching a high of 65.1%, and ADRs peaking at $98.
- Conversely, the slowest single month of the year, typically falling within the low season, marks the market's lowest point. In this month, revenue might dip to $477, occupancy could drop to 15.8%, and ADRs may adjust down to $72.
- Understanding both the seasonal averages and these monthly peaks and troughs in revenue, occupancy, and ADR is crucial for maximizing your Airbnb profit potential in Villa Faraldi.
Seasonal Strategies for Maximizing Profit
- Peak Season: Maximize revenue through premium pricing and potentially longer minimum stays. Ensure high availability.
- Low Season: Offer competitive pricing, special promotions (e.g., extended stay discounts), and flexible cancellation policies. Target off-season travelers like remote workers or budget-conscious guests.
- Shoulder Seasons: Implement dynamic pricing that balances peak and low rates. Target weekend travelers or specific events. Offer slightly more flexible terms than peak season.
- Regularly analyze your own performance against these Villa Faraldi seasonality benchmarks and adjust your pricing and availability strategy accordingly.
Best Areas for Airbnb Investment in Villa Faraldi (2025)
Exploring the top neighborhoods for short-term rentals in Villa Faraldi? This section highlights key areas, outlining why they are attractive for hosts and guests, along with notable local attractions. Consider these locations based on your target guest profile and investment strategy.
| Neighborhood / Area | Why Host Here? (Target Guests & Appeal) | Key Attractions & Landmarks |
|---|---|---|
| Villa Faraldi Centro | Charming village center with traditional Ligurian architecture, picturesque streets, and a local market. Appeals to those seeking authentic Italian village life close to beautiful coastal views. | San Giovanni Battista Church, Villa Faraldi Castle, Local market, Village piazza, Nearby hiking trails |
| Western Riviera | Famous for stunning coastal views and proximity to the Mediterranean. Artists and beach lovers flock here for relaxation and water activities. | Mediterranean beaches, Bordighera, Ventimiglia, Sea views from hiking trails, Diving and water sports |
| Dolcedo | Nearby village known for its historic charm and scenic surroundings. Great for visitors seeking tranquility and natural beauty, with access to local restaurants and shops. | Old town village, River Merula, Local wine tasting, Artisan shops, Hiking trails |
| San Lorenzo al Mare | Popular coastal destination with sandy beaches and cycling paths along the coast. Perfect for families and outdoor enthusiasts. | Beaches, Cycle path to Ospedaletti, Local seafood restaurants, Marina San Lorenzo, Water sports |
| Imperial Coast | Part of the beautiful coastal region encompassing many beaches and small towns. Great for beach lovers and those looking to explore the Ligurian coastline. | Beaches, Coastal hikes, Charming coastal villages, Local seafood cuisine, Scenic views |
| Borghetto Santo Spirito | Also known for its sandy beaches and local culture. Attracts tourists who enjoy vibrant beach life with various entertainment options. | Beaches, Cafes and restaurants, Local events, Shopping areas, Nightlife |
| Alassio | A well-known tourist destination famous for its sandy beach, fine dining, and lively promenade. Attracts both families and young people. | Alassio Beach, Bagni di Alassio, Shopping streets, Restaurants and clubs, Events and festivals |
| Cervo | A picturesque coastal town featuring beautiful views and historic architecture. Popular for romantic getaways and boutique stays. | Cervo Castle, Church of St. John the Baptist, Scenic viewpoints, Art galleries, Local artisan shops |
Understanding Airbnb License Requirements & STR Laws in Villa Faraldi (2025)
Yes, Villa Faraldi, Liguria, Italy enforces high STR regulations. Obtaining a license and ensuring compliance is almost certainly required according to current 2025 STR laws. Always verify the latest short term rental regulations and Airbnb license requirements directly with local government authorities for Villa Faraldi to ensure full compliance before hosting.
(Source: AirROI data, 2025, based on 38% licensed listings)
Top Performing Airbnb Properties in Villa Faraldi (2025)
Benchmark your potential! Explore examples of top-performing Airbnb properties in Villa Faraldibased on Trailing Twelve Month (TTM) revenue. Analyze their characteristics, revenue, occupancy rate, and ADR to understand what drives success in this market.

Casa Bouganville a small romantic nest
Entire Place • 1 bedroom

La Bottega di Teresa
Entire Place • 1 bedroom
canonica, a romantic open space all to yourself
Entire Place • 1 bedroom
Casa Annette, a family home with a sea view.
Entire Place • 2 bedrooms
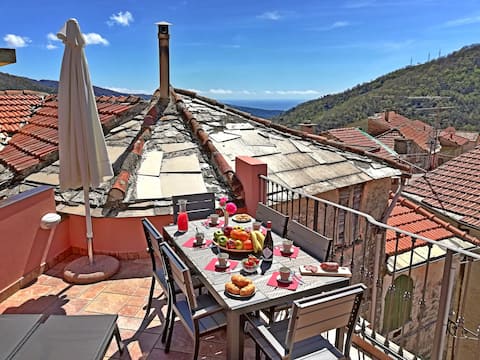
La Ginestra: Terrace and Garden, Little Sea View
Entire Place • 2 bedrooms
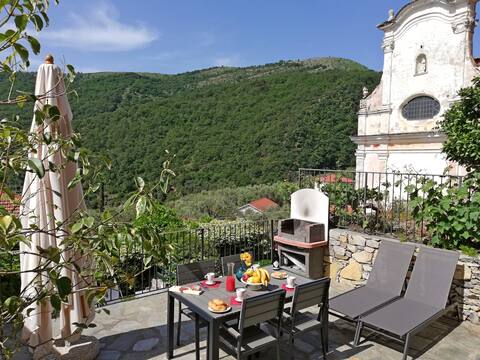
Il Cavaliere: Large Terrace, Umbrella and BBQ
Entire Place • 1 bedroom
Note: Performance varies based on location, size, amenities, seasonality, and management quality. Data reflects the past 12 months.
Top Performing Airbnb Hosts in Villa Faraldi (2025)
Learn from the best! This table showcases top-performing Airbnb hosts in Villa Faraldi based on the number of properties managed and estimated total revenue over the past year. Analyze their scale and performance metrics.
| Host Name | Properties | Grossing Revenue | Stay Reviews | Avg Rating |
|---|---|---|---|---|
| Corrado | 2 | $38,243 | 185 | 4.99/5.0 |
| Fabio | 5 | $30,666 | 19 | 3.00/5.0 |
| Lorenza | 3 | $20,613 | 83 | 4.96/5.0 |
| Donatella | 1 | $13,939 | 36 | 4.97/5.0 |
| Host #13588645 | 1 | $13,672 | 18 | 4.83/5.0 |
| Laure Karine | 2 | $13,470 | 12 | 4.73/5.0 |
| Ute | 1 | $8,154 | 23 | 4.78/5.0 |
| Eliana | 2 | $7,451 | 90 | 4.46/5.0 |
| Host #190606451 | 1 | $6,820 | 0 | 0.00/5.0 |
| Host #168693446 | 1 | $5,451 | 1 | 0.00/5.0 |
Analyzing the strategies of top hosts, such as their property selection, pricing, and guest communication, can offer valuable lessons for optimizing your own Airbnb operations in Villa Faraldi.
Dive Deeper: Advanced Villa Faraldi STR Market Data (2025)
Ready to unlock more insights? AirROI provides access to advanced metrics and comprehensive Airbnb data for Villa Faraldi. Explore detailed analytics beyond this report to refine your investment strategy, optimize pricing, and maximize your vacation rental profits.
Explore Advanced MetricsVilla Faraldi Short-Term Rental Market Composition (2025): Property & Room Types
Room Type Distribution
Property Type Distribution
Market Composition Insights for Villa Faraldi
- The Villa Faraldi Airbnb market composition is heavily skewed towards Entire Home/Apt listings, which make up 100% of the 21 active rentals. This indicates strong guest preference for privacy and space.
- Looking at the property type distribution in Villa Faraldi, Apartment/Condo properties are the most common (57.1%), reflecting the local real estate landscape.
- Houses represent a significant 38.1% portion, catering likely to families or larger groups.
- Smaller segments like outdoor/unique (combined 4.8%) offer potential for unique stay experiences.
Villa Faraldi Airbnb Room Capacity Analysis (2025): Bedroom Distribution
Distribution of Listings by Number of Bedrooms
Room Capacity Insights for Villa Faraldi
- The dominant room capacity in Villa Faraldi is 1 bedroom listings, making up 47.6% of the market. This suggests a strong demand for properties suitable for couples or solo travelers.
- Together, 1 bedroom and 2 bedrooms properties represent 66.6% of the active Airbnb listings in Villa Faraldi, indicating a high concentration in these sizes.
- A significant 23.9% of listings offer 3+ bedrooms, catering to larger groups and families seeking more space in Villa Faraldi.
Villa Faraldi Vacation Rental Guest Capacity Trends (2025)
Distribution of Listings by Guest Capacity
Guest Capacity Insights for Villa Faraldi
- The most common guest capacity trend in Villa Faraldi vacation rentals is listings accommodating 2 guests (33.3%). This suggests the primary traveler segment is likely couples or solo travelers.
- Properties designed for 2 guests and 6 guests dominate the Villa Faraldi STR market, accounting for 57.1% of listings.
- 33.3% of properties accommodate 6+ guests, serving the market segment for larger families or group travel in Villa Faraldi.
- On average, properties in Villa Faraldi are equipped to host 4.2 guests.
Villa Faraldi Airbnb Booking Patterns (2025): Available vs. Booked Days
Available Days Distribution
Booked Days Distribution
Booking Pattern Insights for Villa Faraldi
- The most common availability pattern in Villa Faraldi falls within the 271-366 days range, representing 61.9% of listings. This suggests many properties have significant open periods on their calendars.
- Approximately 76.2% of listings show high availability (181+ days open annually), indicating potential for increased bookings or specific owner usage patterns.
- For booked days, the 31-90 days range is most frequent in Villa Faraldi (42.9%), reflecting common guest stay durations or potential owner blocking patterns.
- A notable 23.8% of properties secure long booking periods (181+ days booked per year), highlighting successful long-term rental strategies or significant owner usage.
Villa Faraldi Airbnb Minimum Stay Requirements Analysis
Distribution of Listings by Minimum Night Requirement
1 Night
2 listings
11.1% of total
2 Nights
4 listings
22.2% of total
3 Nights
2 listings
11.1% of total
4-6 Nights
5 listings
27.8% of total
7-29 Nights
4 listings
22.2% of total
30+ Nights
1 listings
5.6% of total
Key Insights
- The most prevalent minimum stay requirement in Villa Faraldi is 4-6 Nights, adopted by 27.8% of listings. This highlights the market's preference for longer commitments.
Recommendations
- Align with the market by considering a 4-6 Nights minimum stay, as 27.8% of Villa Faraldi hosts use this setting.
- If feasible, allowing 1-night stays, especially midweek or during low season, could capture last-minute bookings, as only 11.1% currently do.
- Explore offering discounts for stays of 30+ nights to attract the 5.6% of the market seeking extended stays.
- Adjust minimum nights based on seasonality – potentially shorter during low season and longer during peak demand periods in Villa Faraldi.
Villa Faraldi Airbnb Cancellation Policy Trends Analysis (2025)
Flexible
6 listings
31.6% of total
Moderate
5 listings
26.3% of total
Strict
8 listings
42.1% of total
Cancellation Policy Insights for Villa Faraldi
- The prevailing Airbnb cancellation policy trend in Villa Faraldi is Strict, used by 42.1% of listings.
- There's a relatively balanced mix between guest-friendly (57.9%) and stricter (42.1%) policies, offering choices for different guest needs.
Recommendations for Hosts
- Consider adopting a Strict policy to align with the 42.1% market standard in Villa Faraldi.
- With 42.1% using Strict terms, this is a viable option in Villa Faraldi, particularly for high-value properties or during peak demand periods.
- Regularly review your cancellation policy against competitors and market demand shifts in Villa Faraldi.
Villa Faraldi STR Booking Lead Time Analysis (2025)
Average Booking Lead Time by Month
Booking Lead Time Insights for Villa Faraldi
- The overall average booking lead time for vacation rentals in Villa Faraldi is 84 days.
- Guests book furthest in advance for stays during December (average 151 days), likely coinciding with peak travel demand or local events.
- The shortest booking windows occur for stays in March (average 67 days), indicating more last-minute travel plans during this time.
- Seasonally, Fall (113 days avg.) sees the longest lead times, while Spring (88 days avg.) has the shortest, reflecting typical travel planning cycles.
Recommendations for Hosts
- Use the overall average lead time (84 days) as a baseline for your pricing and availability strategy in Villa Faraldi.
- For December stays, consider implementing length-of-stay discounts or slightly higher rates for bookings made less than 151 days out to capitalize on advance planning.
- Target marketing efforts for the Fall season well in advance (at least 113 days) to capture early planners.
- Monitor your own booking lead times against these Villa Faraldi averages to identify opportunities for dynamic pricing adjustments.
Popular & Essential Airbnb Amenities in Villa Faraldi (2025)
Amenity Prevalence
Amenity Insights for Villa Faraldi
- Essential amenities in Villa Faraldi that guests expect include: Kitchen, Hot water. Lacking these (any) could significantly impact bookings.
- Popular amenities like Washer, Refrigerator, Free street parking are common but not universal. Offering these can provide a competitive edge.
- Warning: Wifi is not universally provided but is considered essential globally. Ensure reliable Wifi is offered.
Recommendations for Hosts
- Ensure your listing includes all essential amenities for Villa Faraldi: Kitchen, Hot water.
- Prioritize adding missing essentials: Hot water.
- Consider adding popular differentiators like Washer or Refrigerator to increase appeal.
- Highlight unique or less common amenities you offer (e.g., hot tub, dedicated workspace, EV charger) in your listing description and photos.
- Regularly check competitor amenities in Villa Faraldi to stay competitive.
Villa Faraldi Airbnb Guest Demographics & Profile Analysis (2025)
Guest Profile Summary for Villa Faraldi
- The typical guest profile for Airbnb in Villa Faraldi consists of predominantly international visitors (74%), with top international origins including France, typically belonging to the Post-2000s (Gen Z/Alpha) group (50%), primarily speaking English or Italian.
- Domestic travelers account for 26.5% of guests.
- Key international markets include Italy (26.5%) and France (22.5%).
- Top languages spoken are English (36.6%) followed by Italian (16.1%).
- A significant demographic segment is the Post-2000s (Gen Z/Alpha) group, representing 50% of guests.
Recommendations for Hosts
- Focus marketing internationally, particularly towards travelers from France.
- Tailor amenities and listing descriptions to appeal to the dominant Post-2000s (Gen Z/Alpha) demographic (e.g., highlight fast WiFi, smart home features, local guides).
- Highlight unique local experiences or amenities relevant to the primary guest profile.
- Consider seasonal promotions aligned with peak travel times for key origin markets.
Nearby Short-Term Rental Market Comparison
How does the Villa Faraldi Airbnb market stack up against its neighbors? Compare key performance metrics like average monthly revenue, ADR, and occupancy rates in surrounding areas to understand the broader regional STR landscape.
| Market | Active Properties | Monthly Revenue | Daily Rate | Avg. Occupancy |
|---|---|---|---|---|
| Monteu Roero | 16 | $4,432 | $540.14 | 36% |
| Portofino | 68 | $4,086 | $454.35 | 44% |
| Saint-Jean-Cap-Ferrat | 107 | $3,844 | $424.21 | 46% |
| Cossano Belbo | 13 | $3,632 | $284.21 | 42% |
| Cassinasco | 18 | $3,219 | $545.40 | 41% |
| Èze | 153 | $3,168 | $345.84 | 47% |
| Villefranche-sur-Mer | 501 | $2,977 | $268.57 | 52% |
| Monterosso al Mare | 350 | $2,958 | $248.25 | 57% |
| Monaco | 184 | $2,817 | $421.75 | 39% |
| Cap-d'Ail | 175 | $2,795 | $307.97 | 45% |