Vallebona Airbnb Market Analysis 2025: Short Term Rental Data & Vacation Rental Statistics in Liguria, Italy
Is Airbnb profitable in Vallebona in 2025? Explore comprehensive Airbnb analytics for Vallebona, Liguria, Italy to uncover income potential. This 2025 STR market report for Vallebona, based on AirROI data from April 2024 to March 2025, reveals key trends in the niche market of 21 active listings.
Whether you're considering an Airbnb investment in Vallebona, optimizing your existing vacation rental, or exploring rental arbitrage opportunities, understanding the Vallebona Airbnb data is crucial. Navigating the high regulation landscape is key to maximizing your short term rental income potential. Let's dive into the specifics.
Key Vallebona Airbnb Performance Metrics Overview
Monthly Airbnb Revenue Variations & Income Potential in Vallebona (2025)
Understanding the monthly revenue variations for Airbnb listings in Vallebona is key to maximizing your short term rental income potential. Seasonality significantly impacts earnings. Our analysis, based on data from the past 12 months, shows that the peak revenue month for STRs in Vallebona is typically August, while January often presents the lowest earnings, highlighting opportunities for strategic pricing adjustments during shoulder and low seasons. Explore the typical Airbnb income in Vallebona across different performance tiers:
- Best-in-class properties (Top 10%) achieve $2,168+ monthly, often utilizing dynamic pricing and superior guest experiences.
- Strong performing properties (Top 25%) earn $1,571 or more, indicating effective management and desirable locations/amenities.
- Typical properties (Median) generate around $894 per month, representing the average market performance.
- Entry-level properties (Bottom 25%) see earnings around $442, often with potential for optimization.
Average Monthly Airbnb Earnings Trend in Vallebona
Vallebona Airbnb Occupancy Rate Trends (2025)
Maximize your bookings by understanding the Vallebona STR occupancy trends. Seasonal demand shifts significantly influence how often properties are booked. Typically, Augustsees the highest demand (peak season occupancy), while January experiences the lowest (low season). Effective strategies, like adjusting minimum stays or offering promotions, can boost occupancy during slower periods. Here's how different property tiers perform in Vallebona:
- Best-in-class properties (Top 10%) achieve 58%+ occupancy, indicating high desirability and potentially optimized availability.
- Strong performing properties (Top 25%) maintain 41% or higher occupancy, suggesting good market fit and guest satisfaction.
- Typical properties (Median) have an occupancy rate around 23%.
- Entry-level properties (Bottom 25%) average 12% occupancy, potentially facing higher vacancy.
Average Monthly Occupancy Rate Trend in Vallebona
Average Daily Rate (ADR) Airbnb Trends in Vallebona (2025)
Effective short term rental pricing strategy in Vallebona involves understanding monthly ADR fluctuations. The Average Daily Rate (ADR) for Airbnb in Vallebona typically peaks in December and dips lowest during October. Leveraging Airbnb dynamic pricing tools or strategies based on this seasonality can significantly boost revenue. Here's a look at the typical nightly rates achieved:
- Best-in-class properties (Top 10%) command rates of $181+ per night, often due to premium features or locations.
- Strong performing properties (Top 25%) achieve nightly rates of $147 or more.
- Typical properties (Median) charge around $117 per night.
- Entry-level properties (Bottom 25%) earn around $86 per night.
Average Daily Rate (ADR) Trend by Month in Vallebona
Get Live Vallebona Market Intelligence 👇

Explore Real-time Analytics
Airbnb Seasonality Analysis & Trends in Vallebona (2025)
Peak Season (August, July, May)
- Revenue averages $1,810 per month
- Occupancy rates average 45.1%
- Daily rates average $123
Shoulder Season
- Revenue averages $944 per month
- Occupancy maintains around 26.7%
- Daily rates hold near $122
Low Season (January, February, December)
- Revenue drops to average $527 per month
- Occupancy decreases to average 16.2%
- Daily rates adjust to average $126
Seasonality Insights for Vallebona
- The Airbnb seasonality in Vallebona shows highly seasonal trends requiring careful strategy. While the sections above show seasonal averages, it's also insightful to look at the extremes:
- During the high season, the absolute peak month showcases Vallebona's highest earning potential, with monthly revenues capable of climbing to $2,038, occupancy reaching a high of 47.6%, and ADRs peaking at $127.
- Conversely, the slowest single month of the year, typically falling within the low season, marks the market's lowest point. In this month, revenue might dip to $383, occupancy could drop to 11.3%, and ADRs may adjust down to $119.
- Understanding both the seasonal averages and these monthly peaks and troughs in revenue, occupancy, and ADR is crucial for maximizing your Airbnb profit potential in Vallebona.
Seasonal Strategies for Maximizing Profit
- Peak Season: Maximize revenue through premium pricing and potentially longer minimum stays. Ensure high availability.
- Low Season: Offer competitive pricing, special promotions (e.g., extended stay discounts), and flexible cancellation policies. Target off-season travelers like remote workers or budget-conscious guests.
- Shoulder Seasons: Implement dynamic pricing that balances peak and low rates. Target weekend travelers or specific events. Offer slightly more flexible terms than peak season.
- Regularly analyze your own performance against these Vallebona seasonality benchmarks and adjust your pricing and availability strategy accordingly.
Best Areas for Airbnb Investment in Vallebona (2025)
Exploring the top neighborhoods for short-term rentals in Vallebona? This section highlights key areas, outlining why they are attractive for hosts and guests, along with notable local attractions. Consider these locations based on your target guest profile and investment strategy.
| Neighborhood / Area | Why Host Here? (Target Guests & Appeal) | Key Attractions & Landmarks |
|---|---|---|
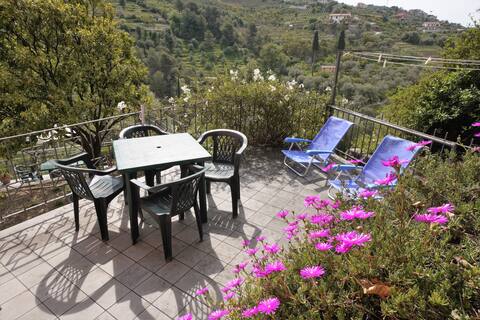
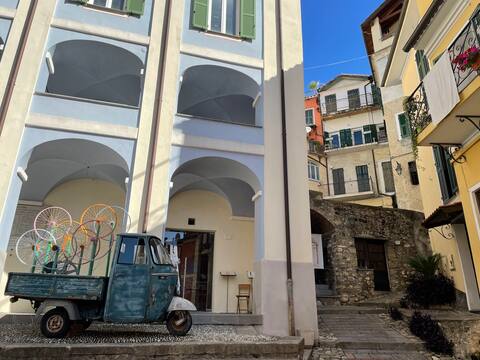
| Centro Storico Vallebona | Charming historical center filled with narrow streets, picturesque views, and local Italian culture. Attracts visitors looking for authentic experiences and beautiful scenery. | Chiesa di San Giovanni Battista, Castello di Vallebona, local artisanal shops, traditional restaurants |
| San Lorenzo al Mare | Lovely coastal area known for its beautiful beaches and seaside promenade. Popular among beachgoers and families looking for a relaxing vacation spot. | San Lorenzo Beach, Biking on the coastal path, Nearby restaurants and cafes, Water sports activities |
| Bordighera | Nearby town offering stunning views, lush gardens, and vibrant nightlife. Attracts tourists seeking a blend of relaxation and cultural activities. | Villa Garnier, Giardino di Villa Regina, Bordighera Beach, Shopping in the town center |
| Ospedaletti | Seaside town known for its warm climate and beautiful coast. Ideal for tourists looking for a quiet retreat near the Ligurian Sea. | Ospedaletti Beach, Promenade along the coast, Nearby hiking trails, Local Italian restaurants |
| Ventimiglia | Historic town near the French border, known for its famous Friday market and beautiful old town. Attracts visitors interested in culture and shopping. | Ventimiglia Market, Old Town Ventimiglia, Roman ruins, Menton nearby attractions |
| Imperia | Larger nearby city with a vibrant cultural scene and beautiful beaches. A good investment opportunity for those looking for diverse attractions. | Museo dell'Olivo, Porto di Imperia, Beaches of Imperia, Shopping and dining options |
| Dolceacqua | Gorgeous medieval village surrounded by vineyards and olive groves. Offers a unique experience for tourists interested in wine and nature. | Castello Doria, Old stone bridge, Wine tasting tours, Vineyard tours and hiking |
| Sanremo | Famous for its casinos, music festival, and botanical gardens. Attracts tourists seeking entertainment, culture, and beach activities. | Casino di Sanremo, Sanremo Music Festival, Russian Church, Gardens and beaches of Sanremo |
Understanding Airbnb License Requirements & STR Laws in Vallebona (2025)
Yes, Vallebona, Liguria, Italy enforces high STR regulations. Obtaining a license and ensuring compliance is almost certainly required according to current 2025 STR laws. Always verify the latest short term rental regulations and Airbnb license requirements directly with local government authorities for Vallebona to ensure full compliance before hosting.
(Source: AirROI data, 2025, based on 43% licensed listings)
Top Performing Airbnb Properties in Vallebona (2025)
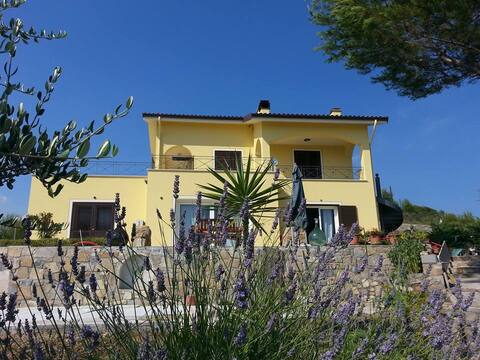
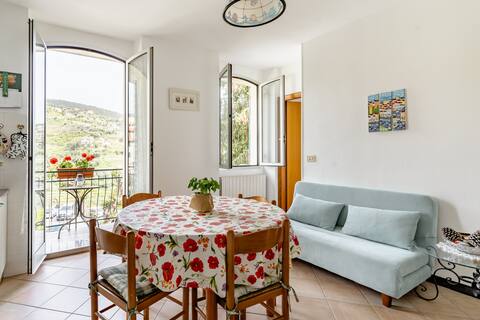
Benchmark your potential! Explore examples of top-performing Airbnb properties in Vallebonabased on Trailing Twelve Month (TTM) revenue. Analyze their characteristics, revenue, occupancy rate, and ADR to understand what drives success in this market.

Villa Clotilde, cute apartment in the green
Entire Place • 2 bedrooms
Menta by Ligurian Life Agriturismo U Ciousu
Entire Place • 1 bedroom

il Mandarino by Interhome
Entire Place • 1 bedroom
Vallebona Apartment il Borgo
Entire Place • 1 bedroom
La Casa del Sole. Tourist location
Entire Place • 1 bedroom
Vallebona beautiful view of the hills and main square
Entire Place • 1 bedroom
Note: Performance varies based on location, size, amenities, seasonality, and management quality. Data reflects the past 12 months.
Top Performing Airbnb Hosts in Vallebona (2025)
Learn from the best! This table showcases top-performing Airbnb hosts in Vallebona based on the number of properties managed and estimated total revenue over the past year. Analyze their scale and performance metrics.
| Host Name | Properties | Grossing Revenue | Stay Reviews | Avg Rating |
|---|---|---|---|---|
| Ligurian Life | 5 | $40,010 | 17 | 1.85/5.0 |
| Franziska | 1 | $20,975 | 46 | 4.89/5.0 |
| Graziella | 3 | $16,849 | 11 | 3.33/5.0 |
| Erika | 2 | $14,543 | 8 | 4.90/5.0 |
| Host #118496386 | 1 | $12,499 | 2 | 0.00/5.0 |
| Jacob | 1 | $11,849 | 7 | 5.00/5.0 |
| Tany | 1 | $11,605 | 35 | 5.00/5.0 |
| Paola | 1 | $11,039 | 78 | 4.99/5.0 |
| Lara | 1 | $6,777 | 21 | 5.00/5.0 |
| Fabio E Alessia | 1 | $4,879 | 13 | 4.92/5.0 |
Analyzing the strategies of top hosts, such as their property selection, pricing, and guest communication, can offer valuable lessons for optimizing your own Airbnb operations in Vallebona.
Dive Deeper: Advanced Vallebona STR Market Data (2025)
Ready to unlock more insights? AirROI provides access to advanced metrics and comprehensive Airbnb data for Vallebona. Explore detailed analytics beyond this report to refine your investment strategy, optimize pricing, and maximize your vacation rental profits.
Explore Advanced MetricsVallebona Short-Term Rental Market Composition (2025): Property & Room Types
Room Type Distribution
Property Type Distribution
Market Composition Insights for Vallebona
- The Vallebona Airbnb market composition is heavily skewed towards Entire Home/Apt listings, which make up 81% of the 21 active rentals. This indicates strong guest preference for privacy and space.
- Looking at the property type distribution in Vallebona, Apartment/Condo properties are the most common (38.1%), reflecting the local real estate landscape.
- Houses represent a significant 38.1% portion, catering likely to families or larger groups.
- Smaller segments like hotel/boutique (combined 4.8%) offer potential for unique stay experiences.
Vallebona Airbnb Room Capacity Analysis (2025): Bedroom Distribution
Distribution of Listings by Number of Bedrooms
Room Capacity Insights for Vallebona
- The dominant room capacity in Vallebona is 1 bedroom listings, making up 57.1% of the market. This suggests a strong demand for properties suitable for couples or solo travelers.
- Together, 1 bedroom and 2 bedrooms properties represent 76.1% of the active Airbnb listings in Vallebona, indicating a high concentration in these sizes.
- With over half the market (57.1%) consisting of studios or 1-bedroom units, Vallebona is particularly well-suited for individuals or couples.
- Listings with 3+ bedrooms (4.8%) represent a smaller niche, potentially indicating an underserved market for larger group accommodations in Vallebona.
Vallebona Vacation Rental Guest Capacity Trends (2025)
Distribution of Listings by Guest Capacity
Guest Capacity Insights for Vallebona
- The most common guest capacity trend in Vallebona vacation rentals is listings accommodating 3 guests (23.8%). This suggests the primary traveler segment is likely small families or groups.
- Properties designed for 3 guests and 4 guests dominate the Vallebona STR market, accounting for 42.8% of listings.
- On average, properties in Vallebona are equipped to host 3.0 guests.
Vallebona Airbnb Booking Patterns (2025): Available vs. Booked Days
Available Days Distribution
Booked Days Distribution
Booking Pattern Insights for Vallebona
- The most common availability pattern in Vallebona falls within the 271-366 days range, representing 71.4% of listings. This suggests many properties have significant open periods on their calendars.
- Approximately 100.0% of listings show high availability (181+ days open annually), indicating potential for increased bookings or specific owner usage patterns.
- For booked days, the 31-90 days range is most frequent in Vallebona (52.4%), reflecting common guest stay durations or potential owner blocking patterns.
Vallebona Airbnb Minimum Stay Requirements Analysis
Distribution of Listings by Minimum Night Requirement
1 Night
3 listings
16.7% of total
2 Nights
2 listings
11.1% of total
3 Nights
7 listings
38.9% of total
4-6 Nights
3 listings
16.7% of total
7-29 Nights
2 listings
11.1% of total
30+ Nights
1 listings
5.6% of total
Key Insights
- The most prevalent minimum stay requirement in Vallebona is 3 Nights, adopted by 38.9% of listings. This highlights the market's preference for longer commitments.
Recommendations
- Align with the market by considering a 3 Nights minimum stay, as 38.9% of Vallebona hosts use this setting.
- If feasible, allowing 1-night stays, especially midweek or during low season, could capture last-minute bookings, as only 16.7% currently do.
- Explore offering discounts for stays of 30+ nights to attract the 5.6% of the market seeking extended stays.
- Adjust minimum nights based on seasonality – potentially shorter during low season and longer during peak demand periods in Vallebona.
Vallebona Airbnb Cancellation Policy Trends Analysis (2025)
Flexible
7 listings
43.8% of total
Moderate
5 listings
31.3% of total
Strict
4 listings
25% of total
Cancellation Policy Insights for Vallebona
- The prevailing Airbnb cancellation policy trend in Vallebona is Flexible, used by 43.8% of listings.
- The market strongly favors guest-friendly terms, with 75.1% of listings offering Flexible or Moderate policies. This suggests guests in Vallebona may expect booking flexibility.
Recommendations for Hosts
- Consider adopting a Flexible policy to align with the 43.8% market standard in Vallebona.
- Regularly review your cancellation policy against competitors and market demand shifts in Vallebona.
Vallebona STR Booking Lead Time Analysis (2025)
Average Booking Lead Time by Month
Booking Lead Time Insights for Vallebona
- The overall average booking lead time for vacation rentals in Vallebona is 48 days.
- Guests book furthest in advance for stays during June (average 90 days), likely coinciding with peak travel demand or local events.
- The shortest booking windows occur for stays in March (average 12 days), indicating more last-minute travel plans during this time.
- Seasonally, Summer (69 days avg.) sees the longest lead times, while Spring (33 days avg.) has the shortest, reflecting typical travel planning cycles.
Recommendations for Hosts
- Use the overall average lead time (48 days) as a baseline for your pricing and availability strategy in Vallebona.
- For June stays, consider implementing length-of-stay discounts or slightly higher rates for bookings made less than 90 days out to capitalize on advance planning.
- During March, focus on last-minute booking availability and promotions, as guests book with very short notice (12 days avg.).
- Target marketing efforts for the Summer season well in advance (at least 69 days) to capture early planners.
- Monitor your own booking lead times against these Vallebona averages to identify opportunities for dynamic pricing adjustments.
Popular & Essential Airbnb Amenities in Vallebona (2025)
Amenity Prevalence
Amenity Insights for Vallebona
- Popular amenities like Heating, Wifi, Hair dryer are common but not universal. Offering these can provide a competitive edge.
- Warning: Wifi is not universally provided but is considered essential globally. Ensure reliable Wifi is offered.
Recommendations for Hosts
- Consider adding popular differentiators like Heating or Wifi to increase appeal.
- Highlight unique or less common amenities you offer (e.g., hot tub, dedicated workspace, EV charger) in your listing description and photos.
- Regularly check competitor amenities in Vallebona to stay competitive.
Vallebona Airbnb Guest Demographics & Profile Analysis (2025)
Guest Profile Summary for Vallebona
- The typical guest profile for Airbnb in Vallebona consists of predominantly international visitors (92%), with top international origins including Germany, typically belonging to the Post-2000s (Gen Z/Alpha) group (50%), primarily speaking English or French.
- Domestic travelers account for 8.2% of guests.
- Key international markets include France (31.1%) and Germany (18%).
- Top languages spoken are English (36.9%) followed by French (20.2%).
- A significant demographic segment is the Post-2000s (Gen Z/Alpha) group, representing 50% of guests.
Recommendations for Hosts
- Focus marketing internationally, particularly towards travelers from Germany.
- Tailor amenities and listing descriptions to appeal to the dominant Post-2000s (Gen Z/Alpha) demographic (e.g., highlight fast WiFi, smart home features, local guides).
- Highlight unique local experiences or amenities relevant to the primary guest profile.
- Consider seasonal promotions aligned with peak travel times for key origin markets.
Nearby Short-Term Rental Market Comparison
How does the Vallebona Airbnb market stack up against its neighbors? Compare key performance metrics like average monthly revenue, ADR, and occupancy rates in surrounding areas to understand the broader regional STR landscape.
| Market | Active Properties | Monthly Revenue | Daily Rate | Avg. Occupancy |
|---|---|---|---|---|
| Monteu Roero | 16 | $4,432 | $540.14 | 36% |
| Ramatuelle | 213 | $3,891 | $670.10 | 41% |
| Saint-Jean-Cap-Ferrat | 107 | $3,844 | $424.21 | 46% |
| Cossano Belbo | 13 | $3,632 | $284.21 | 42% |
| Saint-Tropez | 742 | $3,498 | $506.57 | 41% |
| Cassinasco | 18 | $3,219 | $545.40 | 41% |
| Èze | 153 | $3,168 | $345.84 | 47% |
| Opio | 40 | $3,057 | $540.62 | 37% |
| Villefranche-sur-Mer | 501 | $2,977 | $268.57 | 52% |
| Gassin | 384 | $2,939 | $434.44 | 40% |