Savona Airbnb Market Analysis 2025: Short Term Rental Data & Vacation Rental Statistics in Liguria, Italy
Is Airbnb profitable in Savona in 2025? Explore comprehensive Airbnb analytics for Savona, Liguria, Italy to uncover income potential. This 2025 STR market report for Savona, based on AirROI data from April 2024 to March 2025, reveals key trends in the market of 226 active listings.
Whether you're considering an Airbnb investment in Savona, optimizing your existing vacation rental, or exploring rental arbitrage opportunities, understanding the Savona Airbnb data is crucial. Navigating the high regulation landscape is key to maximizing your short term rental income potential. Let's dive into the specifics.
Key Savona Airbnb Performance Metrics Overview
Monthly Airbnb Revenue Variations & Income Potential in Savona (2025)
Understanding the monthly revenue variations for Airbnb listings in Savona is key to maximizing your short term rental income potential. Seasonality significantly impacts earnings. Our analysis, based on data from the past 12 months, shows that the peak revenue month for STRs in Savona is typically August, while November often presents the lowest earnings, highlighting opportunities for strategic pricing adjustments during shoulder and low seasons. Explore the typical Airbnb income in Savona across different performance tiers:
- Best-in-class properties (Top 10%) achieve $2,976+ monthly, often utilizing dynamic pricing and superior guest experiences.
- Strong performing properties (Top 25%) earn $2,018 or more, indicating effective management and desirable locations/amenities.
- Typical properties (Median) generate around $1,221 per month, representing the average market performance.
- Entry-level properties (Bottom 25%) see earnings around $660, often with potential for optimization.
Average Monthly Airbnb Earnings Trend in Savona
Savona Airbnb Occupancy Rate Trends (2025)
Maximize your bookings by understanding the Savona STR occupancy trends. Seasonal demand shifts significantly influence how often properties are booked. Typically, Augustsees the highest demand (peak season occupancy), while November experiences the lowest (low season). Effective strategies, like adjusting minimum stays or offering promotions, can boost occupancy during slower periods. Here's how different property tiers perform in Savona:
- Best-in-class properties (Top 10%) achieve 69%+ occupancy, indicating high desirability and potentially optimized availability.
- Strong performing properties (Top 25%) maintain 52% or higher occupancy, suggesting good market fit and guest satisfaction.
- Typical properties (Median) have an occupancy rate around 32%.
- Entry-level properties (Bottom 25%) average 17% occupancy, potentially facing higher vacancy.
Average Monthly Occupancy Rate Trend in Savona
Average Daily Rate (ADR) Airbnb Trends in Savona (2025)
Effective short term rental pricing strategy in Savona involves understanding monthly ADR fluctuations. The Average Daily Rate (ADR) for Airbnb in Savona typically peaks in August and dips lowest during November. Leveraging Airbnb dynamic pricing tools or strategies based on this seasonality can significantly boost revenue. Here's a look at the typical nightly rates achieved:
- Best-in-class properties (Top 10%) command rates of $193+ per night, often due to premium features or locations.
- Strong performing properties (Top 25%) achieve nightly rates of $141 or more.
- Typical properties (Median) charge around $107 per night.
- Entry-level properties (Bottom 25%) earn around $81 per night.
Average Daily Rate (ADR) Trend by Month in Savona
Get Live Savona Market Intelligence 👇

Explore Real-time Analytics
Airbnb Seasonality Analysis & Trends in Savona (2025)
Peak Season (August, July, June)
- Revenue averages $2,514 per month
- Occupancy rates average 53.0%
- Daily rates average $131
Shoulder Season
- Revenue averages $1,382 per month
- Occupancy maintains around 32.3%
- Daily rates hold near $123
Low Season (January, February, November)
- Revenue drops to average $826 per month
- Occupancy decreases to average 25.8%
- Daily rates adjust to average $123
Seasonality Insights for Savona
- The Airbnb seasonality in Savona shows highly seasonal trends requiring careful strategy. While the sections above show seasonal averages, it's also insightful to look at the extremes:
- During the high season, the absolute peak month showcases Savona's highest earning potential, with monthly revenues capable of climbing to $2,867, occupancy reaching a high of 63.5%, and ADRs peaking at $135.
- Conversely, the slowest single month of the year, typically falling within the low season, marks the market's lowest point. In this month, revenue might dip to $775, occupancy could drop to 24.5%, and ADRs may adjust down to $119.
- Understanding both the seasonal averages and these monthly peaks and troughs in revenue, occupancy, and ADR is crucial for maximizing your Airbnb profit potential in Savona.
Seasonal Strategies for Maximizing Profit
- Peak Season: Maximize revenue through premium pricing and potentially longer minimum stays. Ensure high availability.
- Low Season: Offer competitive pricing, special promotions (e.g., extended stay discounts), and flexible cancellation policies. Target off-season travelers like remote workers or budget-conscious guests.
- Shoulder Seasons: Implement dynamic pricing that balances peak and low rates. Target weekend travelers or specific events. Offer slightly more flexible terms than peak season.
- Regularly analyze your own performance against these Savona seasonality benchmarks and adjust your pricing and availability strategy accordingly.
Best Areas for Airbnb Investment in Savona (2025)
Exploring the top neighborhoods for short-term rentals in Savona? This section highlights key areas, outlining why they are attractive for hosts and guests, along with notable local attractions. Consider these locations based on your target guest profile and investment strategy.
| Neighborhood / Area | Why Host Here? (Target Guests & Appeal) | Key Attractions & Landmarks |
|---|---|---|
| Savona City Center | The vibrant heart of Savona, filled with shops, restaurants, and cultural attractions, making it a popular choice for tourists and travelers. | Savona Cathedral, Palazzo della Rovere, Torretta di Savona, Museo della Ceramica, Piazza Mameli |
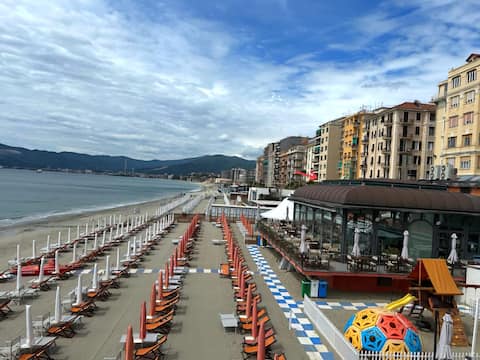
| Vado Ligure | A charming coastal town near Savona with beautiful beaches and a quaint harbor, ideal for those looking to relax by the sea. | Vado Ligure Beach, Bagni Lido, Castello di Vado Ligure, Piazza Giuseppe Mazzini |
| Finale Ligure | Known for its stunning beaches and vibrant outdoor activities, Finale Ligure attracts tourists looking for adventure and relaxation. | Finale Ligure Beach, Finalborgo, Castello di Finale, Via Ferrata, Parco Nazionale del Beigua |
| Albissola Marina | A picturesque town known for its artisanal ceramics and beautiful waterfront, perfect for guests who appreciate culture and history. | Ceramics Museum, Piazza della Libertà, Albissola Beach, Fornace Fontana, Villa Mazzucotelli |
| Loano | A lovely town with sandy beaches and a lively promenade, popular among families and beachgoers during the summer months. | Loano Beach, Promenade of Loano, Castello Borelli, Parco del Sole |
| Borghetto Santo Spirito | A small coastal village known for its peaceful atmosphere and lovely beaches, attracting visitors seeking tranquility. | Borghetto Beach, Piazza della Vittoria, Molo di Borghetto |
| Toirano | Famous for its stunning caves and natural beauty, Toirano draws in nature lovers and tourists interested in exploration. | Toirano Caves, Santuario della Natività di Maria, Toirano Village, Borgo Toirano |
| Noli | A historical seaside town with charming medieval architecture and beautiful beaches, perfect for a romantic getaway. | Noli Beach, Castello di Noli, Santuario di Nostra Signora delle Grazie, Piazza Milite Ignoto |
Understanding Airbnb License Requirements & STR Laws in Savona (2025)
Yes, Savona, Liguria, Italy enforces high STR regulations. Obtaining a license and ensuring compliance is almost certainly required according to current 2025 STR laws. Always verify the latest short term rental regulations and Airbnb license requirements directly with local government authorities for Savona to ensure full compliance before hosting.
(Source: AirROI data, 2025, based on 61% licensed listings)
Top Performing Airbnb Properties in Savona (2025)
Benchmark your potential! Explore examples of top-performing Airbnb properties in Savonabased on Trailing Twelve Month (TTM) revenue. Analyze their characteristics, revenue, occupancy rate, and ADR to understand what drives success in this market.

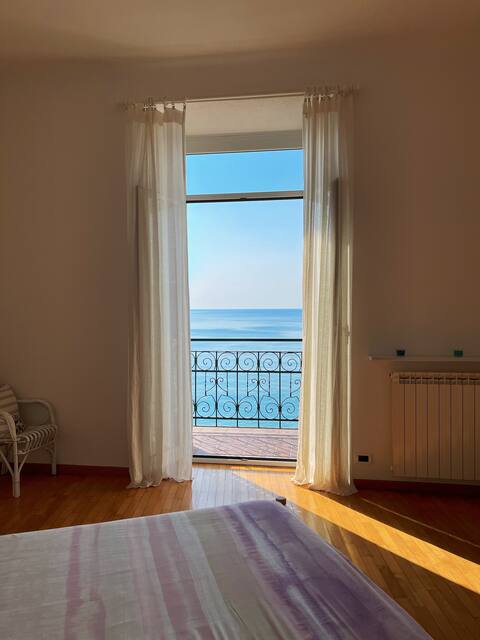
Casa Vikont first row sea
Entire Place • 3 bedrooms
![[Luxury in Old Town] - Port and Cruises 2 min](https://a0.muscache.com/im/pictures/miso/Hosting-942074637174353233/original/e6494619-943f-40c0-add9-2886220ce3e3.jpeg?im_w=480&im_format=avif)
[Luxury in Old Town] - Port and Cruises 2 min
Entire Place • 1 bedroom
Apartment Fronte Mare Savona. first row
Entire Place • 1 bedroom

FurnaxSea 2 - Studio - Beachfront
Entire Place • N/A
CasAmare di Carla
Entire Place • 2 bedrooms
![[Duomo Savona] Cruises - Downtown - Disney+ - WiFi](https://a0.muscache.com/im/pictures/miso/Hosting-1121629338759416686/original/6e9d10d8-b827-46ae-af3f-3782b9be6733.jpeg?im_w=480&im_format=avif)
[Duomo Savona] Cruises - Downtown - Disney+ - WiFi
Entire Place • 2 bedrooms
Note: Performance varies based on location, size, amenities, seasonality, and management quality. Data reflects the past 12 months.
Top Performing Airbnb Hosts in Savona (2025)
Learn from the best! This table showcases top-performing Airbnb hosts in Savona based on the number of properties managed and estimated total revenue over the past year. Analyze their scale and performance metrics.
| Host Name | Properties | Grossing Revenue | Stay Reviews | Avg Rating |
|---|---|---|---|---|
| Giovanni | 8 | $176,230 | 63 | 2.63/5.0 |
| Lennie | 6 | $84,929 | 238 | 4.81/5.0 |
| Livio | 3 | $80,039 | 14 | 3.33/5.0 |
| Wonderful Italy Liguria | 5 | $62,615 | 10 | 1.84/5.0 |
| Edmond | 1 | $62,457 | 31 | 4.97/5.0 |
| Vale | 1 | $45,000 | 9 | 4.89/5.0 |
| Isolina | 5 | $42,287 | 270 | 4.84/5.0 |
| Massimiliano E Patricia | 2 | $40,581 | 59 | 4.68/5.0 |
| Alessandro | 1 | $37,932 | 35 | 4.94/5.0 |
| Sara | 2 | $37,931 | 42 | 5.00/5.0 |
Analyzing the strategies of top hosts, such as their property selection, pricing, and guest communication, can offer valuable lessons for optimizing your own Airbnb operations in Savona.
Dive Deeper: Advanced Savona STR Market Data (2025)
Ready to unlock more insights? AirROI provides access to advanced metrics and comprehensive Airbnb data for Savona. Explore detailed analytics beyond this report to refine your investment strategy, optimize pricing, and maximize your vacation rental profits.
Explore Advanced MetricsSavona Short-Term Rental Market Composition (2025): Property & Room Types
Room Type Distribution
Property Type Distribution
Market Composition Insights for Savona
- The Savona Airbnb market composition is heavily skewed towards Entire Home/Apt listings, which make up 93.4% of the 226 active rentals. This indicates strong guest preference for privacy and space.
- Looking at the property type distribution in Savona, Apartment/Condo properties are the most common (87.2%), reflecting the local real estate landscape.
- Smaller segments like hotel/boutique (combined 2.2%) offer potential for unique stay experiences.
Savona Airbnb Room Capacity Analysis (2025): Bedroom Distribution
Distribution of Listings by Number of Bedrooms
Room Capacity Insights for Savona
- The dominant room capacity in Savona is 1 bedroom listings, making up 44.7% of the market. This suggests a strong demand for properties suitable for couples or solo travelers.
- Together, 1 bedroom and 2 bedrooms properties represent 83.2% of the active Airbnb listings in Savona, indicating a high concentration in these sizes.
- Listings with 3+ bedrooms (8.0%) represent a smaller niche, potentially indicating an underserved market for larger group accommodations in Savona.
Savona Vacation Rental Guest Capacity Trends (2025)
Distribution of Listings by Guest Capacity
Guest Capacity Insights for Savona
- The most common guest capacity trend in Savona vacation rentals is listings accommodating 4 guests (38.9%). This suggests the primary traveler segment is likely small families or groups.
- Properties designed for 4 guests and 6 guests dominate the Savona STR market, accounting for 56.6% of listings.
- 21.2% of properties accommodate 6+ guests, serving the market segment for larger families or group travel in Savona.
- On average, properties in Savona are equipped to host 4.0 guests.
Savona Airbnb Booking Patterns (2025): Available vs. Booked Days
Available Days Distribution
Booked Days Distribution
Booking Pattern Insights for Savona
- The most common availability pattern in Savona falls within the 271-366 days range, representing 56.6% of listings. This suggests many properties have significant open periods on their calendars.
- Approximately 91.6% of listings show high availability (181+ days open annually), indicating potential for increased bookings or specific owner usage patterns.
- For booked days, the 91-180 days range is most frequent in Savona (35.8%), reflecting common guest stay durations or potential owner blocking patterns.
- A notable 9.7% of properties secure long booking periods (181+ days booked per year), highlighting successful long-term rental strategies or significant owner usage.
Savona Airbnb Minimum Stay Requirements Analysis
Distribution of Listings by Minimum Night Requirement
1 Night
53 listings
25.7% of total
2 Nights
60 listings
29.1% of total
3 Nights
28 listings
13.6% of total
4-6 Nights
11 listings
5.3% of total
7-29 Nights
24 listings
11.7% of total
30+ Nights
30 listings
14.6% of total
Key Insights
- The most prevalent minimum stay requirement in Savona is 2 Nights, adopted by 29.1% of listings. This highlights the market's preference for shorter, flexible bookings.
- A significant segment (14.6%) caters to monthly stays (30+ nights) in Savona, pointing to opportunities in the extended-stay market.
Recommendations
- Align with the market by considering a 2 Nights minimum stay, as 29.1% of Savona hosts use this setting.
- If feasible, allowing 1-night stays, especially midweek or during low season, could capture last-minute bookings, as only 25.7% currently do.
- Explore offering discounts for stays of 30+ nights to attract the 14.6% of the market seeking extended stays.
- Adjust minimum nights based on seasonality – potentially shorter during low season and longer during peak demand periods in Savona.
Savona Airbnb Cancellation Policy Trends Analysis (2025)
Super Strict 30 Days
7 listings
4.3% of total
Flexible
54 listings
33.5% of total
Moderate
63 listings
39.1% of total
Strict
37 listings
23% of total
Cancellation Policy Insights for Savona
- The prevailing Airbnb cancellation policy trend in Savona is Moderate, used by 39.1% of listings.
- The market strongly favors guest-friendly terms, with 72.6% of listings offering Flexible or Moderate policies. This suggests guests in Savona may expect booking flexibility.
Recommendations for Hosts
- Consider adopting a Moderate policy to align with the 39.1% market standard in Savona.
- Regularly review your cancellation policy against competitors and market demand shifts in Savona.
Savona STR Booking Lead Time Analysis (2025)
Average Booking Lead Time by Month
Booking Lead Time Insights for Savona
- The overall average booking lead time for vacation rentals in Savona is 40 days.
- Guests book furthest in advance for stays during July (average 75 days), likely coinciding with peak travel demand or local events.
- The shortest booking windows occur for stays in December (average 23 days), indicating more last-minute travel plans during this time.
- Seasonally, Summer (68 days avg.) sees the longest lead times, while Winter (24 days avg.) has the shortest, reflecting typical travel planning cycles.
Recommendations for Hosts
- Use the overall average lead time (40 days) as a baseline for your pricing and availability strategy in Savona.
- For July stays, consider implementing length-of-stay discounts or slightly higher rates for bookings made less than 75 days out to capitalize on advance planning.
- Target marketing efforts for the Summer season well in advance (at least 68 days) to capture early planners.
- Monitor your own booking lead times against these Savona averages to identify opportunities for dynamic pricing adjustments.
Popular & Essential Airbnb Amenities in Savona (2025)
Amenity Prevalence
Amenity Insights for Savona
- Essential amenities in Savona that guests expect include: Kitchen, Heating. Lacking these (any) could significantly impact bookings.
- Popular amenities like TV, Essentials, Hot water are common but not universal. Offering these can provide a competitive edge.
- Warning: Wifi is not universally provided but is considered essential globally. Ensure reliable Wifi is offered.
Recommendations for Hosts
- Ensure your listing includes all essential amenities for Savona: Kitchen, Heating.
- Prioritize adding missing essentials: Kitchen, Heating.
- Consider adding popular differentiators like TV or Essentials to increase appeal.
- Highlight unique or less common amenities you offer (e.g., hot tub, dedicated workspace, EV charger) in your listing description and photos.
- Regularly check competitor amenities in Savona to stay competitive.
Savona Airbnb Guest Demographics & Profile Analysis (2025)
Guest Profile Summary for Savona
- The typical guest profile for Airbnb in Savona consists of a mix of domestic (37%) and international guests, with top international origins including France, typically belonging to the Post-2000s (Gen Z/Alpha) group (50%), primarily speaking English or Italian.
- Domestic travelers account for 37.0% of guests.
- Key international markets include Italy (37%) and France (15.9%).
- Top languages spoken are English (34.8%) followed by Italian (18.5%).
- A significant demographic segment is the Post-2000s (Gen Z/Alpha) group, representing 50% of guests.
Recommendations for Hosts
- Focus marketing internationally, particularly towards travelers from France.
- Tailor amenities and listing descriptions to appeal to the dominant Post-2000s (Gen Z/Alpha) demographic (e.g., highlight fast WiFi, smart home features, local guides).
- Highlight unique local experiences or amenities relevant to the primary guest profile.
- Consider seasonal promotions aligned with peak travel times for key origin markets.
Nearby Short-Term Rental Market Comparison
How does the Savona Airbnb market stack up against its neighbors? Compare key performance metrics like average monthly revenue, ADR, and occupancy rates in surrounding areas to understand the broader regional STR landscape.
| Market | Active Properties | Monthly Revenue | Daily Rate | Avg. Occupancy |
|---|---|---|---|---|
| Laglio | 64 | $4,873 | $463.61 | 47% |
| Monteu Roero | 16 | $4,432 | $540.14 | 36% |
| Portofino | 68 | $4,086 | $454.35 | 44% |
| Saint-Jean-Cap-Ferrat | 107 | $3,844 | $424.21 | 46% |
| Sala Comacina | 64 | $3,794 | $400.27 | 50% |
| Cossano Belbo | 13 | $3,632 | $284.21 | 42% |
| Bellagio | 373 | $3,630 | $328.26 | 55% |
| Oliveto Lario | 99 | $3,509 | $327.42 | 55% |
| Carate Urio | 71 | $3,379 | $331.90 | 44% |
| Brienno | 39 | $3,327 | $337.92 | 45% |