Lerici Airbnb Market Analysis 2025: Short Term Rental Data & Vacation Rental Statistics in Liguria, Italy
Is Airbnb profitable in Lerici in 2025? Explore comprehensive Airbnb analytics for Lerici, Liguria, Italy to uncover income potential. This 2025 STR market report for Lerici, based on AirROI data from April 2024 to March 2025, reveals key trends in the market of 462 active listings.
Whether you're considering an Airbnb investment in Lerici, optimizing your existing vacation rental, or exploring rental arbitrage opportunities, understanding the Lerici Airbnb data is crucial. Navigating the high regulation landscape is key to maximizing your short term rental income potential. Let's dive into the specifics.
Key Lerici Airbnb Performance Metrics Overview
Monthly Airbnb Revenue Variations & Income Potential in Lerici (2025)
Understanding the monthly revenue variations for Airbnb listings in Lerici is key to maximizing your short term rental income potential. Seasonality significantly impacts earnings. Our analysis, based on data from the past 12 months, shows that the peak revenue month for STRs in Lerici is typically August, while February often presents the lowest earnings, highlighting opportunities for strategic pricing adjustments during shoulder and low seasons. Explore the typical Airbnb income in Lerici across different performance tiers:
- Best-in-class properties (Top 10%) achieve $4,564+ monthly, often utilizing dynamic pricing and superior guest experiences.
- Strong performing properties (Top 25%) earn $2,890 or more, indicating effective management and desirable locations/amenities.
- Typical properties (Median) generate around $1,751 per month, representing the average market performance.
- Entry-level properties (Bottom 25%) see earnings around $896, often with potential for optimization.
Average Monthly Airbnb Earnings Trend in Lerici
Lerici Airbnb Occupancy Rate Trends (2025)
Maximize your bookings by understanding the Lerici STR occupancy trends. Seasonal demand shifts significantly influence how often properties are booked. Typically, Augustsees the highest demand (peak season occupancy), while March experiences the lowest (low season). Effective strategies, like adjusting minimum stays or offering promotions, can boost occupancy during slower periods. Here's how different property tiers perform in Lerici:
- Best-in-class properties (Top 10%) achieve 71%+ occupancy, indicating high desirability and potentially optimized availability.
- Strong performing properties (Top 25%) maintain 55% or higher occupancy, suggesting good market fit and guest satisfaction.
- Typical properties (Median) have an occupancy rate around 34%.
- Entry-level properties (Bottom 25%) average 17% occupancy, potentially facing higher vacancy.
Average Monthly Occupancy Rate Trend in Lerici
Average Daily Rate (ADR) Airbnb Trends in Lerici (2025)
Effective short term rental pricing strategy in Lerici involves understanding monthly ADR fluctuations. The Average Daily Rate (ADR) for Airbnb in Lerici typically peaks in August and dips lowest during January. Leveraging Airbnb dynamic pricing tools or strategies based on this seasonality can significantly boost revenue. Here's a look at the typical nightly rates achieved:
- Best-in-class properties (Top 10%) command rates of $316+ per night, often due to premium features or locations.
- Strong performing properties (Top 25%) achieve nightly rates of $192 or more.
- Typical properties (Median) charge around $141 per night.
- Entry-level properties (Bottom 25%) earn around $108 per night.
Average Daily Rate (ADR) Trend by Month in Lerici
Get Live Lerici Market Intelligence 👇

Explore Real-time Analytics
Airbnb Seasonality Analysis & Trends in Lerici (2025)
Peak Season (August, July, June)
- Revenue averages $3,821 per month
- Occupancy rates average 57.6%
- Daily rates average $207
Shoulder Season
- Revenue averages $2,105 per month
- Occupancy maintains around 35.7%
- Daily rates hold near $190
Low Season (January, February, March)
- Revenue drops to average $893 per month
- Occupancy decreases to average 20.6%
- Daily rates adjust to average $186
Seasonality Insights for Lerici
- The Airbnb seasonality in Lerici shows highly seasonal trends requiring careful strategy. While the sections above show seasonal averages, it's also insightful to look at the extremes:
- During the high season, the absolute peak month showcases Lerici's highest earning potential, with monthly revenues capable of climbing to $4,189, occupancy reaching a high of 66.9%, and ADRs peaking at $210.
- Conversely, the slowest single month of the year, typically falling within the low season, marks the market's lowest point. In this month, revenue might dip to $829, occupancy could drop to 19.3%, and ADRs may adjust down to $179.
- Understanding both the seasonal averages and these monthly peaks and troughs in revenue, occupancy, and ADR is crucial for maximizing your Airbnb profit potential in Lerici.
Seasonal Strategies for Maximizing Profit
- Peak Season: Maximize revenue through premium pricing and potentially longer minimum stays. Ensure high availability.
- Low Season: Offer competitive pricing, special promotions (e.g., extended stay discounts), and flexible cancellation policies. Target off-season travelers like remote workers or budget-conscious guests.
- Shoulder Seasons: Implement dynamic pricing that balances peak and low rates. Target weekend travelers or specific events. Offer slightly more flexible terms than peak season.
- Regularly analyze your own performance against these Lerici seasonality benchmarks and adjust your pricing and availability strategy accordingly.
Best Areas for Airbnb Investment in Lerici (2025)
Exploring the top neighborhoods for short-term rentals in Lerici? This section highlights key areas, outlining why they are attractive for hosts and guests, along with notable local attractions. Consider these locations based on your target guest profile and investment strategy.
| Neighborhood / Area | Why Host Here? (Target Guests & Appeal) | Key Attractions & Landmarks |
|---|---|---|
| Lerici Beach | Lerici Beach is a picturesque coastal area attracting sun-seekers and vacationers due to its beautiful sandy shores and warm Mediterranean climate. It is ideal for families and couples looking for a relaxing getaway. | Lerici Castle, San Terenzo Beach, Porto di Lerici, Cala Mariani, Casa di Shelley |
| San Terenzo | This charming village is known for its quaint atmosphere and scenic views of the coastline. It offers a more laid-back experience, perfect for tourists wanting a quiet beach destination. | San Terenzo Castle, Lerici Promenade, Beachfront restaurants, Nature trails, Local artisan shops |
| Tellaro | A picturesque fishing village recognized for its stunning views and traditional Ligurian architecture. It draws visitors who wish to experience authentic local culture and beautiful scenery. | Tellaro Church, Scenic viewpoints, Local seafood restaurants, Walking trails, Art galleries |
| La Spezia | A larger nearby city that makes for a great base for exploring Lerici and the Cinque Terre. It offers urban amenities along with nearby coastal attractions, appealing to both tourists and business travelers. | La Spezia Maritime Museum, Castello di San Giorgio, Piazza Garibaldi, Shopping avenues, Cinque Terre ferry access |
| Portovenere | A UNESCO World Heritage site, known for its stunning landscapes and historical sites. A perfect day trip from Lerici, attracting visitors interested in history and natural beauty. | Church of St. Peter, Portovenere Castle, Palmaria Island, The Doria Castle, St. Lawrence Church |
| Golf Club Marigola | Attracting golf enthusiasts and nature lovers, this area boasts an excellent golf course with breathtaking views over the Ligurian Sea. It's a unique getaway for those looking for outdoor activities. | 18-hole golf course, Scenic picnic areas, Clubhouse dining, Nature views, Nearby hiking trails |
| Fiascherino | A serene location offering stunning natural beauty and crystal-clear waters. It’s popular among eco-tourists and those looking for a peaceful retreat away from the crowds. | Fiascherino Beach, Nature reserves, Snorkeling spots, Trails to Lerici, Local eateries |
| Castello di Lerici | Historic castle with panoramic views of the Gulf of Poets. An attractive location for visitors interested in history and photography, providing a unique backdrop for their stay. | Historical architecture, Guided tours of the castle, Cultural events, Photography opportunities, Viewpoint over the coast |
Understanding Airbnb License Requirements & STR Laws in Lerici (2025)
Yes, Lerici, Liguria, Italy enforces high STR regulations. Obtaining a license and ensuring compliance is almost certainly required according to current 2025 STR laws. Always verify the latest short term rental regulations and Airbnb license requirements directly with local government authorities for Lerici to ensure full compliance before hosting.
(Source: AirROI data, 2025, based on 68% licensed listings)
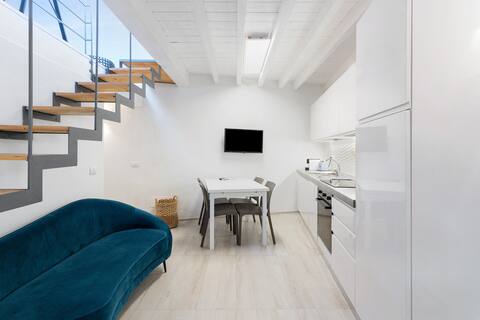
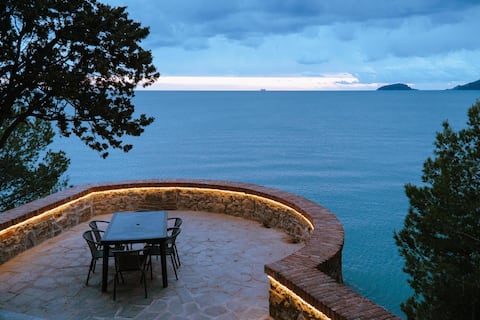
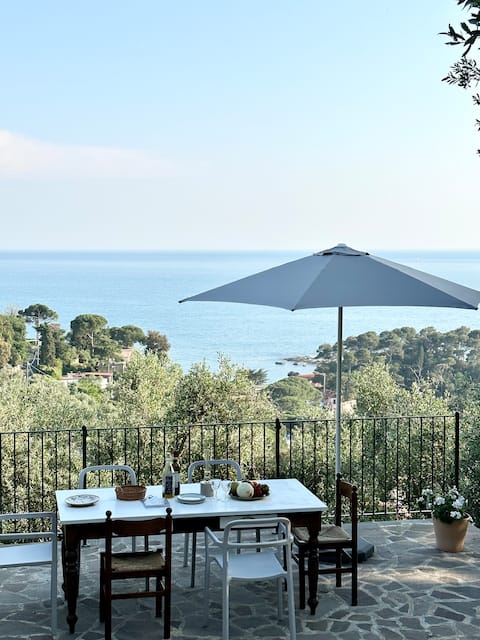
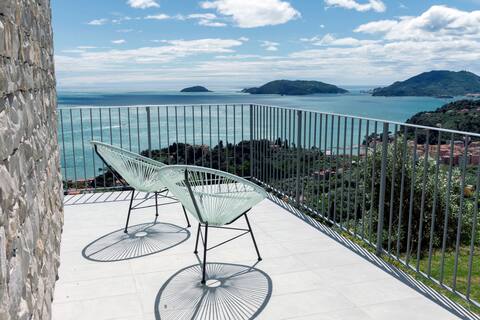
Top Performing Airbnb Properties in Lerici (2025)
Benchmark your potential! Explore examples of top-performing Airbnb properties in Lericibased on Trailing Twelve Month (TTM) revenue. Analyze their characteristics, revenue, occupancy rate, and ADR to understand what drives success in this market.

LUXURY VILLA-HEATED POOL-JACUZZI-A/C-near thebeach
Entire Place • 3 bedrooms
Casa Carla
Entire Place • 2 bedrooms
The Castle Suite
Entire Place • 1 bedroom

Villa La Perla
Entire Place • 4 bedrooms
Stonehouse in olive grove with stunning sea view.
Entire Place • 3 bedrooms
Pool, Tennis, Parking and Free Car Spot in Lerici
Entire Place • 2 bedrooms
Note: Performance varies based on location, size, amenities, seasonality, and management quality. Data reflects the past 12 months.
Top Performing Airbnb Hosts in Lerici (2025)
Learn from the best! This table showcases top-performing Airbnb hosts in Lerici based on the number of properties managed and estimated total revenue over the past year. Analyze their scale and performance metrics.
| Host Name | Properties | Grossing Revenue | Stay Reviews | Avg Rating |
|---|---|---|---|---|
| Convista | 19 | $396,861 | 120 | 2.46/5.0 |
| Cristina | 5 | $328,083 | 269 | 4.91/5.0 |
| Casper | 5 | $258,556 | 360 | 4.86/5.0 |
| Giada | 15 | $243,375 | 163 | 3.58/5.0 |
| Terre | 14 | $222,349 | 131 | 3.14/5.0 |
| Luca | 18 | $218,891 | 173 | 2.86/5.0 |
| Welcome To Liguria | 9 | $190,875 | 115 | 4.29/5.0 |
| Lola, | 6 | $171,552 | 386 | 4.95/5.0 |
| Ottavio | 4 | $170,786 | 206 | 4.94/5.0 |
| Mytouristhome® | 9 | $169,259 | 104 | 2.59/5.0 |
Analyzing the strategies of top hosts, such as their property selection, pricing, and guest communication, can offer valuable lessons for optimizing your own Airbnb operations in Lerici.
Dive Deeper: Advanced Lerici STR Market Data (2025)
Ready to unlock more insights? AirROI provides access to advanced metrics and comprehensive Airbnb data for Lerici. Explore detailed analytics beyond this report to refine your investment strategy, optimize pricing, and maximize your vacation rental profits.
Explore Advanced MetricsLerici Short-Term Rental Market Composition (2025): Property & Room Types
Room Type Distribution
Property Type Distribution
Market Composition Insights for Lerici
- The Lerici Airbnb market composition is heavily skewed towards Entire Home/Apt listings, which make up 94.4% of the 462 active rentals. This indicates strong guest preference for privacy and space.
- Looking at the property type distribution in Lerici, Apartment/Condo properties are the most common (68.8%), reflecting the local real estate landscape.
- Houses represent a significant 27.5% portion, catering likely to families or larger groups.
- Smaller segments like hotel/boutique, outdoor/unique, others (combined 3.7%) offer potential for unique stay experiences.
Lerici Airbnb Room Capacity Analysis (2025): Bedroom Distribution
Distribution of Listings by Number of Bedrooms
Room Capacity Insights for Lerici
- The dominant room capacity in Lerici is 1 bedroom listings, making up 46.8% of the market. This suggests a strong demand for properties suitable for couples or solo travelers.
- Together, 1 bedroom and 2 bedrooms properties represent 81.4% of the active Airbnb listings in Lerici, indicating a high concentration in these sizes.
Lerici Vacation Rental Guest Capacity Trends (2025)
Distribution of Listings by Guest Capacity
Guest Capacity Insights for Lerici
- The most common guest capacity trend in Lerici vacation rentals is listings accommodating 4 guests (41.6%). This suggests the primary traveler segment is likely small families or groups.
- Properties designed for 4 guests and 6 guests dominate the Lerici STR market, accounting for 55.5% of listings.
- 20.2% of properties accommodate 6+ guests, serving the market segment for larger families or group travel in Lerici.
- On average, properties in Lerici are equipped to host 4.1 guests.
Lerici Airbnb Booking Patterns (2025): Available vs. Booked Days
Available Days Distribution
Booked Days Distribution
Booking Pattern Insights for Lerici
- The most common availability pattern in Lerici falls within the 271-366 days range, representing 49.6% of listings. This suggests many properties have significant open periods on their calendars.
- Approximately 87.5% of listings show high availability (181+ days open annually), indicating potential for increased bookings or specific owner usage patterns.
- For booked days, the 91-180 days range is most frequent in Lerici (38.5%), reflecting common guest stay durations or potential owner blocking patterns.
- A notable 13.4% of properties secure long booking periods (181+ days booked per year), highlighting successful long-term rental strategies or significant owner usage.
Lerici Airbnb Minimum Stay Requirements Analysis
Distribution of Listings by Minimum Night Requirement
1 Night
34 listings
7.8% of total
2 Nights
141 listings
32.3% of total
3 Nights
62 listings
14.2% of total
4-6 Nights
65 listings
14.9% of total
7-29 Nights
68 listings
15.6% of total
30+ Nights
66 listings
15.1% of total
Key Insights
- The most prevalent minimum stay requirement in Lerici is 2 Nights, adopted by 32.3% of listings. This highlights the market's preference for shorter, flexible bookings.
- A significant segment (15.1%) caters to monthly stays (30+ nights) in Lerici, pointing to opportunities in the extended-stay market.
Recommendations
- Align with the market by considering a 2 Nights minimum stay, as 32.3% of Lerici hosts use this setting.
- If feasible, allowing 1-night stays, especially midweek or during low season, could capture last-minute bookings, as only 7.8% currently do.
- A 2-night minimum appears standard (32.3%). Consider this for weekends or peak periods.
- Explore offering discounts for stays of 30+ nights to attract the 15.1% of the market seeking extended stays.
- Adjust minimum nights based on seasonality – potentially shorter during low season and longer during peak demand periods in Lerici.
Lerici Airbnb Cancellation Policy Trends Analysis (2025)
Super Strict 60 Days
2 listings
0.5% of total
Super Strict 30 Days
2 listings
0.5% of total
Flexible
62 listings
16.3% of total
Moderate
194 listings
51.1% of total
Strict
120 listings
31.6% of total
Cancellation Policy Insights for Lerici
- The prevailing Airbnb cancellation policy trend in Lerici is Moderate, used by 51.1% of listings.
- There's a relatively balanced mix between guest-friendly (67.4%) and stricter (31.6%) policies, offering choices for different guest needs.
Recommendations for Hosts
- Consider adopting a Moderate policy to align with the 51.1% market standard in Lerici.
- With 31.6% using Strict terms, this is a viable option in Lerici, particularly for high-value properties or during peak demand periods.
- Regularly review your cancellation policy against competitors and market demand shifts in Lerici.
Lerici STR Booking Lead Time Analysis (2025)
Average Booking Lead Time by Month
Booking Lead Time Insights for Lerici
- The overall average booking lead time for vacation rentals in Lerici is 62 days.
- Guests book furthest in advance for stays during July (average 107 days), likely coinciding with peak travel demand or local events.
- The shortest booking windows occur for stays in February (average 26 days), indicating more last-minute travel plans during this time.
- Seasonally, Summer (94 days avg.) sees the longest lead times, while Winter (29 days avg.) has the shortest, reflecting typical travel planning cycles.
Recommendations for Hosts
- Use the overall average lead time (62 days) as a baseline for your pricing and availability strategy in Lerici.
- For July stays, consider implementing length-of-stay discounts or slightly higher rates for bookings made less than 107 days out to capitalize on advance planning.
- Target marketing efforts for the Summer season well in advance (at least 94 days) to capture early planners.
- Monitor your own booking lead times against these Lerici averages to identify opportunities for dynamic pricing adjustments.
Popular & Essential Airbnb Amenities in Lerici (2025)
Amenity Prevalence
Amenity Insights for Lerici
- Essential amenities in Lerici that guests expect include: Kitchen. Lacking these (this) could significantly impact bookings.
- Popular amenities like Heating, TV, Hot water are common but not universal. Offering these can provide a competitive edge.
- Warning: Wifi is not universally provided but is considered essential globally. Ensure reliable Wifi is offered.
Recommendations for Hosts
- Ensure your listing includes all essential amenities for Lerici: Kitchen.
- Prioritize adding missing essentials: Kitchen.
- Consider adding popular differentiators like Heating or TV to increase appeal.
- Highlight unique or less common amenities you offer (e.g., hot tub, dedicated workspace, EV charger) in your listing description and photos.
- Regularly check competitor amenities in Lerici to stay competitive.
Lerici Airbnb Guest Demographics & Profile Analysis (2025)
Guest Profile Summary for Lerici
- The typical guest profile for Airbnb in Lerici consists of predominantly international visitors (78%), with top international origins including Germany, typically belonging to the Post-2000s (Gen Z/Alpha) group (50%), primarily speaking English or German.
- Domestic travelers account for 21.7% of guests.
- Key international markets include Italy (21.7%) and Germany (16.2%).
- Top languages spoken are English (38.8%) followed by German (14.3%).
- A significant demographic segment is the Post-2000s (Gen Z/Alpha) group, representing 50% of guests.
Recommendations for Hosts
- Focus marketing internationally, particularly towards travelers from Germany.
- Tailor amenities and listing descriptions to appeal to the dominant Post-2000s (Gen Z/Alpha) demographic (e.g., highlight fast WiFi, smart home features, local guides).
- Highlight unique local experiences or amenities relevant to the primary guest profile.
- Consider seasonal promotions aligned with peak travel times for key origin markets.
Nearby Short-Term Rental Market Comparison
How does the Lerici Airbnb market stack up against its neighbors? Compare key performance metrics like average monthly revenue, ADR, and occupancy rates in surrounding areas to understand the broader regional STR landscape.
| Market | Active Properties | Monthly Revenue | Daily Rate | Avg. Occupancy |
|---|---|---|---|---|
| Laglio | 64 | $4,873 | $463.61 | 47% |
| Brenzone sul Garda | 19 | $4,128 | $335.25 | 52% |
| Portofino | 68 | $4,086 | $454.35 | 44% |
| Sala Comacina | 64 | $3,794 | $400.27 | 50% |
| Cossano Belbo | 13 | $3,632 | $284.21 | 42% |
| Bellagio | 373 | $3,630 | $328.26 | 55% |
| Crespina | 16 | $3,526 | $493.64 | 48% |
| Oliveto Lario | 99 | $3,509 | $327.42 | 55% |
| Carate Urio | 71 | $3,379 | $331.90 | 44% |
| Brienno | 39 | $3,327 | $337.92 | 45% |