Garlenda Airbnb Market Analysis 2025: Short Term Rental Data & Vacation Rental Statistics in Liguria, Italy
Is Airbnb profitable in Garlenda in 2025? Explore comprehensive Airbnb analytics for Garlenda, Liguria, Italy to uncover income potential. This 2025 STR market report for Garlenda, based on AirROI data from April 2024 to March 2025, reveals key trends in the niche market of 32 active listings.
Whether you're considering an Airbnb investment in Garlenda, optimizing your existing vacation rental, or exploring rental arbitrage opportunities, understanding the Garlenda Airbnb data is crucial. Navigating the high regulation landscape is key to maximizing your short term rental income potential. Let's dive into the specifics.
Key Garlenda Airbnb Performance Metrics Overview
Monthly Airbnb Revenue Variations & Income Potential in Garlenda (2025)
Understanding the monthly revenue variations for Airbnb listings in Garlenda is key to maximizing your short term rental income potential. Seasonality significantly impacts earnings. Our analysis, based on data from the past 12 months, shows that the peak revenue month for STRs in Garlenda is typically August, while March often presents the lowest earnings, highlighting opportunities for strategic pricing adjustments during shoulder and low seasons. Explore the typical Airbnb income in Garlenda across different performance tiers:
- Best-in-class properties (Top 10%) achieve $4,627+ monthly, often utilizing dynamic pricing and superior guest experiences.
- Strong performing properties (Top 25%) earn $2,177 or more, indicating effective management and desirable locations/amenities.
- Typical properties (Median) generate around $1,094 per month, representing the average market performance.
- Entry-level properties (Bottom 25%) see earnings around $608, often with potential for optimization.
Average Monthly Airbnb Earnings Trend in Garlenda
Garlenda Airbnb Occupancy Rate Trends (2025)
Maximize your bookings by understanding the Garlenda STR occupancy trends. Seasonal demand shifts significantly influence how often properties are booked. Typically, Augustsees the highest demand (peak season occupancy), while March experiences the lowest (low season). Effective strategies, like adjusting minimum stays or offering promotions, can boost occupancy during slower periods. Here's how different property tiers perform in Garlenda:
- Best-in-class properties (Top 10%) achieve 57%+ occupancy, indicating high desirability and potentially optimized availability.
- Strong performing properties (Top 25%) maintain 40% or higher occupancy, suggesting good market fit and guest satisfaction.
- Typical properties (Median) have an occupancy rate around 25%.
- Entry-level properties (Bottom 25%) average 15% occupancy, potentially facing higher vacancy.
Average Monthly Occupancy Rate Trend in Garlenda
Average Daily Rate (ADR) Airbnb Trends in Garlenda (2025)
Effective short term rental pricing strategy in Garlenda involves understanding monthly ADR fluctuations. The Average Daily Rate (ADR) for Airbnb in Garlenda typically peaks in August and dips lowest during November. Leveraging Airbnb dynamic pricing tools or strategies based on this seasonality can significantly boost revenue. Here's a look at the typical nightly rates achieved:
- Best-in-class properties (Top 10%) command rates of $491+ per night, often due to premium features or locations.
- Strong performing properties (Top 25%) achieve nightly rates of $209 or more.
- Typical properties (Median) charge around $136 per night.
- Entry-level properties (Bottom 25%) earn around $98 per night.
Average Daily Rate (ADR) Trend by Month in Garlenda
Get Live Garlenda Market Intelligence 👇

Explore Real-time Analytics
Airbnb Seasonality Analysis & Trends in Garlenda (2025)
Peak Season (August, July, June)
- Revenue averages $3,846 per month
- Occupancy rates average 47.5%
- Daily rates average $220
Shoulder Season
- Revenue averages $1,468 per month
- Occupancy maintains around 26.4%
- Daily rates hold near $209
Low Season (March, April, November)
- Revenue drops to average $674 per month
- Occupancy decreases to average 17.1%
- Daily rates adjust to average $202
Seasonality Insights for Garlenda
- The Airbnb seasonality in Garlenda shows highly seasonal trends requiring careful strategy. While the sections above show seasonal averages, it's also insightful to look at the extremes:
- During the high season, the absolute peak month showcases Garlenda's highest earning potential, with monthly revenues capable of climbing to $5,040, occupancy reaching a high of 61.9%, and ADRs peaking at $221.
- Conversely, the slowest single month of the year, typically falling within the low season, marks the market's lowest point. In this month, revenue might dip to $419, occupancy could drop to 12.9%, and ADRs may adjust down to $197.
- Understanding both the seasonal averages and these monthly peaks and troughs in revenue, occupancy, and ADR is crucial for maximizing your Airbnb profit potential in Garlenda.
Seasonal Strategies for Maximizing Profit
- Peak Season: Maximize revenue through premium pricing and potentially longer minimum stays. Ensure high availability.
- Low Season: Offer competitive pricing, special promotions (e.g., extended stay discounts), and flexible cancellation policies. Target off-season travelers like remote workers or budget-conscious guests.
- Shoulder Seasons: Implement dynamic pricing that balances peak and low rates. Target weekend travelers or specific events. Offer slightly more flexible terms than peak season.
- Regularly analyze your own performance against these Garlenda seasonality benchmarks and adjust your pricing and availability strategy accordingly.
Best Areas for Airbnb Investment in Garlenda (2025)
Exploring the top neighborhoods for short-term rentals in Garlenda? This section highlights key areas, outlining why they are attractive for hosts and guests, along with notable local attractions. Consider these locations based on your target guest profile and investment strategy.
| Neighborhood / Area | Why Host Here? (Target Guests & Appeal) | Key Attractions & Landmarks |
|---|---|---|
| Garlenda Village | Charming village atmosphere with traditional Ligurian architecture. Popular among tourists looking for a serene getaway with a taste of local culture. | Garlenda Golf Club, San Giovanni Battista Church, local trattorias, surrounding hills for hiking |
| Ceriale Beach | Coastal location with beautiful sandy beaches, attracting beach lovers and families. Ideal for summer rentals and beachfront fun. | Ceriale Beach, water sports, local seafood restaurants, Ceriale Aquarium, beachside promenades |
| Albenga | Historic city with ancient Roman ruins and beautiful medieval architecture. Popular for cultural tourism and history enthusiasts. | Albenga Cathedral, Torre dei Lamberti, Basilica di San Magno, local markets, historical walking tours |
| Laigueglia | Picturesque fishing village known for its scenic beach and vibrant local life. Ideal for those looking for a quaint coastal experience. | Laigueglia Beach, the old town, Forte di Santa Croce, local festivals, waterfront dining |
| Andora | Lively coastal town known for its family-friendly beaches and Mediterranean climate. Great for family vacations and summer tourism. | Andora Beach, Parco delle Farfalle, water sports activities, historic sites, local cuisine |
| Villanova d'Albenga | Rural charm with vineyards and olive groves, offering a tranquil countryside experience. Attracts visitors looking for relaxation and nature. | vineyard tours, olive oil tastings, local farms, nature walks, historical landmarks |
| Finalborgo | One of Italy's borghi più belli with rich history, beautiful architecture, and nearby hiking trails. Perfect for culture seekers and outdoor enthusiasts. | Castle of Finalborgo, local artisan shops, hiking trails, medieval festivals, historic architecture |
| Capo Mele | Scenic coastal area with stunning views and pristine nature, popular with tourists looking for picturesque landscapes and adventure. | Capo Mele viewpoint, hiking trails, beach access, scuba diving spots, marine nature reserve |
Understanding Airbnb License Requirements & STR Laws in Garlenda (2025)
Yes, Garlenda, Liguria, Italy enforces high STR regulations. Obtaining a license and ensuring compliance is almost certainly required according to current 2025 STR laws. Always verify the latest short term rental regulations and Airbnb license requirements directly with local government authorities for Garlenda to ensure full compliance before hosting.
(Source: AirROI data, 2025, based on 59% licensed listings)
Top Performing Airbnb Properties in Garlenda (2025)
Benchmark your potential! Explore examples of top-performing Airbnb properties in Garlendabased on Trailing Twelve Month (TTM) revenue. Analyze their characteristics, revenue, occupancy rate, and ADR to understand what drives success in this market.
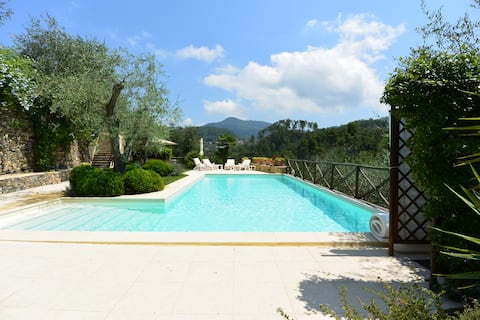
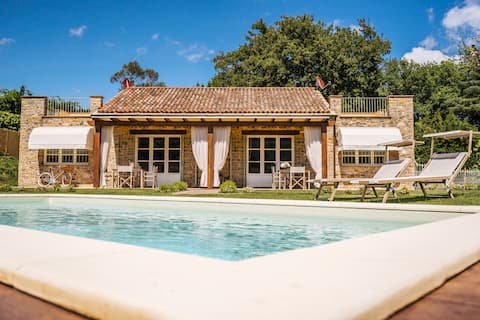
Charming farmhouse with a pool surrounded by greenery
Entire Place • 5 bedrooms
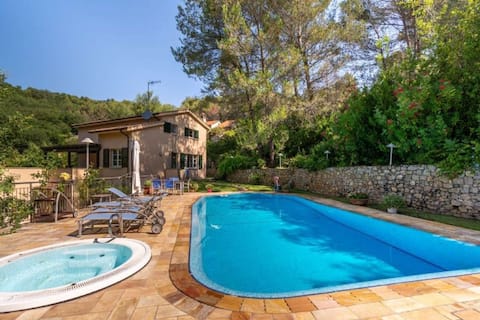
Golf Paradise Villa - Happy.Rentals
Entire Place • 5 bedrooms
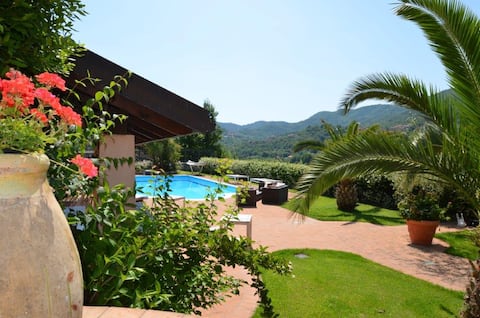
Villa con piscina a Garlenda
Entire Place • 5 bedrooms
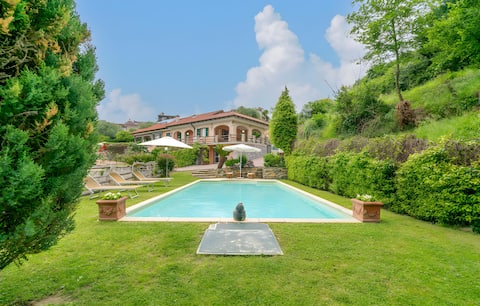
Villa Nicoletta
Entire Place • 3 bedrooms
Countryside house with swimming pool
Entire Place • 1 bedroom

Countryside house with a pool
Entire Place • 1 bedroom
Note: Performance varies based on location, size, amenities, seasonality, and management quality. Data reflects the past 12 months.
Top Performing Airbnb Hosts in Garlenda (2025)
Learn from the best! This table showcases top-performing Airbnb hosts in Garlenda based on the number of properties managed and estimated total revenue over the past year. Analyze their scale and performance metrics.
| Host Name | Properties | Grossing Revenue | Stay Reviews | Avg Rating |
|---|---|---|---|---|
| Piero Domenico | 7 | $62,220 | 263 | 4.89/5.0 |
| Paola Maria | 1 | $58,813 | 10 | 5.00/5.0 |
| Host #156134473 | 3 | $54,152 | 0 | 0.00/5.0 |
| Silvia | 2 | $37,866 | 64 | 4.83/5.0 |
| Host #92229757 | 1 | $33,981 | 1 | 0.00/5.0 |
| Host #551800995 | 1 | $31,977 | 0 | 0.00/5.0 |
| Emanuel | 2 | $20,592 | 49 | 4.98/5.0 |
| Lorenzo | 3 | $19,099 | 47 | 4.82/5.0 |
| Nadia | 1 | $17,597 | 12 | 5.00/5.0 |
| Novasol | 1 | $15,885 | 15 | 4.73/5.0 |
Analyzing the strategies of top hosts, such as their property selection, pricing, and guest communication, can offer valuable lessons for optimizing your own Airbnb operations in Garlenda.
Dive Deeper: Advanced Garlenda STR Market Data (2025)
Ready to unlock more insights? AirROI provides access to advanced metrics and comprehensive Airbnb data for Garlenda. Explore detailed analytics beyond this report to refine your investment strategy, optimize pricing, and maximize your vacation rental profits.
Explore Advanced MetricsGarlenda Short-Term Rental Market Composition (2025): Property & Room Types
Room Type Distribution
Property Type Distribution
Market Composition Insights for Garlenda
- The Garlenda Airbnb market composition is heavily skewed towards Entire Home/Apt listings, which make up 93.8% of the 32 active rentals. This indicates strong guest preference for privacy and space.
- Looking at the property type distribution in Garlenda, House properties are the most common (37.5%), reflecting the local real estate landscape.
- Houses represent a significant 37.5% portion, catering likely to families or larger groups.
- The presence of 6.3% Hotel/Boutique listings indicates integration with traditional hospitality.
Garlenda Airbnb Room Capacity Analysis (2025): Bedroom Distribution
Distribution of Listings by Number of Bedrooms
Room Capacity Insights for Garlenda
- The dominant room capacity in Garlenda is 2 bedrooms listings, making up 31.3% of the market. This suggests a strong demand for properties suitable for couples or solo travelers.
- Together, 2 bedrooms and 1 bedroom properties represent 59.4% of the active Airbnb listings in Garlenda, indicating a high concentration in these sizes.
- A significant 34.4% of listings offer 3+ bedrooms, catering to larger groups and families seeking more space in Garlenda.
Garlenda Vacation Rental Guest Capacity Trends (2025)
Distribution of Listings by Guest Capacity
Guest Capacity Insights for Garlenda
- The most common guest capacity trend in Garlenda vacation rentals is listings accommodating 4 guests (37.5%). This suggests the primary traveler segment is likely small families or groups.
- Properties designed for 4 guests and 8+ guests dominate the Garlenda STR market, accounting for 65.6% of listings.
- 34.4% of properties accommodate 6+ guests, serving the market segment for larger families or group travel in Garlenda.
- On average, properties in Garlenda are equipped to host 5.0 guests.
Garlenda Airbnb Booking Patterns (2025): Available vs. Booked Days
Available Days Distribution
Booked Days Distribution
Booking Pattern Insights for Garlenda
- The most common availability pattern in Garlenda falls within the 271-366 days range, representing 71.9% of listings. This suggests many properties have significant open periods on their calendars.
- Approximately 100.0% of listings show high availability (181+ days open annually), indicating potential for increased bookings or specific owner usage patterns.
- For booked days, the 31-90 days range is most frequent in Garlenda (43.8%), reflecting common guest stay durations or potential owner blocking patterns.
Garlenda Airbnb Minimum Stay Requirements Analysis
Distribution of Listings by Minimum Night Requirement
1 Night
1 listings
3.7% of total
2 Nights
6 listings
22.2% of total
3 Nights
2 listings
7.4% of total
4-6 Nights
8 listings
29.6% of total
7-29 Nights
7 listings
25.9% of total
30+ Nights
3 listings
11.1% of total
Key Insights
- The most prevalent minimum stay requirement in Garlenda is 4-6 Nights, adopted by 29.6% of listings. This highlights the market's preference for longer commitments.
- A significant segment (11.1%) caters to monthly stays (30+ nights) in Garlenda, pointing to opportunities in the extended-stay market.
Recommendations
- Align with the market by considering a 4-6 Nights minimum stay, as 29.6% of Garlenda hosts use this setting.
- If feasible, allowing 1-night stays, especially midweek or during low season, could capture last-minute bookings, as only 3.7% currently do.
- Explore offering discounts for stays of 30+ nights to attract the 11.1% of the market seeking extended stays.
- Adjust minimum nights based on seasonality – potentially shorter during low season and longer during peak demand periods in Garlenda.
Garlenda Airbnb Cancellation Policy Trends Analysis (2025)
Super Strict 60 Days
1 listings
4% of total
Flexible
1 listings
4% of total
Moderate
14 listings
56% of total
Strict
9 listings
36% of total
Cancellation Policy Insights for Garlenda
- The prevailing Airbnb cancellation policy trend in Garlenda is Moderate, used by 56% of listings.
- There's a relatively balanced mix between guest-friendly (60.0%) and stricter (36.0%) policies, offering choices for different guest needs.
Recommendations for Hosts
- Consider adopting a Moderate policy to align with the 56% market standard in Garlenda.
- With 36% using Strict terms, this is a viable option in Garlenda, particularly for high-value properties or during peak demand periods.
- Regularly review your cancellation policy against competitors and market demand shifts in Garlenda.
Garlenda STR Booking Lead Time Analysis (2025)
Average Booking Lead Time by Month
Booking Lead Time Insights for Garlenda
- The overall average booking lead time for vacation rentals in Garlenda is 67 days.
- Guests book furthest in advance for stays during July (average 132 days), likely coinciding with peak travel demand or local events.
- The shortest booking windows occur for stays in March (average 17 days), indicating more last-minute travel plans during this time.
- Seasonally, Summer (99 days avg.) sees the longest lead times, while Spring (47 days avg.) has the shortest, reflecting typical travel planning cycles.
Recommendations for Hosts
- Use the overall average lead time (67 days) as a baseline for your pricing and availability strategy in Garlenda.
- For July stays, consider implementing length-of-stay discounts or slightly higher rates for bookings made less than 132 days out to capitalize on advance planning.
- Target marketing efforts for the Summer season well in advance (at least 99 days) to capture early planners.
- Monitor your own booking lead times against these Garlenda averages to identify opportunities for dynamic pricing adjustments.
Popular & Essential Airbnb Amenities in Garlenda (2025)
Amenity Prevalence
Amenity Insights for Garlenda
- Essential amenities in Garlenda that guests expect include: Kitchen. Lacking these (this) could significantly impact bookings.
- Popular amenities like Wifi, TV, Essentials are common but not universal. Offering these can provide a competitive edge.
- Warning: Wifi is not universally provided but is considered essential globally. Ensure reliable Wifi is offered.
Recommendations for Hosts
- Ensure your listing includes all essential amenities for Garlenda: Kitchen.
- Prioritize adding missing essentials: Kitchen.
- Consider adding popular differentiators like Wifi or TV to increase appeal.
- Highlight unique or less common amenities you offer (e.g., hot tub, dedicated workspace, EV charger) in your listing description and photos.
- Regularly check competitor amenities in Garlenda to stay competitive.
Garlenda Airbnb Guest Demographics & Profile Analysis (2025)
Guest Profile Summary for Garlenda
- The typical guest profile for Airbnb in Garlenda consists of predominantly international visitors (80%), with top international origins including Italy, typically belonging to the Post-2000s (Gen Z/Alpha) group (50%), primarily speaking English or German.
- Domestic travelers account for 20.0% of guests.
- Key international markets include Germany (24.3%) and Italy (20%).
- Top languages spoken are English (38.2%) followed by German (16.9%).
- A significant demographic segment is the Post-2000s (Gen Z/Alpha) group, representing 50% of guests.
Recommendations for Hosts
- Focus marketing internationally, particularly towards travelers from Italy.
- Tailor amenities and listing descriptions to appeal to the dominant Post-2000s (Gen Z/Alpha) demographic (e.g., highlight fast WiFi, smart home features, local guides).
- Highlight unique local experiences or amenities relevant to the primary guest profile.
- Consider seasonal promotions aligned with peak travel times for key origin markets.
Nearby Short-Term Rental Market Comparison
How does the Garlenda Airbnb market stack up against its neighbors? Compare key performance metrics like average monthly revenue, ADR, and occupancy rates in surrounding areas to understand the broader regional STR landscape.
| Market | Active Properties | Monthly Revenue | Daily Rate | Avg. Occupancy |
|---|---|---|---|---|
| Laglio | 64 | $4,873 | $463.61 | 47% |
| Monteu Roero | 16 | $4,432 | $540.14 | 36% |
| Portofino | 68 | $4,086 | $454.35 | 44% |
| Saint-Jean-Cap-Ferrat | 107 | $3,844 | $424.21 | 46% |
| Sala Comacina | 64 | $3,794 | $400.27 | 50% |
| Cossano Belbo | 13 | $3,632 | $284.21 | 42% |
| Bellagio | 373 | $3,630 | $328.26 | 55% |
| Oliveto Lario | 99 | $3,509 | $327.42 | 55% |
| Carate Urio | 71 | $3,379 | $331.90 | 44% |
| Brienno | 39 | $3,327 | $337.92 | 45% |