Framura Airbnb Market Analysis 2025: Short Term Rental Data & Vacation Rental Statistics in Liguria, Italy
Is Airbnb profitable in Framura in 2025? Explore comprehensive Airbnb analytics for Framura, Liguria, Italy to uncover income potential. This 2025 STR market report for Framura, based on AirROI data from April 2024 to March 2025, reveals key trends in the niche market of 51 active listings.
Whether you're considering an Airbnb investment in Framura, optimizing your existing vacation rental, or exploring rental arbitrage opportunities, understanding the Framura Airbnb data is crucial. Navigating the high regulation landscape is key to maximizing your short term rental income potential. Let's dive into the specifics.
Key Framura Airbnb Performance Metrics Overview
Monthly Airbnb Revenue Variations & Income Potential in Framura (2025)
Understanding the monthly revenue variations for Airbnb listings in Framura is key to maximizing your short term rental income potential. Seasonality significantly impacts earnings. Our analysis, based on data from the past 12 months, shows that the peak revenue month for STRs in Framura is typically August, while February often presents the lowest earnings, highlighting opportunities for strategic pricing adjustments during shoulder and low seasons. Explore the typical Airbnb income in Framura across different performance tiers:
- Best-in-class properties (Top 10%) achieve $3,931+ monthly, often utilizing dynamic pricing and superior guest experiences.
- Strong performing properties (Top 25%) earn $2,471 or more, indicating effective management and desirable locations/amenities.
- Typical properties (Median) generate around $1,376 per month, representing the average market performance.
- Entry-level properties (Bottom 25%) see earnings around $583, often with potential for optimization.
Average Monthly Airbnb Earnings Trend in Framura
Framura Airbnb Occupancy Rate Trends (2025)
Maximize your bookings by understanding the Framura STR occupancy trends. Seasonal demand shifts significantly influence how often properties are booked. Typically, Augustsees the highest demand (peak season occupancy), while February experiences the lowest (low season). Effective strategies, like adjusting minimum stays or offering promotions, can boost occupancy during slower periods. Here's how different property tiers perform in Framura:
- Best-in-class properties (Top 10%) achieve 67%+ occupancy, indicating high desirability and potentially optimized availability.
- Strong performing properties (Top 25%) maintain 51% or higher occupancy, suggesting good market fit and guest satisfaction.
- Typical properties (Median) have an occupancy rate around 32%.
- Entry-level properties (Bottom 25%) average 15% occupancy, potentially facing higher vacancy.
Average Monthly Occupancy Rate Trend in Framura
Average Daily Rate (ADR) Airbnb Trends in Framura (2025)
Effective short term rental pricing strategy in Framura involves understanding monthly ADR fluctuations. The Average Daily Rate (ADR) for Airbnb in Framura typically peaks in June and dips lowest during March. Leveraging Airbnb dynamic pricing tools or strategies based on this seasonality can significantly boost revenue. Here's a look at the typical nightly rates achieved:
- Best-in-class properties (Top 10%) command rates of $252+ per night, often due to premium features or locations.
- Strong performing properties (Top 25%) achieve nightly rates of $183 or more.
- Typical properties (Median) charge around $122 per night.
- Entry-level properties (Bottom 25%) earn around $90 per night.
Average Daily Rate (ADR) Trend by Month in Framura
Get Live Framura Market Intelligence 👇

Explore Real-time Analytics
Airbnb Seasonality Analysis & Trends in Framura (2025)
Peak Season (August, July, June)
- Revenue averages $3,043 per month
- Occupancy rates average 56.4%
- Daily rates average $145
Shoulder Season
- Revenue averages $1,816 per month
- Occupancy maintains around 34.1%
- Daily rates hold near $142
Low Season (January, February, March)
- Revenue drops to average $709 per month
- Occupancy decreases to average 12.6%
- Daily rates adjust to average $138
Seasonality Insights for Framura
- The Airbnb seasonality in Framura shows highly seasonal trends requiring careful strategy. While the sections above show seasonal averages, it's also insightful to look at the extremes:
- During the high season, the absolute peak month showcases Framura's highest earning potential, with monthly revenues capable of climbing to $3,536, occupancy reaching a high of 68.3%, and ADRs peaking at $145.
- Conversely, the slowest single month of the year, typically falling within the low season, marks the market's lowest point. In this month, revenue might dip to $449, occupancy could drop to 7.1%, and ADRs may adjust down to $137.
- Understanding both the seasonal averages and these monthly peaks and troughs in revenue, occupancy, and ADR is crucial for maximizing your Airbnb profit potential in Framura.
Seasonal Strategies for Maximizing Profit
- Peak Season: Maximize revenue through premium pricing and potentially longer minimum stays. Ensure high availability.
- Low Season: Offer competitive pricing, special promotions (e.g., extended stay discounts), and flexible cancellation policies. Target off-season travelers like remote workers or budget-conscious guests.
- Shoulder Seasons: Implement dynamic pricing that balances peak and low rates. Target weekend travelers or specific events. Offer slightly more flexible terms than peak season.
- Regularly analyze your own performance against these Framura seasonality benchmarks and adjust your pricing and availability strategy accordingly.
Best Areas for Airbnb Investment in Framura (2025)
Exploring the top neighborhoods for short-term rentals in Framura? This section highlights key areas, outlining why they are attractive for hosts and guests, along with notable local attractions. Consider these locations based on your target guest profile and investment strategy.
| Neighborhood / Area | Why Host Here? (Target Guests & Appeal) | Key Attractions & Landmarks |
|---|---|---|
| Framura Village | A picturesque coastal village known for its stunning views, charming streets, and authentic Italian atmosphere. Attractive to travelers seeking a traditional Ligurian experience away from the hustle and bustle of larger towns. | Framura Beach, San Martino Church, Bike path of the 5 Terre, Cala Elvio Beach, Framura Train Station, Local restaurants and cafes |
| Deiva Marina | A small seaside town close to Framura that offers beautiful beaches and scenic walks. It's perfect for families and beach lovers looking for relaxation and nature. | Deiva Marina Beach, Sentiero Azzurro hiking trail, Local gelaterias, Marina di Deiva, Natural parks, Water sports activities |
| Bonassola | The neighboring village known for its charming environment and family-friendly beaches. A quieter alternative with stunning landscapes that appeals to nature lovers and outdoor enthusiasts. | Bonassola Beach, Parco Nazionale delle Cinque Terre, Walking trails, Local artisan shops, Outdoor cafes, Annual summer festivals |
| Cinque Terre National Park | While not in Framura itself, it's nearby and attracts a massive number of tourists due to its UNESCO World Heritage status. Offers unique experiences of hiking, local culture, and breathtaking scenery. | Monterosso al Mare, Vernazza, Corniglia, Manarola, Riomaggiore, Hiking trails between villages |
| Nesso | A lesser-known but charming village that draws visitors looking for a tranquil getaway. Its scenic views and local charm make it appealing for quiet retreats. | Nesso Waterfall, Historical churches, Lake scenery, Walking paths around the village, Local markets, Relaxing atmosphere |
| Levanto | A vibrant gateway to the Cinque Terre region, known for stunning beaches and a lively beach town vibe. Great for travelers looking for beach activities and nightlife. | Levanto Beach, Levanto's Old Town, Surfing schools, Coastal hiking paths, Local restaurants, Cultural events throughout the year |
| Riomaggiore | One of the most popular Cinque Terre towns, known for its colorful cliffside homes and stunning coastal views. A must-visit for travelers eager to experience the best of Italian coastal culture. | Via dell'Amore, Church of San Giovanni Battista, Castle of Riomaggiore, Local wine tasting, Waterfront dining, Shops and boutiques |
| Monterosso al Mare | The largest of the Cinque Terre villages, it's famous for its beautiful beaches and vibrant atmosphere. Ideal for travelers who want a mix of relaxation and exploration. | Monterosso Beach, Statue of the Giant, Old Town area, Hiking to Vernazza, Local vineyards, Beachfront restaurants |
Understanding Airbnb License Requirements & STR Laws in Framura (2025)
Yes, Framura, Liguria, Italy enforces high STR regulations. Obtaining a license and ensuring compliance is almost certainly required according to current 2025 STR laws. Always verify the latest short term rental regulations and Airbnb license requirements directly with local government authorities for Framura to ensure full compliance before hosting.
(Source: AirROI data, 2025, based on 61% licensed listings)
Top Performing Airbnb Properties in Framura (2025)
Benchmark your potential! Explore examples of top-performing Airbnb properties in Framurabased on Trailing Twelve Month (TTM) revenue. Analyze their characteristics, revenue, occupancy rate, and ADR to understand what drives success in this market.
Stone house "Blue Silence"
Entire Place • 4 bedrooms
Luxury Easy Living in Framura
Entire Place • 3 bedrooms
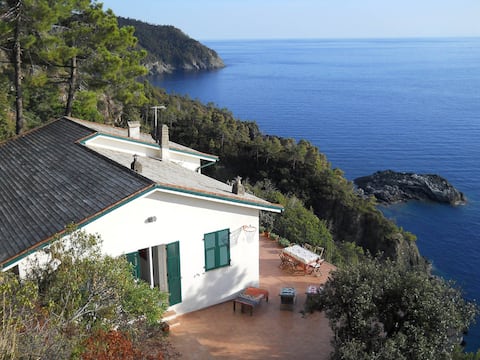
Exclusive villa in the 5 terre area
Entire Place • 4 bedrooms
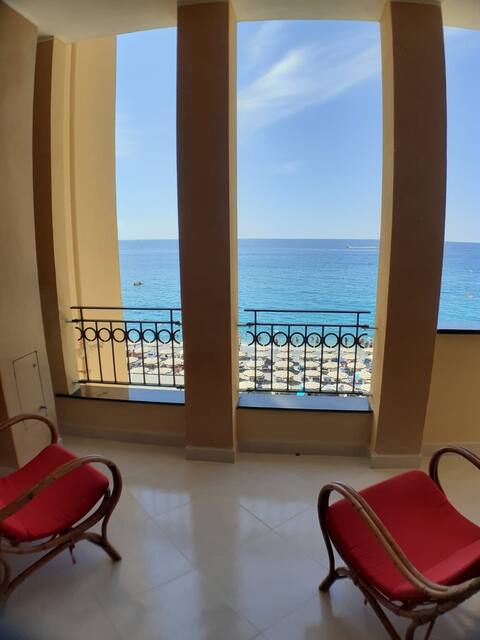
Appartamento sulla spiaggia 5terre O11O14-LT-OO53
Entire Place • 2 bedrooms

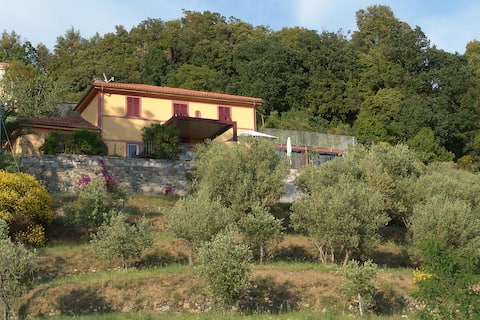
Framura between olive trees and the sea near 5Terre
Entire Place • 1 bedroom
Pignola with pool Borgo San Pietro CITR011012005
Entire Place • 2 bedrooms
Note: Performance varies based on location, size, amenities, seasonality, and management quality. Data reflects the past 12 months.
Top Performing Airbnb Hosts in Framura (2025)
Learn from the best! This table showcases top-performing Airbnb hosts in Framura based on the number of properties managed and estimated total revenue over the past year. Analyze their scale and performance metrics.
| Host Name | Properties | Grossing Revenue | Stay Reviews | Avg Rating |
|---|---|---|---|---|
| Caterina | 1 | $72,679 | 108 | 4.98/5.0 |
| Davide | 3 | $69,179 | 65 | 4.81/5.0 |
| Anna | 1 | $65,905 | 15 | 4.93/5.0 |
| Floriana | 1 | $60,320 | 35 | 4.97/5.0 |
| Host #19398486 | 2 | $53,271 | 72 | 4.92/5.0 |
| Emanuela | 2 | $46,967 | 11 | 4.94/5.0 |
| Patrizia E Mario | 2 | $34,683 | 293 | 4.55/5.0 |
| Simona | 1 | $29,227 | 25 | 4.84/5.0 |
| Host #220431391 | 5 | $27,487 | 0 | 0.00/5.0 |
| Novasol | 1 | $25,442 | 3 | 5.00/5.0 |
Analyzing the strategies of top hosts, such as their property selection, pricing, and guest communication, can offer valuable lessons for optimizing your own Airbnb operations in Framura.
Dive Deeper: Advanced Framura STR Market Data (2025)
Ready to unlock more insights? AirROI provides access to advanced metrics and comprehensive Airbnb data for Framura. Explore detailed analytics beyond this report to refine your investment strategy, optimize pricing, and maximize your vacation rental profits.
Explore Advanced MetricsFramura Short-Term Rental Market Composition (2025): Property & Room Types
Room Type Distribution
Property Type Distribution
Market Composition Insights for Framura
- The Framura Airbnb market composition is heavily skewed towards Entire Home/Apt listings, which make up 86.3% of the 51 active rentals. This indicates strong guest preference for privacy and space.
- Looking at the property type distribution in Framura, Apartment/Condo properties are the most common (54.9%), reflecting the local real estate landscape.
- Houses represent a significant 27.5% portion, catering likely to families or larger groups.
- The presence of 13.7% Hotel/Boutique listings indicates integration with traditional hospitality.
- Smaller segments like outdoor/unique, others (combined 4.0%) offer potential for unique stay experiences.
Framura Airbnb Room Capacity Analysis (2025): Bedroom Distribution
Distribution of Listings by Number of Bedrooms
Room Capacity Insights for Framura
- The dominant room capacity in Framura is 2 bedrooms listings, making up 35.3% of the market. This suggests a strong demand for properties suitable for couples or solo travelers.
- Together, 2 bedrooms and 1 bedroom properties represent 70.6% of the active Airbnb listings in Framura, indicating a high concentration in these sizes.
Framura Vacation Rental Guest Capacity Trends (2025)
Distribution of Listings by Guest Capacity
Guest Capacity Insights for Framura
- The most common guest capacity trend in Framura vacation rentals is listings accommodating 4 guests (37.3%). This suggests the primary traveler segment is likely small families or groups.
- Properties designed for 4 guests and 6 guests dominate the Framura STR market, accounting for 54.9% of listings.
- 27.4% of properties accommodate 6+ guests, serving the market segment for larger families or group travel in Framura.
- On average, properties in Framura are equipped to host 4.1 guests.
Framura Airbnb Booking Patterns (2025): Available vs. Booked Days
Available Days Distribution
Booked Days Distribution
Booking Pattern Insights for Framura
- The most common availability pattern in Framura falls within the 271-366 days range, representing 54.9% of listings. This suggests many properties have significant open periods on their calendars.
- Approximately 86.3% of listings show high availability (181+ days open annually), indicating potential for increased bookings or specific owner usage patterns.
- For booked days, the 91-180 days range is most frequent in Framura (31.4%), reflecting common guest stay durations or potential owner blocking patterns.
- A notable 13.8% of properties secure long booking periods (181+ days booked per year), highlighting successful long-term rental strategies or significant owner usage.
Framura Airbnb Minimum Stay Requirements Analysis
Distribution of Listings by Minimum Night Requirement
1 Night
14 listings
30.4% of total
2 Nights
10 listings
21.7% of total
3 Nights
5 listings
10.9% of total
4-6 Nights
7 listings
15.2% of total
7-29 Nights
4 listings
8.7% of total
30+ Nights
6 listings
13% of total
Key Insights
- The most prevalent minimum stay requirement in Framura is 1 Night, adopted by 30.4% of listings. This highlights the market's preference for shorter, flexible bookings.
- A significant segment (13%) caters to monthly stays (30+ nights) in Framura, pointing to opportunities in the extended-stay market.
Recommendations
- Align with the market by considering a 1 Night minimum stay, as 30.4% of Framura hosts use this setting.
- Explore offering discounts for stays of 30+ nights to attract the 13% of the market seeking extended stays.
- Adjust minimum nights based on seasonality – potentially shorter during low season and longer during peak demand periods in Framura.
Framura Airbnb Cancellation Policy Trends Analysis (2025)
Super Strict 30 Days
1 listings
2.6% of total
Super Strict 60 Days
3 listings
7.7% of total
Flexible
6 listings
15.4% of total
Moderate
22 listings
56.4% of total
Strict
7 listings
17.9% of total
Cancellation Policy Insights for Framura
- The prevailing Airbnb cancellation policy trend in Framura is Moderate, used by 56.4% of listings.
- The market strongly favors guest-friendly terms, with 71.8% of listings offering Flexible or Moderate policies. This suggests guests in Framura may expect booking flexibility.
Recommendations for Hosts
- Consider adopting a Moderate policy to align with the 56.4% market standard in Framura.
- Regularly review your cancellation policy against competitors and market demand shifts in Framura.
Framura STR Booking Lead Time Analysis (2025)
Average Booking Lead Time by Month
Booking Lead Time Insights for Framura
- The overall average booking lead time for vacation rentals in Framura is 70 days.
- Guests book furthest in advance for stays during August (average 114 days), likely coinciding with peak travel demand or local events.
- The shortest booking windows occur for stays in February (average 43 days), indicating more last-minute travel plans during this time.
- Seasonally, Summer (103 days avg.) sees the longest lead times, while Winter (53 days avg.) has the shortest, reflecting typical travel planning cycles.
Recommendations for Hosts
- Use the overall average lead time (70 days) as a baseline for your pricing and availability strategy in Framura.
- For August stays, consider implementing length-of-stay discounts or slightly higher rates for bookings made less than 114 days out to capitalize on advance planning.
- Target marketing efforts for the Summer season well in advance (at least 103 days) to capture early planners.
- Monitor your own booking lead times against these Framura averages to identify opportunities for dynamic pricing adjustments.
Popular & Essential Airbnb Amenities in Framura (2025)
Amenity Prevalence
Amenity Insights for Framura
- Essential amenities in Framura that guests expect include: Kitchen, Heating. Lacking these (any) could significantly impact bookings.
- Popular amenities like Hangers, Essentials, Hot water are common but not universal. Offering these can provide a competitive edge.
- Warning: Wifi is not universally provided but is considered essential globally. Ensure reliable Wifi is offered.
Recommendations for Hosts
- Ensure your listing includes all essential amenities for Framura: Kitchen, Heating.
- Prioritize adding missing essentials: Heating.
- Consider adding popular differentiators like Hangers or Essentials to increase appeal.
- Highlight unique or less common amenities you offer (e.g., hot tub, dedicated workspace, EV charger) in your listing description and photos.
- Regularly check competitor amenities in Framura to stay competitive.
Framura Airbnb Guest Demographics & Profile Analysis (2025)
Guest Profile Summary for Framura
- The typical guest profile for Airbnb in Framura consists of predominantly international visitors (83%), with top international origins including France, typically belonging to the Post-2000s (Gen Z/Alpha) group (50%), primarily speaking English or French.
- Domestic travelers account for 17.3% of guests.
- Key international markets include Germany (23.4%) and France (20.1%).
- Top languages spoken are English (37.9%) followed by French (17.2%).
- A significant demographic segment is the Post-2000s (Gen Z/Alpha) group, representing 50% of guests.
Recommendations for Hosts
- Focus marketing internationally, particularly towards travelers from France.
- Tailor amenities and listing descriptions to appeal to the dominant Post-2000s (Gen Z/Alpha) demographic (e.g., highlight fast WiFi, smart home features, local guides).
- Highlight unique local experiences or amenities relevant to the primary guest profile.
- Consider seasonal promotions aligned with peak travel times for key origin markets.
Nearby Short-Term Rental Market Comparison
How does the Framura Airbnb market stack up against its neighbors? Compare key performance metrics like average monthly revenue, ADR, and occupancy rates in surrounding areas to understand the broader regional STR landscape.
| Market | Active Properties | Monthly Revenue | Daily Rate | Avg. Occupancy |
|---|---|---|---|---|
| Laglio | 64 | $4,873 | $463.61 | 47% |
| Brenzone sul Garda | 19 | $4,128 | $335.25 | 52% |
| Portofino | 68 | $4,086 | $454.35 | 44% |
| Sala Comacina | 64 | $3,794 | $400.27 | 50% |
| Cossano Belbo | 13 | $3,632 | $284.21 | 42% |
| Bellagio | 373 | $3,630 | $328.26 | 55% |
| Crespina | 16 | $3,526 | $493.64 | 48% |
| Oliveto Lario | 99 | $3,509 | $327.42 | 55% |
| Carate Urio | 71 | $3,379 | $331.90 | 44% |
| Brienno | 39 | $3,327 | $337.92 | 45% |