Follo Airbnb Market Analysis 2025: Short Term Rental Data & Vacation Rental Statistics in Liguria, Italy
Is Airbnb profitable in Follo in 2025? Explore comprehensive Airbnb analytics for Follo, Liguria, Italy to uncover income potential. This 2025 STR market report for Follo, based on AirROI data from April 2024 to March 2025, reveals key trends in the niche market of 25 active listings.
Whether you're considering an Airbnb investment in Follo, optimizing your existing vacation rental, or exploring rental arbitrage opportunities, understanding the Follo Airbnb data is crucial. Navigating the high regulation landscape is key to maximizing your short term rental income potential. Let's dive into the specifics.
Key Follo Airbnb Performance Metrics Overview
Monthly Airbnb Revenue Variations & Income Potential in Follo (2025)
Understanding the monthly revenue variations for Airbnb listings in Follo is key to maximizing your short term rental income potential. Seasonality significantly impacts earnings. Our analysis, based on data from the past 12 months, shows that the peak revenue month for STRs in Follo is typically August, while January often presents the lowest earnings, highlighting opportunities for strategic pricing adjustments during shoulder and low seasons. Explore the typical Airbnb income in Follo across different performance tiers:
- Best-in-class properties (Top 10%) achieve $2,288+ monthly, often utilizing dynamic pricing and superior guest experiences.
- Strong performing properties (Top 25%) earn $1,359 or more, indicating effective management and desirable locations/amenities.
- Typical properties (Median) generate around $735 per month, representing the average market performance.
- Entry-level properties (Bottom 25%) see earnings around $457, often with potential for optimization.
Average Monthly Airbnb Earnings Trend in Follo
Follo Airbnb Occupancy Rate Trends (2025)
Maximize your bookings by understanding the Follo STR occupancy trends. Seasonal demand shifts significantly influence how often properties are booked. Typically, Augustsees the highest demand (peak season occupancy), while January experiences the lowest (low season). Effective strategies, like adjusting minimum stays or offering promotions, can boost occupancy during slower periods. Here's how different property tiers perform in Follo:
- Best-in-class properties (Top 10%) achieve 62%+ occupancy, indicating high desirability and potentially optimized availability.
- Strong performing properties (Top 25%) maintain 41% or higher occupancy, suggesting good market fit and guest satisfaction.
- Typical properties (Median) have an occupancy rate around 24%.
- Entry-level properties (Bottom 25%) average 12% occupancy, potentially facing higher vacancy.
Average Monthly Occupancy Rate Trend in Follo
Average Daily Rate (ADR) Airbnb Trends in Follo (2025)
Effective short term rental pricing strategy in Follo involves understanding monthly ADR fluctuations. The Average Daily Rate (ADR) for Airbnb in Follo typically peaks in July and dips lowest during February. Leveraging Airbnb dynamic pricing tools or strategies based on this seasonality can significantly boost revenue. Here's a look at the typical nightly rates achieved:
- Best-in-class properties (Top 10%) command rates of $151+ per night, often due to premium features or locations.
- Strong performing properties (Top 25%) achieve nightly rates of $122 or more.
- Typical properties (Median) charge around $84 per night.
- Entry-level properties (Bottom 25%) earn around $63 per night.
Average Daily Rate (ADR) Trend by Month in Follo
Get Live Follo Market Intelligence 👇

Explore Real-time Analytics
Airbnb Seasonality Analysis & Trends in Follo (2025)
Peak Season (August, July, May)
- Revenue averages $1,734 per month
- Occupancy rates average 46.6%
- Daily rates average $108
Shoulder Season
- Revenue averages $951 per month
- Occupancy maintains around 29.6%
- Daily rates hold near $106
Low Season (January, February, March)
- Revenue drops to average $344 per month
- Occupancy decreases to average 12.7%
- Daily rates adjust to average $99
Seasonality Insights for Follo
- The Airbnb seasonality in Follo shows highly seasonal trends requiring careful strategy. While the sections above show seasonal averages, it's also insightful to look at the extremes:
- During the high season, the absolute peak month showcases Follo's highest earning potential, with monthly revenues capable of climbing to $2,138, occupancy reaching a high of 62.9%, and ADRs peaking at $109.
- Conversely, the slowest single month of the year, typically falling within the low season, marks the market's lowest point. In this month, revenue might dip to $290, occupancy could drop to 10.0%, and ADRs may adjust down to $99.
- Understanding both the seasonal averages and these monthly peaks and troughs in revenue, occupancy, and ADR is crucial for maximizing your Airbnb profit potential in Follo.
Seasonal Strategies for Maximizing Profit
- Peak Season: Maximize revenue through premium pricing and potentially longer minimum stays. Ensure high availability.
- Low Season: Offer competitive pricing, special promotions (e.g., extended stay discounts), and flexible cancellation policies. Target off-season travelers like remote workers or budget-conscious guests.
- Shoulder Seasons: Implement dynamic pricing that balances peak and low rates. Target weekend travelers or specific events. Offer slightly more flexible terms than peak season.
- Regularly analyze your own performance against these Follo seasonality benchmarks and adjust your pricing and availability strategy accordingly.
Best Areas for Airbnb Investment in Follo (2025)
Exploring the top neighborhoods for short-term rentals in Follo? This section highlights key areas, outlining why they are attractive for hosts and guests, along with notable local attractions. Consider these locations based on your target guest profile and investment strategy.
| Neighborhood / Area | Why Host Here? (Target Guests & Appeal) | Key Attractions & Landmarks |
|---|---|---|
| Cinque Terre | A stunning coastal region famous for its colorful fishing villages, breathtaking views, and hiking paths. Popular tourist destination for those seeking scenic beauty and outdoor activities. | Monterosso al Mare, Vernazza, Corniglia, Manarola, Riomaggiore, Cinque Terre National Park |
| Portofino | A picturesque fishing village known for its charming harbor, upscale boutiques, and scenic views. Ideal for luxury travelers looking for a beautiful getaway. | Portofino Harbor, Castello Brown, Church of St. George, Parks of Portofino, Paraggi Beach, San Fruttuoso Abbey |
| Genoa | The capital of Liguria, known for its rich history, impressive architecture, and vibrant cultural scene. A major urban center attracting various tourists. | Aquarium of Genoa, Piazza De Ferrari, Palazzi dei Rolli, Genoa Cathedral, Old Port, Via Garibaldi |
| Santa Margherita Ligure | A lovely town on the Ligurian coast known for its beaches and Mediterranean charm. Family-friendly destination with a relaxed atmosphere. | Santa Margherita Beach, Parco Quinto Martini, Villa Durazzo, Church of St. Margaret, Marina di Santa Margherita |
| La Spezia | A strategic hub for exploring Cinque Terre, La Spezia offers an authentic Italian city experience with beautiful waterfront and various dining options. | La Spezia Harbor, Castello Doria, Museo Tecnico Navale, Ghetto di La Spezia, Piazza Garibaldi, Cinque Terre service |
| Rapallo | A charming coastal town known for its beautiful promenade and proximity to Portofino. Great for families and leisure travelers. | Rapallo Castle, Basilica dei Santi Gervasio e Protasio, Molo di Santa Margherita, San Michele di Pagana, Cable Car to Montallegro |
| Sestri Levante | Known for its enchanting bay and beautiful beaches, this town attracts beach lovers and families looking for a relaxing vacation. | Baia del Silenzio, Baia delle Favole, Convento dell'Annunziata, Carruggio di Sestri, Parco Nelson Mandela |
| Levanto | A gateway to the Cinque Terre, Levanto offers great beaches and is popular with surfers and outdoor enthusiasts. Perfect for those seeking adventure. | Levanto Beach, Sentiero Azzurro, Castle of Levanto, Playa de Levanto, Biking trails |
Understanding Airbnb License Requirements & STR Laws in Follo (2025)
Yes, Follo, Liguria, Italy enforces high STR regulations. Obtaining a license and ensuring compliance is almost certainly required according to current 2025 STR laws. Always verify the latest short term rental regulations and Airbnb license requirements directly with local government authorities for Follo to ensure full compliance before hosting.
(Source: AirROI data, 2025, based on 60% licensed listings)
Top Performing Airbnb Properties in Follo (2025)
Benchmark your potential! Explore examples of top-performing Airbnb properties in Follobased on Trailing Twelve Month (TTM) revenue. Analyze their characteristics, revenue, occupancy rate, and ADR to understand what drives success in this market.
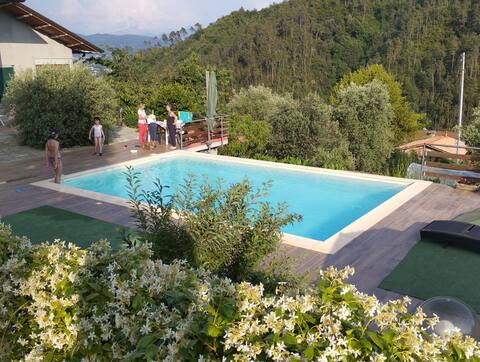
Holiday house Villa degli Olivi
Entire Place • 1 bedroom
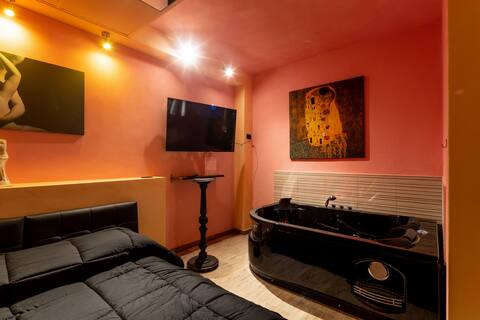
Romantic hydrosuite area 5 terre
Entire Place • 1 bedroom

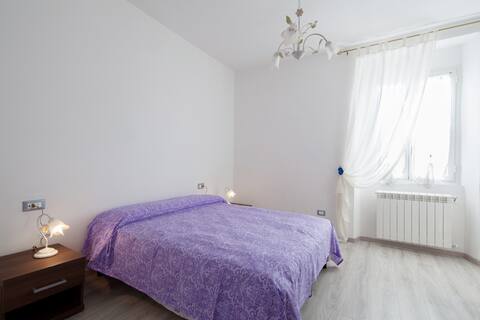
Home nearby Cinque Terre
Entire Place • 3 bedrooms
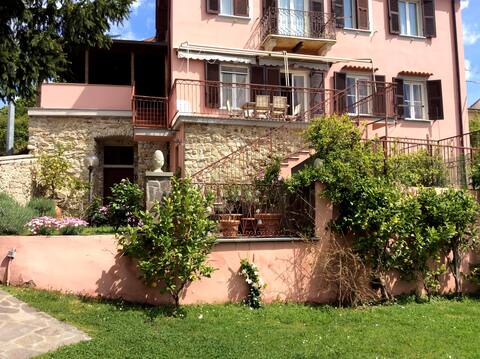
Two steps outside 5 terre, Casa Sterinella!!
Entire Place • 2 bedrooms

Private Italian House
Entire Place • 1 bedroom
Aia dei Limoni, La Spezia - 5 Terre
Entire Place • 3 bedrooms
Note: Performance varies based on location, size, amenities, seasonality, and management quality. Data reflects the past 12 months.
Top Performing Airbnb Hosts in Follo (2025)
Learn from the best! This table showcases top-performing Airbnb hosts in Follo based on the number of properties managed and estimated total revenue over the past year. Analyze their scale and performance metrics.
| Host Name | Properties | Grossing Revenue | Stay Reviews | Avg Rating |
|---|---|---|---|---|
| Alberto | 1 | $27,142 | 16 | 4.88/5.0 |
| Francesca | 1 | $20,240 | 12 | 3.67/5.0 |
| Eva And Elia | 4 | $19,837 | 118 | 4.59/5.0 |
| Federico | 1 | $17,940 | 357 | 4.96/5.0 |
| Alessandro | 1 | $13,657 | 146 | 4.81/5.0 |
| Simone | 1 | $12,221 | 63 | 4.73/5.0 |
| Andrea | 1 | $11,505 | 27 | 4.89/5.0 |
| Host #461814422 | 1 | $11,186 | 101 | 4.77/5.0 |
| Paola | 1 | $10,074 | 56 | 4.84/5.0 |
| Federica | 1 | $8,982 | 23 | 4.87/5.0 |
Analyzing the strategies of top hosts, such as their property selection, pricing, and guest communication, can offer valuable lessons for optimizing your own Airbnb operations in Follo.
Dive Deeper: Advanced Follo STR Market Data (2025)
Ready to unlock more insights? AirROI provides access to advanced metrics and comprehensive Airbnb data for Follo. Explore detailed analytics beyond this report to refine your investment strategy, optimize pricing, and maximize your vacation rental profits.
Explore Advanced MetricsFollo Short-Term Rental Market Composition (2025): Property & Room Types
Room Type Distribution
Property Type Distribution
Market Composition Insights for Follo
- The Follo Airbnb market composition is heavily skewed towards Entire Home/Apt listings, which make up 72% of the 25 active rentals. This indicates strong guest preference for privacy and space.
- Looking at the property type distribution in Follo, House properties are the most common (40%), reflecting the local real estate landscape.
- Houses represent a significant 40% portion, catering likely to families or larger groups.
- The presence of 8% Hotel/Boutique listings indicates integration with traditional hospitality.
Follo Airbnb Room Capacity Analysis (2025): Bedroom Distribution
Distribution of Listings by Number of Bedrooms
Room Capacity Insights for Follo
- The dominant room capacity in Follo is 2 bedrooms listings, making up 40% of the market. This suggests a strong demand for properties suitable for couples or solo travelers.
- Together, 2 bedrooms and 1 bedroom properties represent 72.0% of the active Airbnb listings in Follo, indicating a high concentration in these sizes.
- Listings with 3+ bedrooms (8.0%) represent a smaller niche, potentially indicating an underserved market for larger group accommodations in Follo.
Follo Vacation Rental Guest Capacity Trends (2025)
Distribution of Listings by Guest Capacity
Guest Capacity Insights for Follo
- The most common guest capacity trend in Follo vacation rentals is listings accommodating 4 guests (32%). This suggests the primary traveler segment is likely small families or groups.
- Properties designed for 4 guests and 6 guests dominate the Follo STR market, accounting for 52.0% of listings.
- 24.0% of properties accommodate 6+ guests, serving the market segment for larger families or group travel in Follo.
- On average, properties in Follo are equipped to host 3.5 guests.
Follo Airbnb Booking Patterns (2025): Available vs. Booked Days
Available Days Distribution
Booked Days Distribution
Booking Pattern Insights for Follo
- The most common availability pattern in Follo falls within the 271-366 days range, representing 72% of listings. This suggests many properties have significant open periods on their calendars.
- Approximately 88.0% of listings show high availability (181+ days open annually), indicating potential for increased bookings or specific owner usage patterns.
- For booked days, the 31-90 days range is most frequent in Follo (44%), reflecting common guest stay durations or potential owner blocking patterns.
- A notable 16.0% of properties secure long booking periods (181+ days booked per year), highlighting successful long-term rental strategies or significant owner usage.
Follo Airbnb Minimum Stay Requirements Analysis
Distribution of Listings by Minimum Night Requirement
1 Night
7 listings
31.8% of total
2 Nights
6 listings
27.3% of total
3 Nights
3 listings
13.6% of total
4-6 Nights
2 listings
9.1% of total
7-29 Nights
3 listings
13.6% of total
30+ Nights
1 listings
4.5% of total
Key Insights
- The most prevalent minimum stay requirement in Follo is 1 Night, adopted by 31.8% of listings. This highlights the market's preference for shorter, flexible bookings.
Recommendations
- Align with the market by considering a 1 Night minimum stay, as 31.8% of Follo hosts use this setting.
- Adjust minimum nights based on seasonality – potentially shorter during low season and longer during peak demand periods in Follo.
Follo Airbnb Cancellation Policy Trends Analysis (2025)
Flexible
4 listings
21.1% of total
Moderate
7 listings
36.8% of total
Strict
8 listings
42.1% of total
Cancellation Policy Insights for Follo
- The prevailing Airbnb cancellation policy trend in Follo is Strict, used by 42.1% of listings.
- There's a relatively balanced mix between guest-friendly (57.9%) and stricter (42.1%) policies, offering choices for different guest needs.
Recommendations for Hosts
- Consider adopting a Strict policy to align with the 42.1% market standard in Follo.
- With 42.1% using Strict terms, this is a viable option in Follo, particularly for high-value properties or during peak demand periods.
- Regularly review your cancellation policy against competitors and market demand shifts in Follo.
Follo STR Booking Lead Time Analysis (2025)
Average Booking Lead Time by Month
Booking Lead Time Insights for Follo
- The overall average booking lead time for vacation rentals in Follo is 60 days.
- Guests book furthest in advance for stays during July (average 133 days), likely coinciding with peak travel demand or local events.
- The shortest booking windows occur for stays in January (average 28 days), indicating more last-minute travel plans during this time.
- Seasonally, Summer (85 days avg.) sees the longest lead times, while Spring (47 days avg.) has the shortest, reflecting typical travel planning cycles.
Recommendations for Hosts
- Use the overall average lead time (60 days) as a baseline for your pricing and availability strategy in Follo.
- For July stays, consider implementing length-of-stay discounts or slightly higher rates for bookings made less than 133 days out to capitalize on advance planning.
- Target marketing efforts for the Summer season well in advance (at least 85 days) to capture early planners.
- Monitor your own booking lead times against these Follo averages to identify opportunities for dynamic pricing adjustments.
Popular & Essential Airbnb Amenities in Follo (2025)
Amenity Prevalence
Amenity Insights for Follo
- Essential amenities in Follo that guests expect include: Heating, Wifi. Lacking these (any) could significantly impact bookings.
- Popular amenities like Hot water, Essentials, Kitchen are common but not universal. Offering these can provide a competitive edge.
Recommendations for Hosts
- Ensure your listing includes all essential amenities for Follo: Heating, Wifi.
- Prioritize adding missing essentials: Heating, Wifi.
- Consider adding popular differentiators like Hot water or Essentials to increase appeal.
- Highlight unique or less common amenities you offer (e.g., hot tub, dedicated workspace, EV charger) in your listing description and photos.
- Regularly check competitor amenities in Follo to stay competitive.
Follo Airbnb Guest Demographics & Profile Analysis (2025)
Guest Profile Summary for Follo
- The typical guest profile for Airbnb in Follo consists of predominantly international visitors (80%), with top international origins including Italy, typically belonging to the Post-2000s (Gen Z/Alpha) group (50%), primarily speaking English or French.
- Domestic travelers account for 19.6% of guests.
- Key international markets include France (43.6%) and Italy (19.6%).
- Top languages spoken are English (35.5%) followed by French (24.7%).
- A significant demographic segment is the Post-2000s (Gen Z/Alpha) group, representing 50% of guests.
Recommendations for Hosts
- Focus marketing internationally, particularly towards travelers from Italy.
- Tailor amenities and listing descriptions to appeal to the dominant Post-2000s (Gen Z/Alpha) demographic (e.g., highlight fast WiFi, smart home features, local guides).
- Highlight unique local experiences or amenities relevant to the primary guest profile.
- Consider seasonal promotions aligned with peak travel times for key origin markets.
Nearby Short-Term Rental Market Comparison
How does the Follo Airbnb market stack up against its neighbors? Compare key performance metrics like average monthly revenue, ADR, and occupancy rates in surrounding areas to understand the broader regional STR landscape.
| Market | Active Properties | Monthly Revenue | Daily Rate | Avg. Occupancy |
|---|---|---|---|---|
| Laglio | 64 | $4,873 | $463.61 | 47% |
| Brenzone sul Garda | 19 | $4,128 | $335.25 | 52% |
| Portofino | 68 | $4,086 | $454.35 | 44% |
| Sala Comacina | 64 | $3,794 | $400.27 | 50% |
| Cossano Belbo | 13 | $3,632 | $284.21 | 42% |
| Bellagio | 373 | $3,630 | $328.26 | 55% |
| Crespina | 16 | $3,526 | $493.64 | 48% |
| Oliveto Lario | 99 | $3,509 | $327.42 | 55% |
| Carate Urio | 71 | $3,379 | $331.90 | 44% |
| Brienno | 39 | $3,327 | $337.92 | 45% |