Cipressa Airbnb Market Analysis 2025: Short Term Rental Data & Vacation Rental Statistics in Liguria, Italy
Is Airbnb profitable in Cipressa in 2025? Explore comprehensive Airbnb analytics for Cipressa, Liguria, Italy to uncover income potential. This 2025 STR market report for Cipressa, based on AirROI data from April 2024 to March 2025, reveals key trends in the niche market of 82 active listings.
Whether you're considering an Airbnb investment in Cipressa, optimizing your existing vacation rental, or exploring rental arbitrage opportunities, understanding the Cipressa Airbnb data is crucial. Navigating the high regulation landscape is key to maximizing your short term rental income potential. Let's dive into the specifics.
Key Cipressa Airbnb Performance Metrics Overview
Monthly Airbnb Revenue Variations & Income Potential in Cipressa (2025)
Understanding the monthly revenue variations for Airbnb listings in Cipressa is key to maximizing your short term rental income potential. Seasonality significantly impacts earnings. Our analysis, based on data from the past 12 months, shows that the peak revenue month for STRs in Cipressa is typically August, while February often presents the lowest earnings, highlighting opportunities for strategic pricing adjustments during shoulder and low seasons. Explore the typical Airbnb income in Cipressa across different performance tiers:
- Best-in-class properties (Top 10%) achieve $3,942+ monthly, often utilizing dynamic pricing and superior guest experiences.
- Strong performing properties (Top 25%) earn $2,208 or more, indicating effective management and desirable locations/amenities.
- Typical properties (Median) generate around $1,210 per month, representing the average market performance.
- Entry-level properties (Bottom 25%) see earnings around $676, often with potential for optimization.
Average Monthly Airbnb Earnings Trend in Cipressa
Cipressa Airbnb Occupancy Rate Trends (2025)
Maximize your bookings by understanding the Cipressa STR occupancy trends. Seasonal demand shifts significantly influence how often properties are booked. Typically, Augustsees the highest demand (peak season occupancy), while February experiences the lowest (low season). Effective strategies, like adjusting minimum stays or offering promotions, can boost occupancy during slower periods. Here's how different property tiers perform in Cipressa:
- Best-in-class properties (Top 10%) achieve 70%+ occupancy, indicating high desirability and potentially optimized availability.
- Strong performing properties (Top 25%) maintain 53% or higher occupancy, suggesting good market fit and guest satisfaction.
- Typical properties (Median) have an occupancy rate around 32%.
- Entry-level properties (Bottom 25%) average 17% occupancy, potentially facing higher vacancy.
Average Monthly Occupancy Rate Trend in Cipressa
Average Daily Rate (ADR) Airbnb Trends in Cipressa (2025)
Effective short term rental pricing strategy in Cipressa involves understanding monthly ADR fluctuations. The Average Daily Rate (ADR) for Airbnb in Cipressa typically peaks in August and dips lowest during October. Leveraging Airbnb dynamic pricing tools or strategies based on this seasonality can significantly boost revenue. Here's a look at the typical nightly rates achieved:
- Best-in-class properties (Top 10%) command rates of $264+ per night, often due to premium features or locations.
- Strong performing properties (Top 25%) achieve nightly rates of $164 or more.
- Typical properties (Median) charge around $119 per night.
- Entry-level properties (Bottom 25%) earn around $92 per night.
Average Daily Rate (ADR) Trend by Month in Cipressa
Get Live Cipressa Market Intelligence 👇

Explore Real-time Analytics
Airbnb Seasonality Analysis & Trends in Cipressa (2025)
Peak Season (August, July, September)
- Revenue averages $3,453 per month
- Occupancy rates average 59.2%
- Daily rates average $171
Shoulder Season
- Revenue averages $1,605 per month
- Occupancy maintains around 33.0%
- Daily rates hold near $158
Low Season (January, February, March)
- Revenue drops to average $644 per month
- Occupancy decreases to average 20.4%
- Daily rates adjust to average $154
Seasonality Insights for Cipressa
- The Airbnb seasonality in Cipressa shows highly seasonal trends requiring careful strategy. While the sections above show seasonal averages, it's also insightful to look at the extremes:
- During the high season, the absolute peak month showcases Cipressa's highest earning potential, with monthly revenues capable of climbing to $4,261, occupancy reaching a high of 69.8%, and ADRs peaking at $176.
- Conversely, the slowest single month of the year, typically falling within the low season, marks the market's lowest point. In this month, revenue might dip to $567, occupancy could drop to 18.1%, and ADRs may adjust down to $150.
- Understanding both the seasonal averages and these monthly peaks and troughs in revenue, occupancy, and ADR is crucial for maximizing your Airbnb profit potential in Cipressa.
Seasonal Strategies for Maximizing Profit
- Peak Season: Maximize revenue through premium pricing and potentially longer minimum stays. Ensure high availability.
- Low Season: Offer competitive pricing, special promotions (e.g., extended stay discounts), and flexible cancellation policies. Target off-season travelers like remote workers or budget-conscious guests.
- Shoulder Seasons: Implement dynamic pricing that balances peak and low rates. Target weekend travelers or specific events. Offer slightly more flexible terms than peak season.
- Regularly analyze your own performance against these Cipressa seasonality benchmarks and adjust your pricing and availability strategy accordingly.
Best Areas for Airbnb Investment in Cipressa (2025)
Exploring the top neighborhoods for short-term rentals in Cipressa? This section highlights key areas, outlining why they are attractive for hosts and guests, along with notable local attractions. Consider these locations based on your target guest profile and investment strategy.
| Neighborhood / Area | Why Host Here? (Target Guests & Appeal) | Key Attractions & Landmarks |
|---|---|---|
| Cipressa Centro | Charming central area known for its quaint streets and traditional Ligurian architecture. Ideal for tourists who enjoy a picturesque Italian village atmosphere and local culture. | Church of San Bartolomeo, Piazza della Libertà, local trattorias, scenic viewpoints over the sea, the annual olive oil festival |
| Mediterranean Coastline | Breathtaking seaside area that attracts beach lovers and outdoor enthusiasts. Great for those looking for sun, sea, and relaxation. | Beaches of Cipressa, Scuba diving, Walking trails along the coast, Beach bars and restaurants, Water sports activities |
| San Lorenzo al Mare | Popular nearby village known for its lovely promenade along the sea. Draws cyclists and families looking for a relaxed vibe by the beach. | San Lorenzo Beach, Cycling paths, Seafront promenade, Local seafood restaurants, Annual festivals |
| Riva Ligure | Coastal village with stunning views and a laid-back atmosphere. Ideal for guests seeking tranquility and nature, with easy access to the Riviera. | Riva Ligure beach, Mediterranean parks, Cycling routes, Historic architecture, Local markets |
| Imperia | Nearby town offering a mix of history, culture, and beautiful beaches. Attracts visitors looking for more urban experiences but still close to nature. | Imperia Porto, Museo dell'Olivo, Shopping in Oneglia, Historical sites, Beaches |
| Montegrazie | A serene hilltop area known for its vineyards and olive groves. Perfect for travelers looking to escape the hustle and bustle and enjoy wine tasting and hiking. | Wine tasting tours, Vineyards, Scenic hiking trails, Peaceful countryside, Local festivals |
| Diano Marina | Lively beach resort town that's perfect for tourists looking for entertainment, dining, and beachfront activities. Very popular during the summer. | Diano Marina beach, Shopping and nightlife, Parks and gardens, Local cuisine, Water sports |
| Genoa | While a bit farther away, Genoa is a historic port city with rich cultural heritage, making it an appealing option for guests looking for day trips and urban exploration. | The Lanterna, Aquarium of Genoa, Piazza De Ferrari, Historic center, Local seafood |
Understanding Airbnb License Requirements & STR Laws in Cipressa (2025)
Yes, Cipressa, Liguria, Italy enforces high STR regulations. Obtaining a license and ensuring compliance is almost certainly required according to current 2025 STR laws. Always verify the latest short term rental regulations and Airbnb license requirements directly with local government authorities for Cipressa to ensure full compliance before hosting.
(Source: AirROI data, 2025, based on 67% licensed listings)
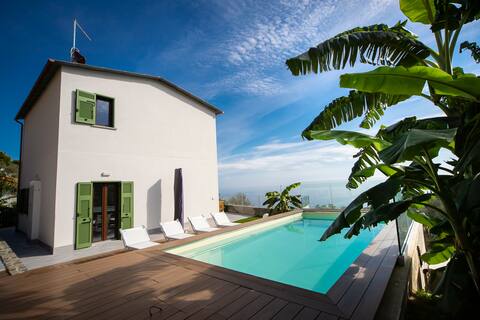
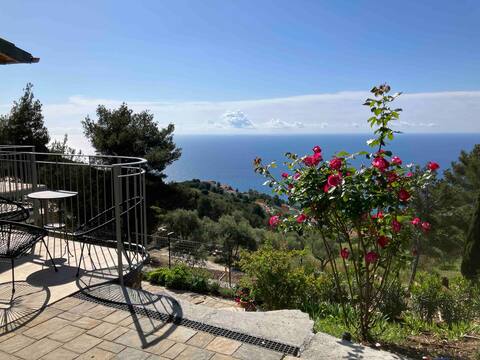
Top Performing Airbnb Properties in Cipressa (2025)
Benchmark your potential! Explore examples of top-performing Airbnb properties in Cipressabased on Trailing Twelve Month (TTM) revenue. Analyze their characteristics, revenue, occupancy rate, and ADR to understand what drives success in this market.

prestigiosa villa vista mare
Entire Place • 8 bedrooms

Villa Il Pino Blu
Entire Place • 3 bedrooms
Sunset
Entire Place • 2 bedrooms

The Angioletta Exclusive Villa overlooking the sea
Entire Place • 4 bedrooms
Belvedere villino+dependance
Entire Place • 2 bedrooms

Belvedere sea view cottage
Entire Place • 1 bedroom
Note: Performance varies based on location, size, amenities, seasonality, and management quality. Data reflects the past 12 months.
Top Performing Airbnb Hosts in Cipressa (2025)
Learn from the best! This table showcases top-performing Airbnb hosts in Cipressa based on the number of properties managed and estimated total revenue over the past year. Analyze their scale and performance metrics.
| Host Name | Properties | Grossing Revenue | Stay Reviews | Avg Rating |
|---|---|---|---|---|
| Buona Vita Viva | 12 | $129,464 | 40 | 1.57/5.0 |
| Host #360831287 | 1 | $112,870 | 0 | 0.00/5.0 |
| Jacqueline | 3 | $104,943 | 156 | 4.87/5.0 |
| Pamela - Interhome Group | 10 | $100,823 | 81 | 4.07/5.0 |
| Nicole | 3 | $73,488 | 40 | 4.40/5.0 |
| Anna | 1 | $67,788 | 69 | 4.91/5.0 |
| Francesco & Marina | 4 | $66,341 | 234 | 4.91/5.0 |
| Eraldo | 1 | $60,671 | 24 | 4.75/5.0 |
| Pamela - Interhome Group | 2 | $45,588 | 10 | 4.93/5.0 |
| Francesco | 2 | $44,123 | 127 | 4.50/5.0 |
Analyzing the strategies of top hosts, such as their property selection, pricing, and guest communication, can offer valuable lessons for optimizing your own Airbnb operations in Cipressa.
Dive Deeper: Advanced Cipressa STR Market Data (2025)
Ready to unlock more insights? AirROI provides access to advanced metrics and comprehensive Airbnb data for Cipressa. Explore detailed analytics beyond this report to refine your investment strategy, optimize pricing, and maximize your vacation rental profits.
Explore Advanced MetricsCipressa Short-Term Rental Market Composition (2025): Property & Room Types
Room Type Distribution
Property Type Distribution
Market Composition Insights for Cipressa
- The Cipressa Airbnb market composition is heavily skewed towards Entire Home/Apt listings, which make up 100% of the 82 active rentals. This indicates strong guest preference for privacy and space.
- Looking at the property type distribution in Cipressa, Apartment/Condo properties are the most common (58.5%), reflecting the local real estate landscape.
- Houses represent a significant 40.2% portion, catering likely to families or larger groups.
- Smaller segments like hotel/boutique (combined 1.2%) offer potential for unique stay experiences.
Cipressa Airbnb Room Capacity Analysis (2025): Bedroom Distribution
Distribution of Listings by Number of Bedrooms
Room Capacity Insights for Cipressa
- The dominant room capacity in Cipressa is 1 bedroom listings, making up 40.2% of the market. This suggests a strong demand for properties suitable for couples or solo travelers.
- Together, 1 bedroom and 2 bedrooms properties represent 74.3% of the active Airbnb listings in Cipressa, indicating a high concentration in these sizes.
- A significant 22.0% of listings offer 3+ bedrooms, catering to larger groups and families seeking more space in Cipressa.
Cipressa Vacation Rental Guest Capacity Trends (2025)
Distribution of Listings by Guest Capacity
Guest Capacity Insights for Cipressa
- The most common guest capacity trend in Cipressa vacation rentals is listings accommodating 4 guests (35.4%). This suggests the primary traveler segment is likely small families or groups.
- Properties designed for 4 guests and 6 guests dominate the Cipressa STR market, accounting for 57.4% of listings.
- 36.6% of properties accommodate 6+ guests, serving the market segment for larger families or group travel in Cipressa.
- On average, properties in Cipressa are equipped to host 4.8 guests.
Cipressa Airbnb Booking Patterns (2025): Available vs. Booked Days
Available Days Distribution
Booked Days Distribution
Booking Pattern Insights for Cipressa
- The most common availability pattern in Cipressa falls within the 271-366 days range, representing 56.1% of listings. This suggests many properties have significant open periods on their calendars.
- Approximately 86.6% of listings show high availability (181+ days open annually), indicating potential for increased bookings or specific owner usage patterns.
- For booked days, the 91-180 days range is most frequent in Cipressa (32.9%), reflecting common guest stay durations or potential owner blocking patterns.
- A notable 13.4% of properties secure long booking periods (181+ days booked per year), highlighting successful long-term rental strategies or significant owner usage.
Cipressa Airbnb Minimum Stay Requirements Analysis
Distribution of Listings by Minimum Night Requirement
1 Night
12 listings
16% of total
2 Nights
12 listings
16% of total
3 Nights
14 listings
18.7% of total
4-6 Nights
8 listings
10.7% of total
7-29 Nights
10 listings
13.3% of total
30+ Nights
19 listings
25.3% of total
Key Insights
- The most prevalent minimum stay requirement in Cipressa is 30+ Nights, adopted by 25.3% of listings. This highlights the market's preference for longer commitments.
- A significant segment (25.3%) caters to monthly stays (30+ nights) in Cipressa, pointing to opportunities in the extended-stay market.
Recommendations
- Align with the market by considering a 30+ Nights minimum stay, as 25.3% of Cipressa hosts use this setting.
- If feasible, allowing 1-night stays, especially midweek or during low season, could capture last-minute bookings, as only 16% currently do.
- Explore offering discounts for stays of 30+ nights to attract the 25.3% of the market seeking extended stays.
- Adjust minimum nights based on seasonality – potentially shorter during low season and longer during peak demand periods in Cipressa.
Cipressa Airbnb Cancellation Policy Trends Analysis (2025)
Super Strict 30 Days
13 listings
20.3% of total
Flexible
16 listings
25% of total
Moderate
18 listings
28.1% of total
Strict
17 listings
26.6% of total
Cancellation Policy Insights for Cipressa
- The prevailing Airbnb cancellation policy trend in Cipressa is Moderate, used by 28.1% of listings.
- There's a relatively balanced mix between guest-friendly (53.1%) and stricter (26.6%) policies, offering choices for different guest needs.
Recommendations for Hosts
- Consider adopting a Moderate policy to align with the 28.1% market standard in Cipressa.
- Regularly review your cancellation policy against competitors and market demand shifts in Cipressa.
Cipressa STR Booking Lead Time Analysis (2025)
Average Booking Lead Time by Month
Booking Lead Time Insights for Cipressa
- The overall average booking lead time for vacation rentals in Cipressa is 69 days.
- Guests book furthest in advance for stays during July (average 128 days), likely coinciding with peak travel demand or local events.
- The shortest booking windows occur for stays in March (average 19 days), indicating more last-minute travel plans during this time.
- Seasonally, Summer (109 days avg.) sees the longest lead times, while Winter (32 days avg.) has the shortest, reflecting typical travel planning cycles.
Recommendations for Hosts
- Use the overall average lead time (69 days) as a baseline for your pricing and availability strategy in Cipressa.
- For July stays, consider implementing length-of-stay discounts or slightly higher rates for bookings made less than 128 days out to capitalize on advance planning.
- Target marketing efforts for the Summer season well in advance (at least 109 days) to capture early planners.
- Monitor your own booking lead times against these Cipressa averages to identify opportunities for dynamic pricing adjustments.
Popular & Essential Airbnb Amenities in Cipressa (2025)
Amenity Prevalence
Amenity Insights for Cipressa
- Essential amenities in Cipressa that guests expect include: Kitchen. Lacking these (this) could significantly impact bookings.
- Popular amenities like Washer, Heating, TV are common but not universal. Offering these can provide a competitive edge.
- Warning: Wifi is not universally provided but is considered essential globally. Ensure reliable Wifi is offered.
Recommendations for Hosts
- Ensure your listing includes all essential amenities for Cipressa: Kitchen.
- Prioritize adding missing essentials: Kitchen.
- Consider adding popular differentiators like Washer or Heating to increase appeal.
- Highlight unique or less common amenities you offer (e.g., hot tub, dedicated workspace, EV charger) in your listing description and photos.
- Regularly check competitor amenities in Cipressa to stay competitive.
Cipressa Airbnb Guest Demographics & Profile Analysis (2025)
Guest Profile Summary for Cipressa
- The typical guest profile for Airbnb in Cipressa consists of predominantly international visitors (80%), with top international origins including France, typically belonging to the Post-2000s (Gen Z/Alpha) group (50%), primarily speaking English or French.
- Domestic travelers account for 19.9% of guests.
- Key international markets include Germany (28.2%) and France (20.9%).
- Top languages spoken are English (34.8%) followed by French (18.5%).
- A significant demographic segment is the Post-2000s (Gen Z/Alpha) group, representing 50% of guests.
Recommendations for Hosts
- Focus marketing internationally, particularly towards travelers from France.
- Tailor amenities and listing descriptions to appeal to the dominant Post-2000s (Gen Z/Alpha) demographic (e.g., highlight fast WiFi, smart home features, local guides).
- Highlight unique local experiences or amenities relevant to the primary guest profile.
- Consider seasonal promotions aligned with peak travel times for key origin markets.
Nearby Short-Term Rental Market Comparison
How does the Cipressa Airbnb market stack up against its neighbors? Compare key performance metrics like average monthly revenue, ADR, and occupancy rates in surrounding areas to understand the broader regional STR landscape.
| Market | Active Properties | Monthly Revenue | Daily Rate | Avg. Occupancy |
|---|---|---|---|---|
| Monteu Roero | 16 | $4,432 | $540.14 | 36% |
| Ramatuelle | 213 | $3,891 | $670.10 | 41% |
| Saint-Jean-Cap-Ferrat | 107 | $3,844 | $424.21 | 46% |
| Cossano Belbo | 13 | $3,632 | $284.21 | 42% |
| Saint-Tropez | 742 | $3,498 | $506.57 | 41% |
| Cassinasco | 18 | $3,219 | $545.40 | 41% |
| Èze | 153 | $3,168 | $345.84 | 47% |
| Opio | 40 | $3,057 | $540.62 | 37% |
| Villefranche-sur-Mer | 501 | $2,977 | $268.57 | 52% |
| Gassin | 384 | $2,939 | $434.44 | 40% |