Castellaro Airbnb Market Analysis 2025: Short Term Rental Data & Vacation Rental Statistics in Liguria, Italy
Is Airbnb profitable in Castellaro in 2025? Explore comprehensive Airbnb analytics for Castellaro, Liguria, Italy to uncover income potential. This 2025 STR market report for Castellaro, based on AirROI data from April 2024 to March 2025, reveals key trends in the niche market of 18 active listings.
Whether you're considering an Airbnb investment in Castellaro, optimizing your existing vacation rental, or exploring rental arbitrage opportunities, understanding the Castellaro Airbnb data is crucial. Navigating the high regulation landscape is key to maximizing your short term rental income potential. Let's dive into the specifics.
Key Castellaro Airbnb Performance Metrics Overview
Monthly Airbnb Revenue Variations & Income Potential in Castellaro (2025)
Understanding the monthly revenue variations for Airbnb listings in Castellaro is key to maximizing your short term rental income potential. Seasonality significantly impacts earnings. Our analysis, based on data from the past 12 months, shows that the peak revenue month for STRs in Castellaro is typically August, while January often presents the lowest earnings, highlighting opportunities for strategic pricing adjustments during shoulder and low seasons. Explore the typical Airbnb income in Castellaro across different performance tiers:
- Best-in-class properties (Top 10%) achieve $2,581+ monthly, often utilizing dynamic pricing and superior guest experiences.
- Strong performing properties (Top 25%) earn $1,386 or more, indicating effective management and desirable locations/amenities.
- Typical properties (Median) generate around $942 per month, representing the average market performance.
- Entry-level properties (Bottom 25%) see earnings around $491, often with potential for optimization.
Average Monthly Airbnb Earnings Trend in Castellaro
Castellaro Airbnb Occupancy Rate Trends (2025)
Maximize your bookings by understanding the Castellaro STR occupancy trends. Seasonal demand shifts significantly influence how often properties are booked. Typically, Augustsees the highest demand (peak season occupancy), while December experiences the lowest (low season). Effective strategies, like adjusting minimum stays or offering promotions, can boost occupancy during slower periods. Here's how different property tiers perform in Castellaro:
- Best-in-class properties (Top 10%) achieve 67%+ occupancy, indicating high desirability and potentially optimized availability.
- Strong performing properties (Top 25%) maintain 40% or higher occupancy, suggesting good market fit and guest satisfaction.
- Typical properties (Median) have an occupancy rate around 29%.
- Entry-level properties (Bottom 25%) average 14% occupancy, potentially facing higher vacancy.
Average Monthly Occupancy Rate Trend in Castellaro
Average Daily Rate (ADR) Airbnb Trends in Castellaro (2025)
Effective short term rental pricing strategy in Castellaro involves understanding monthly ADR fluctuations. The Average Daily Rate (ADR) for Airbnb in Castellaro typically peaks in January and dips lowest during September. Leveraging Airbnb dynamic pricing tools or strategies based on this seasonality can significantly boost revenue. Here's a look at the typical nightly rates achieved:
- Best-in-class properties (Top 10%) command rates of $311+ per night, often due to premium features or locations.
- Strong performing properties (Top 25%) achieve nightly rates of $136 or more.
- Typical properties (Median) charge around $99 per night.
- Entry-level properties (Bottom 25%) earn around $81 per night.
Average Daily Rate (ADR) Trend by Month in Castellaro
Get Live Castellaro Market Intelligence 👇

Explore Real-time Analytics
Airbnb Seasonality Analysis & Trends in Castellaro (2025)
Peak Season (August, July, October)
- Revenue averages $2,443 per month
- Occupancy rates average 49.2%
- Daily rates average $141
Shoulder Season
- Revenue averages $952 per month
- Occupancy maintains around 27.4%
- Daily rates hold near $148
Low Season (January, April, December)
- Revenue drops to average $616 per month
- Occupancy decreases to average 20.9%
- Daily rates adjust to average $185
Seasonality Insights for Castellaro
- The Airbnb seasonality in Castellaro shows highly seasonal trends requiring careful strategy. While the sections above show seasonal averages, it's also insightful to look at the extremes:
- During the high season, the absolute peak month showcases Castellaro's highest earning potential, with monthly revenues capable of climbing to $3,055, occupancy reaching a high of 66.3%, and ADRs peaking at $229.
- Conversely, the slowest single month of the year, typically falling within the low season, marks the market's lowest point. In this month, revenue might dip to $586, occupancy could drop to 18.6%, and ADRs may adjust down to $128.
- Understanding both the seasonal averages and these monthly peaks and troughs in revenue, occupancy, and ADR is crucial for maximizing your Airbnb profit potential in Castellaro.
Seasonal Strategies for Maximizing Profit
- Peak Season: Maximize revenue through premium pricing and potentially longer minimum stays. Ensure high availability.
- Low Season: Offer competitive pricing, special promotions (e.g., extended stay discounts), and flexible cancellation policies. Target off-season travelers like remote workers or budget-conscious guests.
- Shoulder Seasons: Implement dynamic pricing that balances peak and low rates. Target weekend travelers or specific events. Offer slightly more flexible terms than peak season.
- Regularly analyze your own performance against these Castellaro seasonality benchmarks and adjust your pricing and availability strategy accordingly.
Best Areas for Airbnb Investment in Castellaro (2025)
Exploring the top neighborhoods for short-term rentals in Castellaro? This section highlights key areas, outlining why they are attractive for hosts and guests, along with notable local attractions. Consider these locations based on your target guest profile and investment strategy.
| Neighborhood / Area | Why Host Here? (Target Guests & Appeal) | Key Attractions & Landmarks |
|---|---|---|
| Colla Micheri | A picturesque village known for its quaint charm and beautiful seaside views. Attracts tourists looking for a serene escape close to the beach, offering scenic walks and traditional Italian culture. | Colla Micheri beach, Historical village architecture, Coastal walking trails, Local trattorias, Artisan shops |
| San Lorenzo al Mare | A charming coastal town with sandy beaches and a vibrant promenade. Ideal for families and beach lovers, it offers a relaxed atmosphere with various local restaurants and shops. | San Lorenzo al Mare beach, Bicycle path along the coast, Local seafood restaurants, Annual beach festivals, Port town charm |
| Cipressa | A small, tranquil village perched on a hill with stunning views of the Ligurian coastline. Great for tourists looking for outdoor activities and hikes, as well as relaxation. | Views of the coastline, Hiking trails, Olive groves, Local vineyards, Traditional Ligurian architecture |
| Riva Ligure | A delightful seaside village with a lovely beach and a picturesque promenade. Popular with families and those seeking a laid-back beach vacation atmosphere. | Riva Ligure beach, Walking paths by the sea, Local gelaterias, Charming harbor area, Cafés and restaurants |
| Montalto di Castro | A historic town in the hills providing a mix of cultural experiences and local cuisine. Appeals to travelers interested in history, nature, and Italian gastronomy. | Historical town center, Local markets, Scenic views, Surrounding countryside, Medieval architecture |
| Diano Marina | A popular beach resort town famed for its sandy beaches and lively summer atmosphere. Excellent choice for tourists looking for sun, beach, and vibrant local life. | Diano Marina beach, Variety of restaurants and bars, Summer festivals, Water sports activities, Shopping streets |
| Villa Faraldi | A hidden gem in the Italian Riviera, offering stunning views and a peaceful atmosphere. Perfect for those seeking a rural escape with a touch of luxury. | Breathtaking coastal views, Local vineyards, Peaceful countryside, Tranquil ambiance, Traditional farmhouses |
| Cervo | A beautifully preserved medieval village known for its artistic heritage and stunning sea views. Attracts tourists interested in art, history, and beautiful coastal scenery. | Borgo di Cervo, Church of San Giovanni Battista, Art exhibitions, Historical architecture, Scenic beaches |
Understanding Airbnb License Requirements & STR Laws in Castellaro (2025)
Yes, Castellaro, Liguria, Italy enforces high STR regulations. Obtaining a license and ensuring compliance is almost certainly required according to current 2025 STR laws. Always verify the latest short term rental regulations and Airbnb license requirements directly with local government authorities for Castellaro to ensure full compliance before hosting.
(Source: AirROI data, 2025, based on 61% licensed listings)
Top Performing Airbnb Properties in Castellaro (2025)
Benchmark your potential! Explore examples of top-performing Airbnb properties in Castellarobased on Trailing Twelve Month (TTM) revenue. Analyze their characteristics, revenue, occupancy rate, and ADR to understand what drives success in this market.
![𝐇𝟏𝟏 [Villa Conchiglia] Piscina - Garage](https://a0.muscache.com/im/pictures/miso/Hosting-1102701223491312942/original/ec20ab76-750e-4d1c-9ea2-c13b36947697.jpeg?im_w=480&im_format=avif)
𝐇𝟏𝟏 [Villa Conchiglia] Piscina - Garage
Entire Place • 4 bedrooms

Small slice of paradise surrounded by greenery
Entire Place • 2 bedrooms

The view of the Poggio B&B with Jacuzzi
Private Room • 1 bedroom
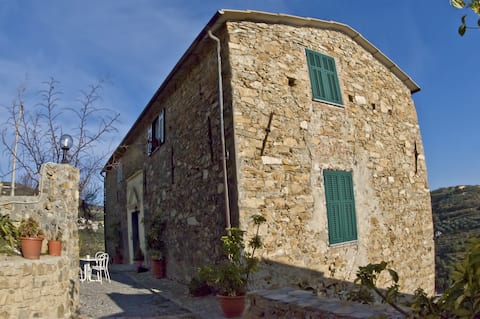
Country house in Riviera Ligure
Entire Place • 3 bedrooms
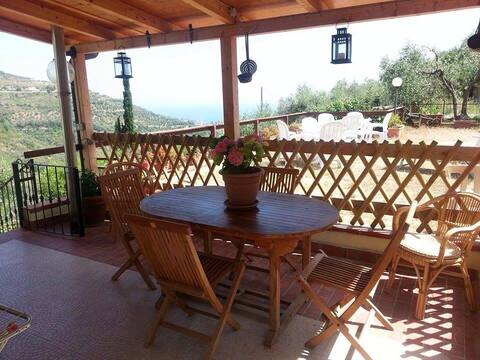
Sun, sea, quiet and so much green!
Entire Place • 1 bedroom
Appartamento Girasole
Entire Place • 1 bedroom
Note: Performance varies based on location, size, amenities, seasonality, and management quality. Data reflects the past 12 months.
Top Performing Airbnb Hosts in Castellaro (2025)
Learn from the best! This table showcases top-performing Airbnb hosts in Castellaro based on the number of properties managed and estimated total revenue over the past year. Analyze their scale and performance metrics.
| Host Name | Properties | Grossing Revenue | Stay Reviews | Avg Rating |
|---|---|---|---|---|
| Host #116396424 | 1 | $43,166 | 0 | 0.00/5.0 |
| Roberta | 3 | $29,832 | 120 | 4.77/5.0 |
| Maurizio | 3 | $20,501 | 106 | 4.76/5.0 |
| Marco | 1 | $19,339 | 90 | 4.94/5.0 |
| Laila Isabella | 2 | $19,324 | 35 | 5.00/5.0 |
| Rosangela | 2 | $17,417 | 103 | 4.79/5.0 |
| Sonia | 1 | $10,396 | 45 | 4.89/5.0 |
| Host #131061622 | 1 | $6,999 | 0 | 0.00/5.0 |
| Camilla | 1 | $6,224 | 7 | 4.71/5.0 |
| Host #404953457 | 1 | $4,673 | 0 | 0.00/5.0 |
Analyzing the strategies of top hosts, such as their property selection, pricing, and guest communication, can offer valuable lessons for optimizing your own Airbnb operations in Castellaro.
Dive Deeper: Advanced Castellaro STR Market Data (2025)
Ready to unlock more insights? AirROI provides access to advanced metrics and comprehensive Airbnb data for Castellaro. Explore detailed analytics beyond this report to refine your investment strategy, optimize pricing, and maximize your vacation rental profits.
Explore Advanced MetricsCastellaro Short-Term Rental Market Composition (2025): Property & Room Types
Room Type Distribution
Property Type Distribution
Market Composition Insights for Castellaro
- The Castellaro Airbnb market composition is heavily skewed towards Entire Home/Apt listings, which make up 83.3% of the 18 active rentals. This indicates strong guest preference for privacy and space.
- Looking at the property type distribution in Castellaro, Apartment/Condo properties are the most common (55.6%), reflecting the local real estate landscape.
- Houses represent a significant 33.3% portion, catering likely to families or larger groups.
- The presence of 11.1% Hotel/Boutique listings indicates integration with traditional hospitality.
Castellaro Airbnb Room Capacity Analysis (2025): Bedroom Distribution
Distribution of Listings by Number of Bedrooms
Room Capacity Insights for Castellaro
- The dominant room capacity in Castellaro is 1 bedroom listings, making up 50% of the market. This suggests a strong demand for properties suitable for couples or solo travelers.
- Together, 1 bedroom and 2 bedrooms properties represent 72.2% of the active Airbnb listings in Castellaro, indicating a high concentration in these sizes.
- A significant 22.3% of listings offer 3+ bedrooms, catering to larger groups and families seeking more space in Castellaro.
Castellaro Vacation Rental Guest Capacity Trends (2025)
Distribution of Listings by Guest Capacity
Guest Capacity Insights for Castellaro
- The most common guest capacity trend in Castellaro vacation rentals is listings accommodating 4 guests (33.3%). This suggests the primary traveler segment is likely small families or groups.
- Properties designed for 4 guests and 5 guests dominate the Castellaro STR market, accounting for 50.0% of listings.
- 27.8% of properties accommodate 6+ guests, serving the market segment for larger families or group travel in Castellaro.
- On average, properties in Castellaro are equipped to host 4.4 guests.
Castellaro Airbnb Booking Patterns (2025): Available vs. Booked Days
Available Days Distribution
Booked Days Distribution
Booking Pattern Insights for Castellaro
- The most common availability pattern in Castellaro falls within the 271-366 days range, representing 66.7% of listings. This suggests many properties have significant open periods on their calendars.
- Approximately 100.0% of listings show high availability (181+ days open annually), indicating potential for increased bookings or specific owner usage patterns.
- For booked days, the 31-90 days range is most frequent in Castellaro (44.4%), reflecting common guest stay durations or potential owner blocking patterns.
- A notable 5.6% of properties secure long booking periods (181+ days booked per year), highlighting successful long-term rental strategies or significant owner usage.
Castellaro Airbnb Minimum Stay Requirements Analysis
Distribution of Listings by Minimum Night Requirement
1 Night
4 listings
22.2% of total
2 Nights
4 listings
22.2% of total
3 Nights
5 listings
27.8% of total
4-6 Nights
1 listings
5.6% of total
7-29 Nights
3 listings
16.7% of total
30+ Nights
1 listings
5.6% of total
Key Insights
- The most prevalent minimum stay requirement in Castellaro is 3 Nights, adopted by 27.8% of listings. This highlights the market's preference for longer commitments.
Recommendations
- Align with the market by considering a 3 Nights minimum stay, as 27.8% of Castellaro hosts use this setting.
- If feasible, allowing 1-night stays, especially midweek or during low season, could capture last-minute bookings, as only 22.2% currently do.
- Explore offering discounts for stays of 30+ nights to attract the 5.6% of the market seeking extended stays.
- Adjust minimum nights based on seasonality – potentially shorter during low season and longer during peak demand periods in Castellaro.
Castellaro Airbnb Cancellation Policy Trends Analysis (2025)
Flexible
1 listings
7.1% of total
Moderate
10 listings
71.4% of total
Strict
3 listings
21.4% of total
Cancellation Policy Insights for Castellaro
- The prevailing Airbnb cancellation policy trend in Castellaro is Moderate, used by 71.4% of listings.
- The market strongly favors guest-friendly terms, with 78.5% of listings offering Flexible or Moderate policies. This suggests guests in Castellaro may expect booking flexibility.
Recommendations for Hosts
- Consider adopting a Moderate policy to align with the 71.4% market standard in Castellaro.
- Regularly review your cancellation policy against competitors and market demand shifts in Castellaro.
Castellaro STR Booking Lead Time Analysis (2025)
Average Booking Lead Time by Month
Booking Lead Time Insights for Castellaro
- The overall average booking lead time for vacation rentals in Castellaro is 68 days.
- Guests book furthest in advance for stays during July (average 115 days), likely coinciding with peak travel demand or local events.
- The shortest booking windows occur for stays in March (average 16 days), indicating more last-minute travel plans during this time.
- Seasonally, Summer (97 days avg.) sees the longest lead times, while Spring (31 days avg.) has the shortest, reflecting typical travel planning cycles.
Recommendations for Hosts
- Use the overall average lead time (68 days) as a baseline for your pricing and availability strategy in Castellaro.
- For July stays, consider implementing length-of-stay discounts or slightly higher rates for bookings made less than 115 days out to capitalize on advance planning.
- Target marketing efforts for the Summer season well in advance (at least 97 days) to capture early planners.
- Monitor your own booking lead times against these Castellaro averages to identify opportunities for dynamic pricing adjustments.
Popular & Essential Airbnb Amenities in Castellaro (2025)
Amenity Prevalence
Amenity Insights for Castellaro
- Popular amenities like Essentials, Dishes and silverware, Hot water are common but not universal. Offering these can provide a competitive edge.
Recommendations for Hosts
- Consider adding popular differentiators like Essentials or Dishes and silverware to increase appeal.
- Highlight unique or less common amenities you offer (e.g., hot tub, dedicated workspace, EV charger) in your listing description and photos.
- Regularly check competitor amenities in Castellaro to stay competitive.
Castellaro Airbnb Guest Demographics & Profile Analysis (2025)
Guest Profile Summary for Castellaro
- The typical guest profile for Airbnb in Castellaro consists of predominantly international visitors (79%), with top international origins including Italy, typically belonging to the Post-2000s (Gen Z/Alpha) group (50%), primarily speaking English or French.
- Domestic travelers account for 20.8% of guests.
- Key international markets include France (45.5%) and Italy (20.8%).
- Top languages spoken are English (33.3%) followed by French (28%).
- A significant demographic segment is the Post-2000s (Gen Z/Alpha) group, representing 50% of guests.
Recommendations for Hosts
- Focus marketing internationally, particularly towards travelers from Italy.
- Tailor amenities and listing descriptions to appeal to the dominant Post-2000s (Gen Z/Alpha) demographic (e.g., highlight fast WiFi, smart home features, local guides).
- Highlight unique local experiences or amenities relevant to the primary guest profile.
- Consider seasonal promotions aligned with peak travel times for key origin markets.
Nearby Short-Term Rental Market Comparison
How does the Castellaro Airbnb market stack up against its neighbors? Compare key performance metrics like average monthly revenue, ADR, and occupancy rates in surrounding areas to understand the broader regional STR landscape.
| Market | Active Properties | Monthly Revenue | Daily Rate | Avg. Occupancy |
|---|---|---|---|---|
| Monteu Roero | 16 | $4,432 | $540.14 | 36% |
| Ramatuelle | 213 | $3,891 | $670.10 | 41% |
| Saint-Jean-Cap-Ferrat | 107 | $3,844 | $424.21 | 46% |
| Cossano Belbo | 13 | $3,632 | $284.21 | 42% |
| Saint-Tropez | 742 | $3,498 | $506.57 | 41% |
| Cassinasco | 18 | $3,219 | $545.40 | 41% |
| Èze | 153 | $3,168 | $345.84 | 47% |
| Opio | 40 | $3,057 | $540.62 | 37% |
| Villefranche-sur-Mer | 501 | $2,977 | $268.57 | 52% |
| Gassin | 384 | $2,939 | $434.44 | 40% |