Casanova Lerrone Airbnb Market Analysis 2025: Short Term Rental Data & Vacation Rental Statistics in Liguria, Italy
Is Airbnb profitable in Casanova Lerrone in 2025? Explore comprehensive Airbnb analytics for Casanova Lerrone, Liguria, Italy to uncover income potential. This 2025 STR market report for Casanova Lerrone, based on AirROI data from April 2024 to March 2025, reveals key trends in the niche market of 22 active listings.
Whether you're considering an Airbnb investment in Casanova Lerrone, optimizing your existing vacation rental, or exploring rental arbitrage opportunities, understanding the Casanova Lerrone Airbnb data is crucial. Navigating the high regulation landscape is key to maximizing your short term rental income potential. Let's dive into the specifics.
Key Casanova Lerrone Airbnb Performance Metrics Overview
Monthly Airbnb Revenue Variations & Income Potential in Casanova Lerrone (2025)
Understanding the monthly revenue variations for Airbnb listings in Casanova Lerrone is key to maximizing your short term rental income potential. Seasonality significantly impacts earnings. Our analysis, based on data from the past 12 months, shows that the peak revenue month for STRs in Casanova Lerrone is typically August, while March often presents the lowest earnings, highlighting opportunities for strategic pricing adjustments during shoulder and low seasons. Explore the typical Airbnb income in Casanova Lerrone across different performance tiers:
- Best-in-class properties (Top 10%) achieve $3,061+ monthly, often utilizing dynamic pricing and superior guest experiences.
- Strong performing properties (Top 25%) earn $1,094 or more, indicating effective management and desirable locations/amenities.
- Typical properties (Median) generate around $485 per month, representing the average market performance.
- Entry-level properties (Bottom 25%) see earnings around $294, often with potential for optimization.
Average Monthly Airbnb Earnings Trend in Casanova Lerrone
Casanova Lerrone Airbnb Occupancy Rate Trends (2025)
Maximize your bookings by understanding the Casanova Lerrone STR occupancy trends. Seasonal demand shifts significantly influence how often properties are booked. Typically, Augustsees the highest demand (peak season occupancy), while January experiences the lowest (low season). Effective strategies, like adjusting minimum stays or offering promotions, can boost occupancy during slower periods. Here's how different property tiers perform in Casanova Lerrone:
- Best-in-class properties (Top 10%) achieve 60%+ occupancy, indicating high desirability and potentially optimized availability.
- Strong performing properties (Top 25%) maintain 35% or higher occupancy, suggesting good market fit and guest satisfaction.
- Typical properties (Median) have an occupancy rate around 21%.
- Entry-level properties (Bottom 25%) average 13% occupancy, potentially facing higher vacancy.
Average Monthly Occupancy Rate Trend in Casanova Lerrone
Average Daily Rate (ADR) Airbnb Trends in Casanova Lerrone (2025)
Effective short term rental pricing strategy in Casanova Lerrone involves understanding monthly ADR fluctuations. The Average Daily Rate (ADR) for Airbnb in Casanova Lerrone typically peaks in August and dips lowest during December. Leveraging Airbnb dynamic pricing tools or strategies based on this seasonality can significantly boost revenue. Here's a look at the typical nightly rates achieved:
- Best-in-class properties (Top 10%) command rates of $252+ per night, often due to premium features or locations.
- Strong performing properties (Top 25%) achieve nightly rates of $119 or more.
- Typical properties (Median) charge around $90 per night.
- Entry-level properties (Bottom 25%) earn around $54 per night.
Average Daily Rate (ADR) Trend by Month in Casanova Lerrone
Get Live Casanova Lerrone Market Intelligence 👇

Explore Real-time Analytics
Airbnb Seasonality Analysis & Trends in Casanova Lerrone (2025)
Peak Season (August, July, May)
- Revenue averages $1,883 per month
- Occupancy rates average 47.7%
- Daily rates average $123
Shoulder Season
- Revenue averages $1,022 per month
- Occupancy maintains around 23.0%
- Daily rates hold near $115
Low Season (February, March, November)
- Revenue drops to average $425 per month
- Occupancy decreases to average 14.8%
- Daily rates adjust to average $110
Seasonality Insights for Casanova Lerrone
- The Airbnb seasonality in Casanova Lerrone shows highly seasonal trends requiring careful strategy. While the sections above show seasonal averages, it's also insightful to look at the extremes:
- During the high season, the absolute peak month showcases Casanova Lerrone's highest earning potential, with monthly revenues capable of climbing to $1,964, occupancy reaching a high of 56.0%, and ADRs peaking at $125.
- Conversely, the slowest single month of the year, typically falling within the low season, marks the market's lowest point. In this month, revenue might dip to $414, occupancy could drop to 9.7%, and ADRs may adjust down to $109.
- Understanding both the seasonal averages and these monthly peaks and troughs in revenue, occupancy, and ADR is crucial for maximizing your Airbnb profit potential in Casanova Lerrone.
Seasonal Strategies for Maximizing Profit
- Peak Season: Maximize revenue through premium pricing and potentially longer minimum stays. Ensure high availability.
- Low Season: Offer competitive pricing, special promotions (e.g., extended stay discounts), and flexible cancellation policies. Target off-season travelers like remote workers or budget-conscious guests.
- Shoulder Seasons: Implement dynamic pricing that balances peak and low rates. Target weekend travelers or specific events. Offer slightly more flexible terms than peak season.
- Regularly analyze your own performance against these Casanova Lerrone seasonality benchmarks and adjust your pricing and availability strategy accordingly.
Best Areas for Airbnb Investment in Casanova Lerrone (2025)
Exploring the top neighborhoods for short-term rentals in Casanova Lerrone? This section highlights key areas, outlining why they are attractive for hosts and guests, along with notable local attractions. Consider these locations based on your target guest profile and investment strategy.
| Neighborhood / Area | Why Host Here? (Target Guests & Appeal) | Key Attractions & Landmarks |
|---|---|---|
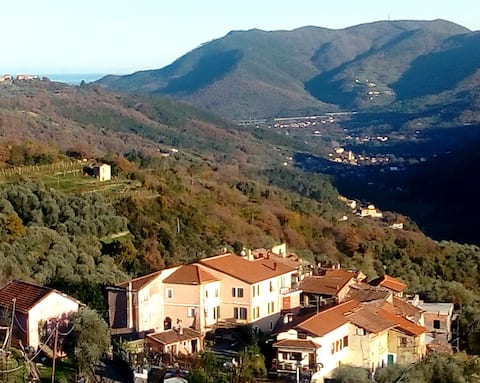
| Casanova Lerrone Historic Center | Charming village center with traditional Italian architecture and a peaceful atmosphere. Attractive for tourists looking for an authentic Ligurian experience. | San Giovanni Battista Church, local trattorias, scenic views of the countryside, nature trails, historical buildings |
| Alassio Beach | Famous beach destination on the Ligurian coast known for its sandy beaches and vibrant promenade. Ideal for tourists seeking sun, sea, and relaxation. | Alassio Beach, Muretto di Alassio, Shopping on Via Dante, Water sports, Restaurants and cafes along the beach |
| Finalborgo | Medieval village with stunning architecture and a rich history. Great for travelers interested in culture and history, as well as outdoor activities in the surrounding hills. | Castello di Finalborgo, historic streets, Biking and hiking trails, local artisan shops, Finale Ligure cliffs for climbing |
| Toirano | Famous for its caves and beautiful natural surroundings. A unique destination for families and adventure seekers wanting to explore the outdoors. | Toirano Caves, nature trails, hiking, local gastronomy, historical landmarks |
| Albenga | Known for its historic center and beautiful beaches. An ideal mix of culture and seaside leisure, attracting both history buffs and beachgoers. | Albenga Cathedral, Roman ruins, local markets, beaches, botanical garden |
| Laigueglia | Picturesque seaside village with a stunning beach and colorful homes. A perfect spot for visitors looking for a quieter beach experience. | Laigueglia Beach, Charming old town, Seafront promenade, Local fish restaurants, Water sports |
| Borgio Verezzi | A lovely village known for its scenic views and nearby sandy beaches. Attracts tourists interested in both relaxation and activities. | Borgio Verezzi Beaches, Cultural festivals, Nature walks, local cuisine, historic theater |
| Celle Ligure | Beautiful coastal town known for its beaches and artistic heritage. Good for families and tourists interested in art and outdoor activities. | Celle Ligure Beach, Artistic murals, Local cafes, Cycling paths, Nature escapes |
Understanding Airbnb License Requirements & STR Laws in Casanova Lerrone (2025)
Yes, Casanova Lerrone, Liguria, Italy enforces high STR regulations. Obtaining a license and ensuring compliance is almost certainly required according to current 2025 STR laws. Always verify the latest short term rental regulations and Airbnb license requirements directly with local government authorities for Casanova Lerrone to ensure full compliance before hosting.
(Source: AirROI data, 2025, based on 77% licensed listings)
Top Performing Airbnb Properties in Casanova Lerrone (2025)
Benchmark your potential! Explore examples of top-performing Airbnb properties in Casanova Lerronebased on Trailing Twelve Month (TTM) revenue. Analyze their characteristics, revenue, occupancy rate, and ADR to understand what drives success in this market.
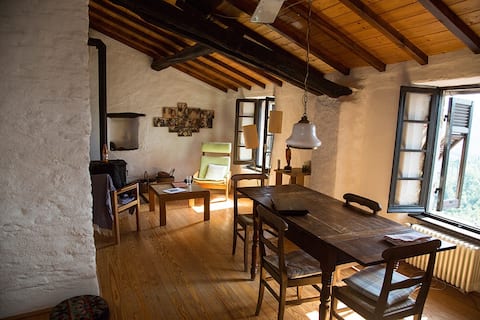
Apartment in Old Farmhouse
Entire Place • 5 bedrooms
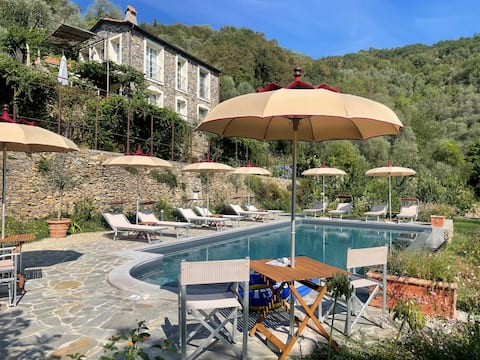
Villa Barca "La Foresteria" vacation rental
Entire Place • 1 bedroom
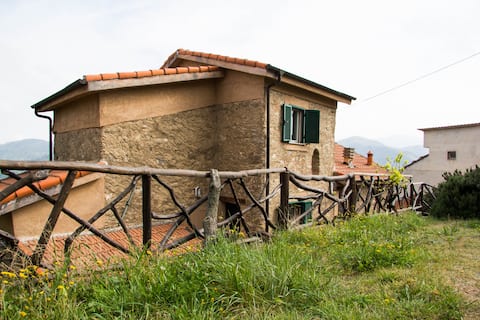
Casa Marie. Behagliches casa rustica, 2 Terrassen
Entire Place • 3 bedrooms

Casa dei Fiori
Entire Place • 3 bedrooms
![[AC & Garden] Olive Grove Oasis](https://a0.muscache.com/im/pictures/hosting/Hosting-U3RheVN1cHBseUxpc3Rpbmc6MTEzMDIxNTg5ODgyMjk2MjQ5NQ%3D%3D/original/faea3ec5-606c-4400-bdd8-3f3183f2ef9b.jpeg?im_w=480&im_format=avif)
[AC & Garden] Olive Grove Oasis
Entire Place • 3 bedrooms
Antica casa ligure (20' da Alassio)
Entire Place • 3 bedrooms
Note: Performance varies based on location, size, amenities, seasonality, and management quality. Data reflects the past 12 months.
Top Performing Airbnb Hosts in Casanova Lerrone (2025)
Learn from the best! This table showcases top-performing Airbnb hosts in Casanova Lerrone based on the number of properties managed and estimated total revenue over the past year. Analyze their scale and performance metrics.
| Host Name | Properties | Grossing Revenue | Stay Reviews | Avg Rating |
|---|---|---|---|---|
| Enrica | 7 | $68,167 | 264 | 4.70/5.0 |
| La Villa Barca Di Herzog Juerg | 1 | $34,264 | 27 | 5.00/5.0 |
| Albrecht | 1 | $15,940 | 15 | 5.00/5.0 |
| Marcus | 3 | $13,681 | 14 | 3.33/5.0 |
| Giovanni | 2 | $10,495 | 27 | 4.82/5.0 |
| Holidu | 1 | $10,179 | 9 | 4.78/5.0 |
| Host #9003863 | 1 | $8,743 | 1 | 0.00/5.0 |
| Holidu | 1 | $4,271 | 3 | 5.00/5.0 |
| Donatella | 1 | $3,440 | 15 | 4.93/5.0 |
| Host #61244502 | 1 | $3,331 | 44 | 4.80/5.0 |
Analyzing the strategies of top hosts, such as their property selection, pricing, and guest communication, can offer valuable lessons for optimizing your own Airbnb operations in Casanova Lerrone.
Dive Deeper: Advanced Casanova Lerrone STR Market Data (2025)
Ready to unlock more insights? AirROI provides access to advanced metrics and comprehensive Airbnb data for Casanova Lerrone. Explore detailed analytics beyond this report to refine your investment strategy, optimize pricing, and maximize your vacation rental profits.
Explore Advanced MetricsCasanova Lerrone Short-Term Rental Market Composition (2025): Property & Room Types
Room Type Distribution
Property Type Distribution
Market Composition Insights for Casanova Lerrone
- The Casanova Lerrone Airbnb market composition is heavily skewed towards Entire Home/Apt listings, which make up 68.2% of the 22 active rentals. This indicates strong guest preference for privacy and space.
- However, a notable 31.8% share for Private Rooms suggests opportunities for budget-conscious travelers or hosts renting out spare rooms.
- Looking at the property type distribution in Casanova Lerrone, House properties are the most common (54.5%), reflecting the local real estate landscape.
- Houses represent a significant 54.5% portion, catering likely to families or larger groups.
Casanova Lerrone Airbnb Room Capacity Analysis (2025): Bedroom Distribution
Distribution of Listings by Number of Bedrooms
Room Capacity Insights for Casanova Lerrone
- The dominant room capacity in Casanova Lerrone is 1 bedroom listings, making up 27.3% of the market. This suggests a strong demand for properties suitable for couples or solo travelers.
- Together, 1 bedroom and 3 bedrooms properties represent 50.0% of the active Airbnb listings in Casanova Lerrone, indicating a high concentration in these sizes.
- A significant 45.4% of listings offer 3+ bedrooms, catering to larger groups and families seeking more space in Casanova Lerrone.
Casanova Lerrone Vacation Rental Guest Capacity Trends (2025)
Distribution of Listings by Guest Capacity
Guest Capacity Insights for Casanova Lerrone
- The most common guest capacity trend in Casanova Lerrone vacation rentals is listings accommodating 2 guests (22.7%). This suggests the primary traveler segment is likely couples or solo travelers.
- Properties designed for 2 guests and 8+ guests dominate the Casanova Lerrone STR market, accounting for 40.9% of listings.
- 22.7% of properties accommodate 6+ guests, serving the market segment for larger families or group travel in Casanova Lerrone.
- On average, properties in Casanova Lerrone are equipped to host 3.2 guests.
Casanova Lerrone Airbnb Booking Patterns (2025): Available vs. Booked Days
Available Days Distribution
Booked Days Distribution
Booking Pattern Insights for Casanova Lerrone
- The most common availability pattern in Casanova Lerrone falls within the 271-366 days range, representing 77.3% of listings. This suggests many properties have significant open periods on their calendars.
- Approximately 95.5% of listings show high availability (181+ days open annually), indicating potential for increased bookings or specific owner usage patterns.
- For booked days, the 31-90 days range is most frequent in Casanova Lerrone (50%), reflecting common guest stay durations or potential owner blocking patterns.
- A notable 4.5% of properties secure long booking periods (181+ days booked per year), highlighting successful long-term rental strategies or significant owner usage.
Casanova Lerrone Airbnb Minimum Stay Requirements Analysis
Distribution of Listings by Minimum Night Requirement
1 Night
9 listings
40.9% of total
2 Nights
1 listings
4.5% of total
3 Nights
1 listings
4.5% of total
4-6 Nights
8 listings
36.4% of total
7-29 Nights
1 listings
4.5% of total
30+ Nights
2 listings
9.1% of total
Key Insights
- The most prevalent minimum stay requirement in Casanova Lerrone is 1 Night, adopted by 40.9% of listings. This highlights the market's preference for shorter, flexible bookings.
Recommendations
- Align with the market by considering a 1 Night minimum stay, as 40.9% of Casanova Lerrone hosts use this setting.
- Explore offering discounts for stays of 30+ nights to attract the 9.1% of the market seeking extended stays.
- Adjust minimum nights based on seasonality – potentially shorter during low season and longer during peak demand periods in Casanova Lerrone.
Casanova Lerrone Airbnb Cancellation Policy Trends Analysis (2025)
Flexible
5 listings
27.8% of total
Moderate
9 listings
50% of total
Strict
4 listings
22.2% of total
Cancellation Policy Insights for Casanova Lerrone
- The prevailing Airbnb cancellation policy trend in Casanova Lerrone is Moderate, used by 50% of listings.
- The market strongly favors guest-friendly terms, with 77.8% of listings offering Flexible or Moderate policies. This suggests guests in Casanova Lerrone may expect booking flexibility.
Recommendations for Hosts
- Consider adopting a Moderate policy to align with the 50% market standard in Casanova Lerrone.
- Regularly review your cancellation policy against competitors and market demand shifts in Casanova Lerrone.
Casanova Lerrone STR Booking Lead Time Analysis (2025)
Average Booking Lead Time by Month
Booking Lead Time Insights for Casanova Lerrone
- The overall average booking lead time for vacation rentals in Casanova Lerrone is 57 days.
- Guests book furthest in advance for stays during August (average 121 days), likely coinciding with peak travel demand or local events.
- The shortest booking windows occur for stays in December (average 18 days), indicating more last-minute travel plans during this time.
- Seasonally, Summer (87 days avg.) sees the longest lead times, while Winter (26 days avg.) has the shortest, reflecting typical travel planning cycles.
Recommendations for Hosts
- Use the overall average lead time (57 days) as a baseline for your pricing and availability strategy in Casanova Lerrone.
- For August stays, consider implementing length-of-stay discounts or slightly higher rates for bookings made less than 121 days out to capitalize on advance planning.
- Target marketing efforts for the Summer season well in advance (at least 87 days) to capture early planners.
- Monitor your own booking lead times against these Casanova Lerrone averages to identify opportunities for dynamic pricing adjustments.
Popular & Essential Airbnb Amenities in Casanova Lerrone (2025)
Amenity Prevalence
Amenity Insights for Casanova Lerrone
- Essential amenities in Casanova Lerrone that guests expect include: Essentials, Kitchen. Lacking these (any) could significantly impact bookings.
- Popular amenities like Hot water, Wifi, TV are common but not universal. Offering these can provide a competitive edge.
- Warning: Wifi is not universally provided but is considered essential globally. Ensure reliable Wifi is offered.
Recommendations for Hosts
- Ensure your listing includes all essential amenities for Casanova Lerrone: Essentials, Kitchen.
- Prioritize adding missing essentials: Kitchen.
- Consider adding popular differentiators like Hot water or Wifi to increase appeal.
- Highlight unique or less common amenities you offer (e.g., hot tub, dedicated workspace, EV charger) in your listing description and photos.
- Regularly check competitor amenities in Casanova Lerrone to stay competitive.
Casanova Lerrone Airbnb Guest Demographics & Profile Analysis (2025)
Guest Profile Summary for Casanova Lerrone
- The typical guest profile for Airbnb in Casanova Lerrone consists of predominantly international visitors (69%), with top international origins including Germany, typically belonging to the Post-2000s (Gen Z/Alpha) group (50%), primarily speaking English or French.
- Domestic travelers account for 31.3% of guests.
- Key international markets include Italy (31.3%) and Germany (29.7%).
- Top languages spoken are English (32.9%) followed by French (22.4%).
- A significant demographic segment is the Post-2000s (Gen Z/Alpha) group, representing 50% of guests.
Recommendations for Hosts
- Focus marketing internationally, particularly towards travelers from Germany.
- Tailor amenities and listing descriptions to appeal to the dominant Post-2000s (Gen Z/Alpha) demographic (e.g., highlight fast WiFi, smart home features, local guides).
- Highlight unique local experiences or amenities relevant to the primary guest profile.
- Consider seasonal promotions aligned with peak travel times for key origin markets.
Nearby Short-Term Rental Market Comparison
How does the Casanova Lerrone Airbnb market stack up against its neighbors? Compare key performance metrics like average monthly revenue, ADR, and occupancy rates in surrounding areas to understand the broader regional STR landscape.
| Market | Active Properties | Monthly Revenue | Daily Rate | Avg. Occupancy |
|---|---|---|---|---|
| Laglio | 64 | $4,873 | $463.61 | 47% |
| Monteu Roero | 16 | $4,432 | $540.14 | 36% |
| Portofino | 68 | $4,086 | $454.35 | 44% |
| Saint-Jean-Cap-Ferrat | 107 | $3,844 | $424.21 | 46% |
| Sala Comacina | 64 | $3,794 | $400.27 | 50% |
| Cossano Belbo | 13 | $3,632 | $284.21 | 42% |
| Bellagio | 373 | $3,630 | $328.26 | 55% |
| Oliveto Lario | 99 | $3,509 | $327.42 | 55% |
| Carate Urio | 71 | $3,379 | $331.90 | 44% |
| Brienno | 39 | $3,327 | $337.92 | 45% |