Borzonasca Airbnb Market Analysis 2025: Short Term Rental Data & Vacation Rental Statistics in Liguria, Italy
Is Airbnb profitable in Borzonasca in 2025? Explore comprehensive Airbnb analytics for Borzonasca, Liguria, Italy to uncover income potential. This 2025 STR market report for Borzonasca, based on AirROI data from April 2024 to March 2025, reveals key trends in the niche market of 41 active listings.
Whether you're considering an Airbnb investment in Borzonasca, optimizing your existing vacation rental, or exploring rental arbitrage opportunities, understanding the Borzonasca Airbnb data is crucial. Navigating the high regulation landscape is key to maximizing your short term rental income potential. Let's dive into the specifics.
Key Borzonasca Airbnb Performance Metrics Overview
Monthly Airbnb Revenue Variations & Income Potential in Borzonasca (2025)
Understanding the monthly revenue variations for Airbnb listings in Borzonasca is key to maximizing your short term rental income potential. Seasonality significantly impacts earnings. Our analysis, based on data from the past 12 months, shows that the peak revenue month for STRs in Borzonasca is typically April, while January often presents the lowest earnings, highlighting opportunities for strategic pricing adjustments during shoulder and low seasons. Explore the typical Airbnb income in Borzonasca across different performance tiers:
- Best-in-class properties (Top 10%) achieve $2,153+ monthly, often utilizing dynamic pricing and superior guest experiences.
- Strong performing properties (Top 25%) earn $1,359 or more, indicating effective management and desirable locations/amenities.
- Typical properties (Median) generate around $676 per month, representing the average market performance.
- Entry-level properties (Bottom 25%) see earnings around $256, often with potential for optimization.
Average Monthly Airbnb Earnings Trend in Borzonasca
Borzonasca Airbnb Occupancy Rate Trends (2025)
Maximize your bookings by understanding the Borzonasca STR occupancy trends. Seasonal demand shifts significantly influence how often properties are booked. Typically, Augustsees the highest demand (peak season occupancy), while January experiences the lowest (low season). Effective strategies, like adjusting minimum stays or offering promotions, can boost occupancy during slower periods. Here's how different property tiers perform in Borzonasca:
- Best-in-class properties (Top 10%) achieve 64%+ occupancy, indicating high desirability and potentially optimized availability.
- Strong performing properties (Top 25%) maintain 39% or higher occupancy, suggesting good market fit and guest satisfaction.
- Typical properties (Median) have an occupancy rate around 21%.
- Entry-level properties (Bottom 25%) average 8% occupancy, potentially facing higher vacancy.
Average Monthly Occupancy Rate Trend in Borzonasca
Average Daily Rate (ADR) Airbnb Trends in Borzonasca (2025)
Effective short term rental pricing strategy in Borzonasca involves understanding monthly ADR fluctuations. The Average Daily Rate (ADR) for Airbnb in Borzonasca typically peaks in June and dips lowest during December. Leveraging Airbnb dynamic pricing tools or strategies based on this seasonality can significantly boost revenue. Here's a look at the typical nightly rates achieved:
- Best-in-class properties (Top 10%) command rates of $191+ per night, often due to premium features or locations.
- Strong performing properties (Top 25%) achieve nightly rates of $143 or more.
- Typical properties (Median) charge around $82 per night.
- Entry-level properties (Bottom 25%) earn around $53 per night.
Average Daily Rate (ADR) Trend by Month in Borzonasca
Get Live Borzonasca Market Intelligence 👇

Explore Real-time Analytics
Airbnb Seasonality Analysis & Trends in Borzonasca (2025)
Peak Season (April, August, May)
- Revenue averages $1,356 per month
- Occupancy rates average 38.3%
- Daily rates average $112
Shoulder Season
- Revenue averages $896 per month
- Occupancy maintains around 28.5%
- Daily rates hold near $107
Low Season (January, February, November)
- Revenue drops to average $507 per month
- Occupancy decreases to average 15.8%
- Daily rates adjust to average $102
Seasonality Insights for Borzonasca
- The Airbnb seasonality in Borzonasca shows highly seasonal trends requiring careful strategy. While the sections above show seasonal averages, it's also insightful to look at the extremes:
- During the high season, the absolute peak month showcases Borzonasca's highest earning potential, with monthly revenues capable of climbing to $1,386, occupancy reaching a high of 45.5%, and ADRs peaking at $112.
- Conversely, the slowest single month of the year, typically falling within the low season, marks the market's lowest point. In this month, revenue might dip to $441, occupancy could drop to 13.7%, and ADRs may adjust down to $99.
- Understanding both the seasonal averages and these monthly peaks and troughs in revenue, occupancy, and ADR is crucial for maximizing your Airbnb profit potential in Borzonasca.
Seasonal Strategies for Maximizing Profit
- Peak Season: Maximize revenue through premium pricing and potentially longer minimum stays. Ensure high availability.
- Low Season: Offer competitive pricing, special promotions (e.g., extended stay discounts), and flexible cancellation policies. Target off-season travelers like remote workers or budget-conscious guests.
- Shoulder Seasons: Implement dynamic pricing that balances peak and low rates. Target weekend travelers or specific events. Offer slightly more flexible terms than peak season.
- Regularly analyze your own performance against these Borzonasca seasonality benchmarks and adjust your pricing and availability strategy accordingly.
Best Areas for Airbnb Investment in Borzonasca (2025)
Exploring the top neighborhoods for short-term rentals in Borzonasca? This section highlights key areas, outlining why they are attractive for hosts and guests, along with notable local attractions. Consider these locations based on your target guest profile and investment strategy.
| Neighborhood / Area | Why Host Here? (Target Guests & Appeal) | Key Attractions & Landmarks |
|---|---|---|
| San Michele | Charming village atmosphere with beautiful views of the surrounding hills. Popular among tourists seeking a peaceful retreat in nature while still being close to local attractions. | Castello di San Michele, Parco dell'Aveto, Hiking trails, Local restaurants, Cultural festivals |
| Borzonasca | The main town in the area, providing access to local shops and amenities. Ideal for travelers looking to explore the rich history and nature of Liguria. | Historical sites, Local markets, Natural parks, Authentic Italian cuisine, Scenic landscapes |
| Val D'Aveto | A stunning natural valley known for its outdoor activities, including hiking and skiing. Attracts nature lovers and adventure seekers throughout the year. | Adventure parks, Skiing resorts, Hiking opportunities, Wildlife watching, Local flora and fauna |
| Gattorna | A small hamlet with close proximity to nature reserves, ideal for those wanting a quiet getaway and authentic Italian village experience. | Nature trails, Small local shops, Historical architecture, Countryside views, Cultural events |
| Mulino dei Preti | Picturesque location by the river, perfect for relaxation and enjoying the outdoors. Great for families looking for a retreat. | River activities, Fishing spots, Walking paths, Nature observation, Picnic areas |
| Genova | While a bit further, the nearby metropolitan area offers a mix of city life and coastal attractions. Perfect for travelers wanting variety in their stay. | Aquarium of Genoa, Old Town, Porto Antico, Cultural museums, Shopping districts |
| Camogli | Beautiful coastal town nearby known for its colorful houses and stunning views of the Ligurian Sea. Great for beach lovers. | Beaches, Fishing ports, Local seafood restaurants, Scenic walks, Cultural heritage |
| Portofino | A world-famous destination with luxury appeal and stunning coastal views. Very attractive for tourists looking for an upscale experience. | Portofino harbor, Church of St. George, Hiking trails, Luxury shops, Seafood cuisine |
Understanding Airbnb License Requirements & STR Laws in Borzonasca (2025)
Yes, Borzonasca, Liguria, Italy enforces high STR regulations. Obtaining a license and ensuring compliance is almost certainly required according to current 2025 STR laws. Always verify the latest short term rental regulations and Airbnb license requirements directly with local government authorities for Borzonasca to ensure full compliance before hosting.
(Source: AirROI data, 2025, based on 66% licensed listings)
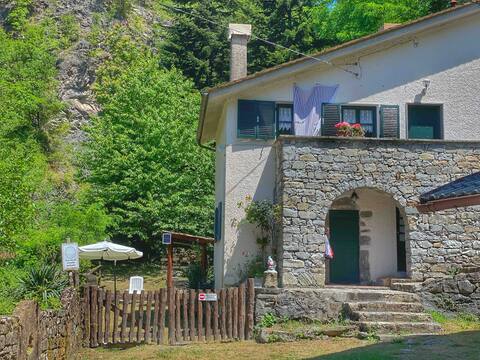
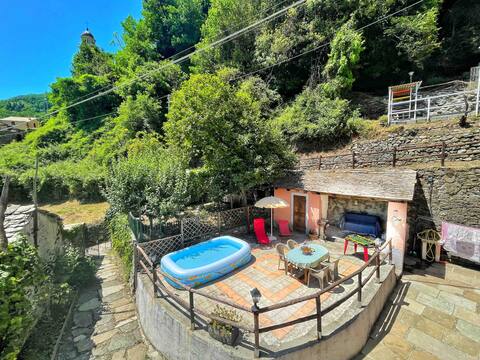
Top Performing Airbnb Properties in Borzonasca (2025)
Benchmark your potential! Explore examples of top-performing Airbnb properties in Borzonascabased on Trailing Twelve Month (TTM) revenue. Analyze their characteristics, revenue, occupancy rate, and ADR to understand what drives success in this market.

Antiche Atmospheres
Entire Place • 2 bedrooms

Natura e Relax a Casa Millin CITRA 010005-LT-0001
Entire Place • 2 bedrooms
Villa with stream, garden forest and fireplace
Entire Place • 1 bedroom

Original Mongolian Yurt
Entire Place • 1 bedroom

NOAH CASABALSAMO
Private Room • 1 bedroom
Queen of Hearts CITRA 010005-LT-0021
Entire Place • 2 bedrooms
Note: Performance varies based on location, size, amenities, seasonality, and management quality. Data reflects the past 12 months.
Top Performing Airbnb Hosts in Borzonasca (2025)
Learn from the best! This table showcases top-performing Airbnb hosts in Borzonasca based on the number of properties managed and estimated total revenue over the past year. Analyze their scale and performance metrics.
| Host Name | Properties | Grossing Revenue | Stay Reviews | Avg Rating |
|---|---|---|---|---|
| Alice | 4 | $36,829 | 96 | 4.95/5.0 |
| Bruno | 3 | $31,570 | 75 | 4.84/5.0 |
| Flavio | 1 | $26,071 | 22 | 5.00/5.0 |
| Michela | 7 | $26,038 | 198 | 4.10/5.0 |
| Teresa | 6 | $24,839 | 85 | 1.63/5.0 |
| Marino | 1 | $19,970 | 80 | 4.98/5.0 |
| Nicola | 2 | $16,778 | 17 | 5.00/5.0 |
| Danilo | 2 | $13,595 | 3 | 2.33/5.0 |
| Linda | 1 | $10,127 | 56 | 4.73/5.0 |
| Maria Grazia | 3 | $9,355 | 69 | 4.83/5.0 |
Analyzing the strategies of top hosts, such as their property selection, pricing, and guest communication, can offer valuable lessons for optimizing your own Airbnb operations in Borzonasca.
Dive Deeper: Advanced Borzonasca STR Market Data (2025)
Ready to unlock more insights? AirROI provides access to advanced metrics and comprehensive Airbnb data for Borzonasca. Explore detailed analytics beyond this report to refine your investment strategy, optimize pricing, and maximize your vacation rental profits.
Explore Advanced MetricsBorzonasca Short-Term Rental Market Composition (2025): Property & Room Types
Room Type Distribution
Property Type Distribution
Market Composition Insights for Borzonasca
- The Borzonasca Airbnb market composition is heavily skewed towards Entire Home/Apt listings, which make up 78% of the 41 active rentals. This indicates strong guest preference for privacy and space.
- Looking at the property type distribution in Borzonasca, House properties are the most common (48.8%), reflecting the local real estate landscape.
- Houses represent a significant 48.8% portion, catering likely to families or larger groups.
- The presence of 14.6% Hotel/Boutique listings indicates integration with traditional hospitality.
- Smaller segments like outdoor/unique, unique stays (combined 4.8%) offer potential for unique stay experiences.
Borzonasca Airbnb Room Capacity Analysis (2025): Bedroom Distribution
Distribution of Listings by Number of Bedrooms
Room Capacity Insights for Borzonasca
- The dominant room capacity in Borzonasca is 1 bedroom listings, making up 41.5% of the market. This suggests a strong demand for properties suitable for couples or solo travelers.
- Together, 1 bedroom and 2 bedrooms properties represent 75.6% of the active Airbnb listings in Borzonasca, indicating a high concentration in these sizes.
Borzonasca Vacation Rental Guest Capacity Trends (2025)
Distribution of Listings by Guest Capacity
Guest Capacity Insights for Borzonasca
- The most common guest capacity trend in Borzonasca vacation rentals is listings accommodating 4 guests (26.8%). This suggests the primary traveler segment is likely small families or groups.
- Properties designed for 4 guests and 8+ guests dominate the Borzonasca STR market, accounting for 41.4% of listings.
- 34.2% of properties accommodate 6+ guests, serving the market segment for larger families or group travel in Borzonasca.
- On average, properties in Borzonasca are equipped to host 4.5 guests.
Borzonasca Airbnb Booking Patterns (2025): Available vs. Booked Days
Available Days Distribution
Booked Days Distribution
Booking Pattern Insights for Borzonasca
- The most common availability pattern in Borzonasca falls within the 271-366 days range, representing 80.5% of listings. This suggests many properties have significant open periods on their calendars.
- Approximately 97.6% of listings show high availability (181+ days open annually), indicating potential for increased bookings or specific owner usage patterns.
- For booked days, the 1-30 days range is most frequent in Borzonasca (41.5%), reflecting common guest stay durations or potential owner blocking patterns.
- A notable 2.4% of properties secure long booking periods (181+ days booked per year), highlighting successful long-term rental strategies or significant owner usage.
Borzonasca Airbnb Minimum Stay Requirements Analysis
Distribution of Listings by Minimum Night Requirement
1 Night
18 listings
47.4% of total
2 Nights
13 listings
34.2% of total
3 Nights
1 listings
2.6% of total
4-6 Nights
2 listings
5.3% of total
7-29 Nights
3 listings
7.9% of total
30+ Nights
1 listings
2.6% of total
Key Insights
- The most prevalent minimum stay requirement in Borzonasca is 1 Night, adopted by 47.4% of listings. This highlights the market's preference for shorter, flexible bookings.
- A strong majority (81.6%) of the Borzonasca Airbnb data shows acceptance of very short stays (1-2 nights), indicating a dynamic, high-turnover market.
- Dedicated monthly rentals (30+ nights) represent a small niche (2.6%), possibly an untapped area for hosts.
Recommendations
- Align with the market by considering a 1 Night minimum stay, as 47.4% of Borzonasca hosts use this setting.
- Adjust minimum nights based on seasonality – potentially shorter during low season and longer during peak demand periods in Borzonasca.
Borzonasca Airbnb Cancellation Policy Trends Analysis (2025)
Super Strict 60 Days
1 listings
2.9% of total
Flexible
5 listings
14.3% of total
Moderate
18 listings
51.4% of total
Strict
11 listings
31.4% of total
Cancellation Policy Insights for Borzonasca
- The prevailing Airbnb cancellation policy trend in Borzonasca is Moderate, used by 51.4% of listings.
- There's a relatively balanced mix between guest-friendly (65.7%) and stricter (31.4%) policies, offering choices for different guest needs.
Recommendations for Hosts
- Consider adopting a Moderate policy to align with the 51.4% market standard in Borzonasca.
- With 31.4% using Strict terms, this is a viable option in Borzonasca, particularly for high-value properties or during peak demand periods.
- Regularly review your cancellation policy against competitors and market demand shifts in Borzonasca.
Borzonasca STR Booking Lead Time Analysis (2025)
Average Booking Lead Time by Month
Booking Lead Time Insights for Borzonasca
- The overall average booking lead time for vacation rentals in Borzonasca is 39 days.
- Guests book furthest in advance for stays during June (average 75 days), likely coinciding with peak travel demand or local events.
- The shortest booking windows occur for stays in January (average 12 days), indicating more last-minute travel plans during this time.
- Seasonally, Summer (68 days avg.) sees the longest lead times, while Winter (17 days avg.) has the shortest, reflecting typical travel planning cycles.
Recommendations for Hosts
- Use the overall average lead time (39 days) as a baseline for your pricing and availability strategy in Borzonasca.
- For June stays, consider implementing length-of-stay discounts or slightly higher rates for bookings made less than 75 days out to capitalize on advance planning.
- During January, focus on last-minute booking availability and promotions, as guests book with very short notice (12 days avg.).
- Target marketing efforts for the Summer season well in advance (at least 68 days) to capture early planners.
- Monitor your own booking lead times against these Borzonasca averages to identify opportunities for dynamic pricing adjustments.
Popular & Essential Airbnb Amenities in Borzonasca (2025)
Amenity Prevalence
Amenity Insights for Borzonasca
- Popular amenities like Kitchen, TV, Washer are common but not universal. Offering these can provide a competitive edge.
- Warning: Wifi is not universally provided but is considered essential globally. Ensure reliable Wifi is offered.
Recommendations for Hosts
- Consider adding popular differentiators like Kitchen or TV to increase appeal.
- Highlight unique or less common amenities you offer (e.g., hot tub, dedicated workspace, EV charger) in your listing description and photos.
- Regularly check competitor amenities in Borzonasca to stay competitive.
Borzonasca Airbnb Guest Demographics & Profile Analysis (2025)
Guest Profile Summary for Borzonasca
- The typical guest profile for Airbnb in Borzonasca consists of predominantly international visitors (75%), with top international origins including Italy, typically belonging to the Post-2000s (Gen Z/Alpha) group (50%), primarily speaking English or French.
- Domestic travelers account for 25.2% of guests.
- Key international markets include France (26.7%) and Italy (25.2%).
- Top languages spoken are English (37.9%) followed by French (15.3%).
- A significant demographic segment is the Post-2000s (Gen Z/Alpha) group, representing 50% of guests.
Recommendations for Hosts
- Focus marketing internationally, particularly towards travelers from Italy.
- Tailor amenities and listing descriptions to appeal to the dominant Post-2000s (Gen Z/Alpha) demographic (e.g., highlight fast WiFi, smart home features, local guides).
- Highlight unique local experiences or amenities relevant to the primary guest profile.
- Consider seasonal promotions aligned with peak travel times for key origin markets.
Nearby Short-Term Rental Market Comparison
How does the Borzonasca Airbnb market stack up against its neighbors? Compare key performance metrics like average monthly revenue, ADR, and occupancy rates in surrounding areas to understand the broader regional STR landscape.
| Market | Active Properties | Monthly Revenue | Daily Rate | Avg. Occupancy |
|---|---|---|---|---|
| Laglio | 64 | $4,873 | $463.61 | 47% |
| Brenzone sul Garda | 19 | $4,128 | $335.25 | 52% |
| Portofino | 68 | $4,086 | $454.35 | 44% |
| Sala Comacina | 64 | $3,794 | $400.27 | 50% |
| Cossano Belbo | 13 | $3,632 | $284.21 | 42% |
| Bellagio | 373 | $3,630 | $328.26 | 55% |
| Crespina | 16 | $3,526 | $493.64 | 48% |
| Oliveto Lario | 99 | $3,509 | $327.42 | 55% |
| Carate Urio | 71 | $3,379 | $331.90 | 44% |
| Brienno | 39 | $3,327 | $337.92 | 45% |