Boissano Airbnb Market Analysis 2025: Short Term Rental Data & Vacation Rental Statistics in Liguria, Italy
Is Airbnb profitable in Boissano in 2025? Explore comprehensive Airbnb analytics for Boissano, Liguria, Italy to uncover income potential. This 2025 STR market report for Boissano, based on AirROI data from April 2024 to March 2025, reveals key trends in the niche market of 17 active listings.
Whether you're considering an Airbnb investment in Boissano, optimizing your existing vacation rental, or exploring rental arbitrage opportunities, understanding the Boissano Airbnb data is crucial. Navigating the high regulation landscape is key to maximizing your short term rental income potential. Let's dive into the specifics.
Key Boissano Airbnb Performance Metrics Overview
Monthly Airbnb Revenue Variations & Income Potential in Boissano (2025)
Understanding the monthly revenue variations for Airbnb listings in Boissano is key to maximizing your short term rental income potential. Seasonality significantly impacts earnings. Our analysis, based on data from the past 12 months, shows that the peak revenue month for STRs in Boissano is typically August, while April often presents the lowest earnings, highlighting opportunities for strategic pricing adjustments during shoulder and low seasons. Explore the typical Airbnb income in Boissano across different performance tiers:
- Best-in-class properties (Top 10%) achieve $2,429+ monthly, often utilizing dynamic pricing and superior guest experiences.
- Strong performing properties (Top 25%) earn $1,580 or more, indicating effective management and desirable locations/amenities.
- Typical properties (Median) generate around $912 per month, representing the average market performance.
- Entry-level properties (Bottom 25%) see earnings around $594, often with potential for optimization.
Average Monthly Airbnb Earnings Trend in Boissano
Boissano Airbnb Occupancy Rate Trends (2025)
Maximize your bookings by understanding the Boissano STR occupancy trends. Seasonal demand shifts significantly influence how often properties are booked. Typically, Augustsees the highest demand (peak season occupancy), while April experiences the lowest (low season). Effective strategies, like adjusting minimum stays or offering promotions, can boost occupancy during slower periods. Here's how different property tiers perform in Boissano:
- Best-in-class properties (Top 10%) achieve 63%+ occupancy, indicating high desirability and potentially optimized availability.
- Strong performing properties (Top 25%) maintain 48% or higher occupancy, suggesting good market fit and guest satisfaction.
- Typical properties (Median) have an occupancy rate around 28%.
- Entry-level properties (Bottom 25%) average 20% occupancy, potentially facing higher vacancy.
Average Monthly Occupancy Rate Trend in Boissano
Average Daily Rate (ADR) Airbnb Trends in Boissano (2025)
Effective short term rental pricing strategy in Boissano involves understanding monthly ADR fluctuations. The Average Daily Rate (ADR) for Airbnb in Boissano typically peaks in August and dips lowest during November. Leveraging Airbnb dynamic pricing tools or strategies based on this seasonality can significantly boost revenue. Here's a look at the typical nightly rates achieved:
- Best-in-class properties (Top 10%) command rates of $183+ per night, often due to premium features or locations.
- Strong performing properties (Top 25%) achieve nightly rates of $125 or more.
- Typical properties (Median) charge around $103 per night.
- Entry-level properties (Bottom 25%) earn around $80 per night.
Average Daily Rate (ADR) Trend by Month in Boissano
Get Live Boissano Market Intelligence 👇

Explore Real-time Analytics
Airbnb Seasonality Analysis & Trends in Boissano (2025)
Peak Season (August, July, September)
- Revenue averages $2,350 per month
- Occupancy rates average 62.8%
- Daily rates average $121
Shoulder Season
- Revenue averages $908 per month
- Occupancy maintains around 28.1%
- Daily rates hold near $105
Low Season (January, March, April)
- Revenue drops to average $493 per month
- Occupancy decreases to average 18.8%
- Daily rates adjust to average $106
Seasonality Insights for Boissano
- The Airbnb seasonality in Boissano shows highly seasonal trends requiring careful strategy. While the sections above show seasonal averages, it's also insightful to look at the extremes:
- During the high season, the absolute peak month showcases Boissano's highest earning potential, with monthly revenues capable of climbing to $2,981, occupancy reaching a high of 72.1%, and ADRs peaking at $126.
- Conversely, the slowest single month of the year, typically falling within the low season, marks the market's lowest point. In this month, revenue might dip to $382, occupancy could drop to 16.7%, and ADRs may adjust down to $95.
- Understanding both the seasonal averages and these monthly peaks and troughs in revenue, occupancy, and ADR is crucial for maximizing your Airbnb profit potential in Boissano.
Seasonal Strategies for Maximizing Profit
- Peak Season: Maximize revenue through premium pricing and potentially longer minimum stays. Ensure high availability.
- Low Season: Offer competitive pricing, special promotions (e.g., extended stay discounts), and flexible cancellation policies. Target off-season travelers like remote workers or budget-conscious guests.
- Shoulder Seasons: Implement dynamic pricing that balances peak and low rates. Target weekend travelers or specific events. Offer slightly more flexible terms than peak season.
- Regularly analyze your own performance against these Boissano seasonality benchmarks and adjust your pricing and availability strategy accordingly.
Best Areas for Airbnb Investment in Boissano (2025)
Exploring the top neighborhoods for short-term rentals in Boissano? This section highlights key areas, outlining why they are attractive for hosts and guests, along with notable local attractions. Consider these locations based on your target guest profile and investment strategy.
| Neighborhood / Area | Why Host Here? (Target Guests & Appeal) | Key Attractions & Landmarks |
|---|---|---|
| Centro Storico | The historic center of Boissano, featuring charming narrow streets and historic buildings. Attracts tourists interested in culture and history, with easy access to local shops and cafes. | Chiesa di San Giovanni Battista, Local artisan shops, Nearby hiking trails, Piazza della Libertà, Gelaterie |
| Boissano Beach | The beachfront area ideal for summer visitors looking for sun and sea. Attracts families and beachgoers wanting to relax by the Mediterranean. | Boissano Beach, Water sports activities, Beachfront restaurants, Sunbathing spots, Walking trails along the coast |
| Cascina | Semi-rural area with scenic views, offering a tranquil atmosphere for nature lovers. Popular among those looking for a peaceful retreat while still being close to the coast. | Nature reserves, Hiking paths, Local farm shops, Stunning landscapes, Wildlife watching |
| Vallecrosia | Neighboring town providing additional amenities and attractions, expanding the reach for potential tourists. Known for its lively promenade and beach activities. | Vallecrosia Promenade, Public beaches, Local markets, Restaurants, Cafes |
| Sanremo | Famous nearby city known for its music festival and casinos, attracts a wide variety of tourists year-round. Hosts many international events, increasing accommodation demands. | Casino di Sanremo, Sanremo Music Festival, Ariston Theatre, Villa Nobel, Breathtaking coastal views |
| Alassio | A popular tourist destination known for its sandy beaches and beautiful seafront. Offers a vibrant atmosphere, appealing to both families and young travelers. | Alassio Beach, Muretto of Alassio, Shopping streets, Dining options, Water sports |
| Finale Ligure | A short drive away, this area is well-known for outdoor sports, especially biking and rock climbing, attracting adventure seekers. | Finale Ligure beaches, Mountain biking trails, Climbing spots, Finalborgo village, Outdoor adventure shops |
| Cervo | A picturesque hillside village with stunning views of the Mediterranean, ideal for those seeking a more authentic Italian experience. Attracts tourists interested in arts and culture. | Cervo's historic center, Art galleries, Breathtaking viewpoints, Cultural festivals, Fests and events throughout the year |
Understanding Airbnb License Requirements & STR Laws in Boissano (2025)
Yes, Boissano, Liguria, Italy enforces high STR regulations. Obtaining a license and ensuring compliance is almost certainly required according to current 2025 STR laws. Always verify the latest short term rental regulations and Airbnb license requirements directly with local government authorities for Boissano to ensure full compliance before hosting.
(Source: AirROI data, 2025, based on 71% licensed listings)
Top Performing Airbnb Properties in Boissano (2025)
Benchmark your potential! Explore examples of top-performing Airbnb properties in Boissanobased on Trailing Twelve Month (TTM) revenue. Analyze their characteristics, revenue, occupancy rate, and ADR to understand what drives success in this market.

Vintage House - Relax in the sun
Entire Place • 3 bedrooms
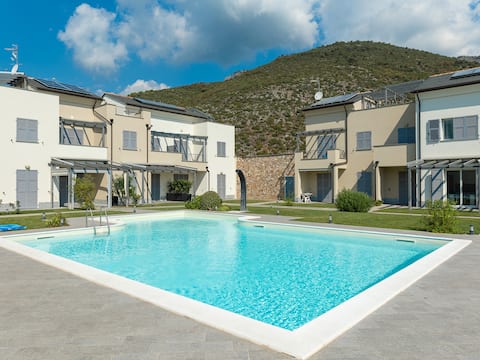
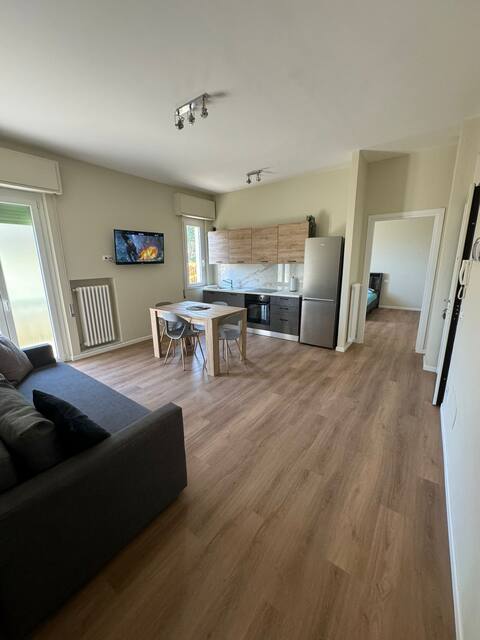
Perla Pellegrina - seaview pool and amazing garden
Entire Place • 2 bedrooms

three-room apartment with sea view
Entire Place • 2 bedrooms

Sea View Apartment
Entire Place • 1 bedroom

Casetta indipendente con terrazza e giardino
Entire Place • N/A
Friz Appartamento
Entire Place • 1 bedroom
Note: Performance varies based on location, size, amenities, seasonality, and management quality. Data reflects the past 12 months.
Top Performing Airbnb Hosts in Boissano (2025)
Learn from the best! This table showcases top-performing Airbnb hosts in Boissano based on the number of properties managed and estimated total revenue over the past year. Analyze their scale and performance metrics.
| Host Name | Properties | Grossing Revenue | Stay Reviews | Avg Rating |
|---|---|---|---|---|
| Nicoletta | 1 | $20,966 | 110 | 4.75/5.0 |
| Enjoy | 1 | $19,170 | 4 | 4.75/5.0 |
| Cristina | 2 | $18,026 | 100 | 4.69/5.0 |
| Host #329536506 | 2 | $17,438 | 0 | 0.00/5.0 |
| Marco | 2 | $16,742 | 11 | 4.80/5.0 |
| Andrea | 1 | $15,302 | 9 | 5.00/5.0 |
| Host #431960 | 1 | $11,015 | 23 | 4.87/5.0 |
| Luisa | 1 | $8,837 | 62 | 4.95/5.0 |
| Guido | 1 | $7,358 | 4 | 5.00/5.0 |
| Claudio | 1 | $7,265 | 103 | 4.83/5.0 |
Analyzing the strategies of top hosts, such as their property selection, pricing, and guest communication, can offer valuable lessons for optimizing your own Airbnb operations in Boissano.
Dive Deeper: Advanced Boissano STR Market Data (2025)
Ready to unlock more insights? AirROI provides access to advanced metrics and comprehensive Airbnb data for Boissano. Explore detailed analytics beyond this report to refine your investment strategy, optimize pricing, and maximize your vacation rental profits.
Explore Advanced MetricsBoissano Short-Term Rental Market Composition (2025): Property & Room Types
Room Type Distribution
Property Type Distribution
Market Composition Insights for Boissano
- The Boissano Airbnb market composition is heavily skewed towards Entire Home/Apt listings, which make up 88.2% of the 17 active rentals. This indicates strong guest preference for privacy and space.
- Looking at the property type distribution in Boissano, Apartment/Condo properties are the most common (58.8%), reflecting the local real estate landscape.
- Houses represent a significant 29.4% portion, catering likely to families or larger groups.
- The presence of 11.8% Hotel/Boutique listings indicates integration with traditional hospitality.
Boissano Airbnb Room Capacity Analysis (2025): Bedroom Distribution
Distribution of Listings by Number of Bedrooms
Room Capacity Insights for Boissano
- The dominant room capacity in Boissano is 1 bedroom listings, making up 41.2% of the market. This suggests a strong demand for properties suitable for couples or solo travelers.
- Together, 1 bedroom and 3 bedrooms properties represent 70.6% of the active Airbnb listings in Boissano, indicating a high concentration in these sizes.
- A significant 29.4% of listings offer 3+ bedrooms, catering to larger groups and families seeking more space in Boissano.
Boissano Vacation Rental Guest Capacity Trends (2025)
Distribution of Listings by Guest Capacity
Guest Capacity Insights for Boissano
- The most common guest capacity trend in Boissano vacation rentals is listings accommodating 4 guests (47.1%). This suggests the primary traveler segment is likely small families or groups.
- Properties designed for 4 guests and 8+ guests dominate the Boissano STR market, accounting for 64.7% of listings.
- 35.2% of properties accommodate 6+ guests, serving the market segment for larger families or group travel in Boissano.
- On average, properties in Boissano are equipped to host 4.5 guests.
Boissano Airbnb Booking Patterns (2025): Available vs. Booked Days
Available Days Distribution
Booked Days Distribution
Booking Pattern Insights for Boissano
- The most common availability pattern in Boissano falls within the 181-270 days range, representing 52.9% of listings. This suggests many properties have significant open periods on their calendars.
- Approximately 100.0% of listings show high availability (181+ days open annually), indicating potential for increased bookings or specific owner usage patterns.
- For booked days, the 91-180 days range is most frequent in Boissano (58.8%), reflecting common guest stay durations or potential owner blocking patterns.
Boissano Airbnb Minimum Stay Requirements Analysis
Distribution of Listings by Minimum Night Requirement
1 Night
2 listings
13.3% of total
2 Nights
7 listings
46.7% of total
3 Nights
3 listings
20% of total
4-6 Nights
1 listings
6.7% of total
7-29 Nights
1 listings
6.7% of total
30+ Nights
1 listings
6.7% of total
Key Insights
- The most prevalent minimum stay requirement in Boissano is 2 Nights, adopted by 46.7% of listings. This highlights the market's preference for shorter, flexible bookings.
Recommendations
- Align with the market by considering a 2 Nights minimum stay, as 46.7% of Boissano hosts use this setting.
- If feasible, allowing 1-night stays, especially midweek or during low season, could capture last-minute bookings, as only 13.3% currently do.
- A 2-night minimum appears standard (46.7%). Consider this for weekends or peak periods.
- Explore offering discounts for stays of 30+ nights to attract the 6.7% of the market seeking extended stays.
- Adjust minimum nights based on seasonality – potentially shorter during low season and longer during peak demand periods in Boissano.
Boissano Airbnb Cancellation Policy Trends Analysis (2025)
Super Strict 30 Days
1 listings
7.7% of total
Moderate
9 listings
69.2% of total
Strict
3 listings
23.1% of total
Cancellation Policy Insights for Boissano
- The prevailing Airbnb cancellation policy trend in Boissano is Moderate, used by 69.2% of listings.
- There's a relatively balanced mix between guest-friendly (69.2%) and stricter (23.1%) policies, offering choices for different guest needs.
Recommendations for Hosts
- Consider adopting a Moderate policy to align with the 69.2% market standard in Boissano.
- Regularly review your cancellation policy against competitors and market demand shifts in Boissano.
Boissano STR Booking Lead Time Analysis (2025)
Average Booking Lead Time by Month
Booking Lead Time Insights for Boissano
- The overall average booking lead time for vacation rentals in Boissano is 57 days.
- Guests book furthest in advance for stays during January (average 86 days), likely coinciding with peak travel demand or local events.
- The shortest booking windows occur for stays in November (average 14 days), indicating more last-minute travel plans during this time.
- Seasonally, Summer (71 days avg.) sees the longest lead times, while Fall (28 days avg.) has the shortest, reflecting typical travel planning cycles.
Recommendations for Hosts
- Use the overall average lead time (57 days) as a baseline for your pricing and availability strategy in Boissano.
- For January stays, consider implementing length-of-stay discounts or slightly higher rates for bookings made less than 86 days out to capitalize on advance planning.
- During November, focus on last-minute booking availability and promotions, as guests book with very short notice (14 days avg.).
- Target marketing efforts for the Summer season well in advance (at least 71 days) to capture early planners.
- Monitor your own booking lead times against these Boissano averages to identify opportunities for dynamic pricing adjustments.
Popular & Essential Airbnb Amenities in Boissano (2025)
Amenity Prevalence
Amenity Insights for Boissano
- Essential amenities in Boissano that guests expect include: TV. Lacking these (this) could significantly impact bookings.
- Popular amenities like Wifi, Hot water, Washer are common but not universal. Offering these can provide a competitive edge.
- Warning: Wifi is not universally provided but is considered essential globally. Ensure reliable Wifi is offered.
Recommendations for Hosts
- Ensure your listing includes all essential amenities for Boissano: TV.
- Consider adding popular differentiators like Wifi or Hot water to increase appeal.
- Highlight unique or less common amenities you offer (e.g., hot tub, dedicated workspace, EV charger) in your listing description and photos.
- Regularly check competitor amenities in Boissano to stay competitive.
Boissano Airbnb Guest Demographics & Profile Analysis (2025)
Guest Profile Summary for Boissano
- The typical guest profile for Airbnb in Boissano consists of a mix of domestic (43%) and international guests, with top international origins including France, typically belonging to the Post-2000s (Gen Z/Alpha) group (50%), primarily speaking English or Italian.
- Domestic travelers account for 42.9% of guests.
- Key international markets include Italy (42.9%) and France (20.6%).
- Top languages spoken are English (38%) followed by Italian (21.5%).
- A significant demographic segment is the Post-2000s (Gen Z/Alpha) group, representing 50% of guests.
Recommendations for Hosts
- Balance marketing efforts between domestic and international channels based on the guest mix.
- Tailor amenities and listing descriptions to appeal to the dominant Post-2000s (Gen Z/Alpha) demographic (e.g., highlight fast WiFi, smart home features, local guides).
- Highlight unique local experiences or amenities relevant to the primary guest profile.
- Consider seasonal promotions aligned with peak travel times for key origin markets.
Nearby Short-Term Rental Market Comparison
How does the Boissano Airbnb market stack up against its neighbors? Compare key performance metrics like average monthly revenue, ADR, and occupancy rates in surrounding areas to understand the broader regional STR landscape.
| Market | Active Properties | Monthly Revenue | Daily Rate | Avg. Occupancy |
|---|---|---|---|---|
| Laglio | 64 | $4,873 | $463.61 | 47% |
| Monteu Roero | 16 | $4,432 | $540.14 | 36% |
| Portofino | 68 | $4,086 | $454.35 | 44% |
| Saint-Jean-Cap-Ferrat | 107 | $3,844 | $424.21 | 46% |
| Sala Comacina | 64 | $3,794 | $400.27 | 50% |
| Cossano Belbo | 13 | $3,632 | $284.21 | 42% |
| Bellagio | 373 | $3,630 | $328.26 | 55% |
| Oliveto Lario | 99 | $3,509 | $327.42 | 55% |
| Carate Urio | 71 | $3,379 | $331.90 | 44% |
| Brienno | 39 | $3,327 | $337.92 | 45% |