Arcola Airbnb Market Analysis 2025: Short Term Rental Data & Vacation Rental Statistics in Liguria, Italy
Is Airbnb profitable in Arcola in 2025? Explore comprehensive Airbnb analytics for Arcola, Liguria, Italy to uncover income potential. This 2025 STR market report for Arcola, based on AirROI data from April 2024 to March 2025, reveals key trends in the niche market of 99 active listings.
Whether you're considering an Airbnb investment in Arcola, optimizing your existing vacation rental, or exploring rental arbitrage opportunities, understanding the Arcola Airbnb data is crucial. Navigating the high regulation landscape is key to maximizing your short term rental income potential. Let's dive into the specifics.
Key Arcola Airbnb Performance Metrics Overview
Monthly Airbnb Revenue Variations & Income Potential in Arcola (2025)
Understanding the monthly revenue variations for Airbnb listings in Arcola is key to maximizing your short term rental income potential. Seasonality significantly impacts earnings. Our analysis, based on data from the past 12 months, shows that the peak revenue month for STRs in Arcola is typically August, while January often presents the lowest earnings, highlighting opportunities for strategic pricing adjustments during shoulder and low seasons. Explore the typical Airbnb income in Arcola across different performance tiers:
- Best-in-class properties (Top 10%) achieve $2,993+ monthly, often utilizing dynamic pricing and superior guest experiences.
- Strong performing properties (Top 25%) earn $1,889 or more, indicating effective management and desirable locations/amenities.
- Typical properties (Median) generate around $1,122 per month, representing the average market performance.
- Entry-level properties (Bottom 25%) see earnings around $573, often with potential for optimization.
Average Monthly Airbnb Earnings Trend in Arcola
Arcola Airbnb Occupancy Rate Trends (2025)
Maximize your bookings by understanding the Arcola STR occupancy trends. Seasonal demand shifts significantly influence how often properties are booked. Typically, Augustsees the highest demand (peak season occupancy), while February experiences the lowest (low season). Effective strategies, like adjusting minimum stays or offering promotions, can boost occupancy during slower periods. Here's how different property tiers perform in Arcola:
- Best-in-class properties (Top 10%) achieve 68%+ occupancy, indicating high desirability and potentially optimized availability.
- Strong performing properties (Top 25%) maintain 55% or higher occupancy, suggesting good market fit and guest satisfaction.
- Typical properties (Median) have an occupancy rate around 33%.
- Entry-level properties (Bottom 25%) average 17% occupancy, potentially facing higher vacancy.
Average Monthly Occupancy Rate Trend in Arcola
Average Daily Rate (ADR) Airbnb Trends in Arcola (2025)
Effective short term rental pricing strategy in Arcola involves understanding monthly ADR fluctuations. The Average Daily Rate (ADR) for Airbnb in Arcola typically peaks in August and dips lowest during October. Leveraging Airbnb dynamic pricing tools or strategies based on this seasonality can significantly boost revenue. Here's a look at the typical nightly rates achieved:
- Best-in-class properties (Top 10%) command rates of $226+ per night, often due to premium features or locations.
- Strong performing properties (Top 25%) achieve nightly rates of $132 or more.
- Typical properties (Median) charge around $95 per night.
- Entry-level properties (Bottom 25%) earn around $77 per night.
Average Daily Rate (ADR) Trend by Month in Arcola
Get Live Arcola Market Intelligence 👇

Explore Real-time Analytics
Airbnb Seasonality Analysis & Trends in Arcola (2025)
Peak Season (August, May, July)
- Revenue averages $2,566 per month
- Occupancy rates average 56.4%
- Daily rates average $141
Shoulder Season
- Revenue averages $1,472 per month
- Occupancy maintains around 35.3%
- Daily rates hold near $131
Low Season (January, February, December)
- Revenue drops to average $710 per month
- Occupancy decreases to average 18.8%
- Daily rates adjust to average $134
Seasonality Insights for Arcola
- The Airbnb seasonality in Arcola shows highly seasonal trends requiring careful strategy. While the sections above show seasonal averages, it's also insightful to look at the extremes:
- During the high season, the absolute peak month showcases Arcola's highest earning potential, with monthly revenues capable of climbing to $2,870, occupancy reaching a high of 66.7%, and ADRs peaking at $145.
- Conversely, the slowest single month of the year, typically falling within the low season, marks the market's lowest point. In this month, revenue might dip to $633, occupancy could drop to 14.5%, and ADRs may adjust down to $125.
- Understanding both the seasonal averages and these monthly peaks and troughs in revenue, occupancy, and ADR is crucial for maximizing your Airbnb profit potential in Arcola.
Seasonal Strategies for Maximizing Profit
- Peak Season: Maximize revenue through premium pricing and potentially longer minimum stays. Ensure high availability.
- Low Season: Offer competitive pricing, special promotions (e.g., extended stay discounts), and flexible cancellation policies. Target off-season travelers like remote workers or budget-conscious guests.
- Shoulder Seasons: Implement dynamic pricing that balances peak and low rates. Target weekend travelers or specific events. Offer slightly more flexible terms than peak season.
- Regularly analyze your own performance against these Arcola seasonality benchmarks and adjust your pricing and availability strategy accordingly.
Best Areas for Airbnb Investment in Arcola (2025)
Exploring the top neighborhoods for short-term rentals in Arcola? This section highlights key areas, outlining why they are attractive for hosts and guests, along with notable local attractions. Consider these locations based on your target guest profile and investment strategy.
| Neighborhood / Area | Why Host Here? (Target Guests & Appeal) | Key Attractions & Landmarks |
|---|---|---|
| Arcola Historical Center | A picturesque village with historic charm, making it appealing for tourists who enjoy culture and history. Close to attractions and scenic views. | Castello di Arcola, Chiesa dei Santi Giacomo e Filippo, Parco della Rimembranza |
| La Spezia Marina | Ideal for those interested in coastal activities and access to the famous Cinque Terre. This area draws travelers looking for sea adventures and beautiful landscapes. | Marina di La Spezia, Promontorio di Portovenere, Teatro Civico, Parco Naturale Regionale di Porto Venere |
| Lerici | Known for its stunning beaches and medieval castle, Lerici is perfect for beachgoers and history lovers alike, providing a romantic getaway. | Castello di Lerici, Spiaggia di Lerici, Bocca di Magra, Isola di Palmaria |
| Sarzana | A charming town known for its historical sites, festivals, and local cuisine. It attracts tourists looking to explore the cultural richness of the region. | Fortezza Firmafede, Chiesa di San Bartolomeo, Sarzana's antique market, Palazzo Ricci |
| Tellaro | A beautiful seaside village renowned for its colorful houses and artistic vibe. Perfect for those seeking tranquility and scenic beauty. | Tellaro Beach, Church of San Giorgio, Scenic coastal walks |
| Portovenere | A UNESCO World Heritage site featuring stunning coastal views and rich history. It draws tourists interested in nature and culture. | San Pietro Church, Doria Castle, Palmaria Island, Venere Azzurra Beach |
| Fossola | A charming area close to nature, ideal for those looking for a peaceful retreat away from the hustle and bustle of the coast. | Nature walks, Local vineyards, Countryside views |
| Montemarcello | An ancient village with breathtaking views of the Gulf of La Spezia. It's perfect for hiking enthusiasts and nature lovers. | Montemarcello Regional Park, Church of San Francesco, Scenic viewpoints |
Understanding Airbnb License Requirements & STR Laws in Arcola (2025)
Yes, Arcola, Liguria, Italy enforces high STR regulations. Obtaining a license and ensuring compliance is almost certainly required according to current 2025 STR laws. Always verify the latest short term rental regulations and Airbnb license requirements directly with local government authorities for Arcola to ensure full compliance before hosting.
(Source: AirROI data, 2025, based on 56% licensed listings)
Top Performing Airbnb Properties in Arcola (2025)
Benchmark your potential! Explore examples of top-performing Airbnb properties in Arcolabased on Trailing Twelve Month (TTM) revenue. Analyze their characteristics, revenue, occupancy rate, and ADR to understand what drives success in this market.
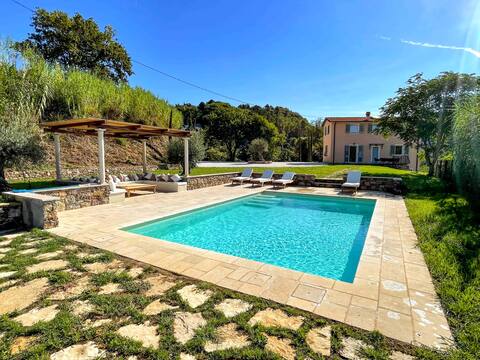
3 Bedroom Villa with Private Pool and Garden
Entire Place • 3 bedrooms
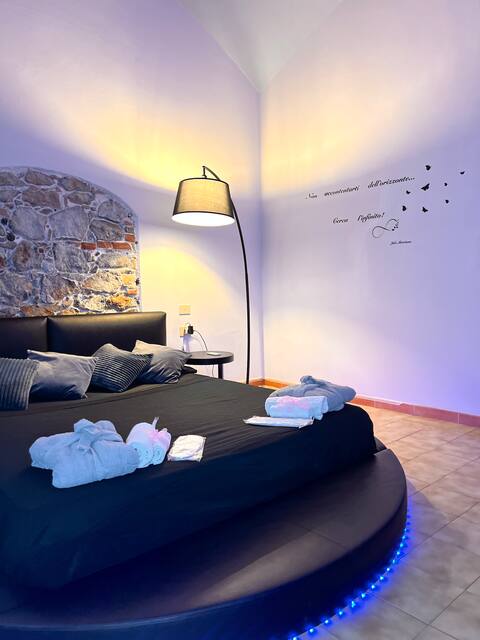
(R&Vrooms) Comfort Room • La Spezia
Entire Place • 1 bedroom
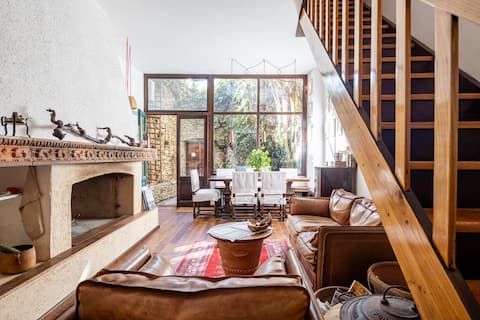
Boutique hotels in the ancient heart of the medieval village of Trebiano Magra
Private Room • 1 bedroom
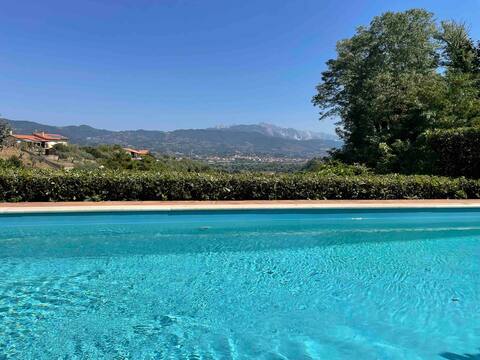
Villa with pool"La Chicchera"Cinque Terre
Entire Place • 3 bedrooms

Bed&Vista suite
Entire Place • 1 bedroom
Charming & dog-friendly; office + fantastic views
Entire Place • 1 bedroom
Note: Performance varies based on location, size, amenities, seasonality, and management quality. Data reflects the past 12 months.
Top Performing Airbnb Hosts in Arcola (2025)
Learn from the best! This table showcases top-performing Airbnb hosts in Arcola based on the number of properties managed and estimated total revenue over the past year. Analyze their scale and performance metrics.
| Host Name | Properties | Grossing Revenue | Stay Reviews | Avg Rating |
|---|---|---|---|---|
| Brian | 1 | $80,760 | 45 | 4.96/5.0 |
| Fabrizia | 3 | $80,349 | 38 | 3.04/5.0 |
| Lucia, Luca E Gianfry | 2 | $74,852 | 57 | 4.96/5.0 |
| Host #430414936 | 1 | $69,279 | 67 | 4.94/5.0 |
| Elias | 2 | $37,521 | 282 | 4.88/5.0 |
| Carolina | 3 | $31,553 | 141 | 4.52/5.0 |
| John | 1 | $29,737 | 30 | 4.77/5.0 |
| Franca | 2 | $26,329 | 62 | 4.88/5.0 |
| Dario | 1 | $25,576 | 18 | 4.94/5.0 |
| Arabella | 3 | $24,408 | 231 | 4.61/5.0 |
Analyzing the strategies of top hosts, such as their property selection, pricing, and guest communication, can offer valuable lessons for optimizing your own Airbnb operations in Arcola.
Dive Deeper: Advanced Arcola STR Market Data (2025)
Ready to unlock more insights? AirROI provides access to advanced metrics and comprehensive Airbnb data for Arcola. Explore detailed analytics beyond this report to refine your investment strategy, optimize pricing, and maximize your vacation rental profits.
Explore Advanced MetricsArcola Short-Term Rental Market Composition (2025): Property & Room Types
Room Type Distribution
Property Type Distribution
Market Composition Insights for Arcola
- The Arcola Airbnb market composition is heavily skewed towards Entire Home/Apt listings, which make up 89.9% of the 99 active rentals. This indicates strong guest preference for privacy and space.
- Looking at the property type distribution in Arcola, House properties are the most common (52.5%), reflecting the local real estate landscape.
- Houses represent a significant 52.5% portion, catering likely to families or larger groups.
- The presence of 5.1% Hotel/Boutique listings indicates integration with traditional hospitality.
- Smaller segments like outdoor/unique (combined 1.0%) offer potential for unique stay experiences.
Arcola Airbnb Room Capacity Analysis (2025): Bedroom Distribution
Distribution of Listings by Number of Bedrooms
Room Capacity Insights for Arcola
- The dominant room capacity in Arcola is 1 bedroom listings, making up 62.6% of the market. This suggests a strong demand for properties suitable for couples or solo travelers.
- Together, 1 bedroom and 2 bedrooms properties represent 83.8% of the active Airbnb listings in Arcola, indicating a high concentration in these sizes.
- With over half the market (62.6%) consisting of studios or 1-bedroom units, Arcola is particularly well-suited for individuals or couples.
- Listings with 3+ bedrooms (9.1%) represent a smaller niche, potentially indicating an underserved market for larger group accommodations in Arcola.
Arcola Vacation Rental Guest Capacity Trends (2025)
Distribution of Listings by Guest Capacity
Guest Capacity Insights for Arcola
- The most common guest capacity trend in Arcola vacation rentals is listings accommodating 4 guests (35.4%). This suggests the primary traveler segment is likely small families or groups.
- Properties designed for 4 guests and 2 guests dominate the Arcola STR market, accounting for 59.6% of listings.
- 16.1% of properties accommodate 6+ guests, serving the market segment for larger families or group travel in Arcola.
- On average, properties in Arcola are equipped to host 3.7 guests.
Arcola Airbnb Booking Patterns (2025): Available vs. Booked Days
Available Days Distribution
Booked Days Distribution
Booking Pattern Insights for Arcola
- The most common availability pattern in Arcola falls within the 271-366 days range, representing 50.5% of listings. This suggests many properties have significant open periods on their calendars.
- Approximately 90.9% of listings show high availability (181+ days open annually), indicating potential for increased bookings or specific owner usage patterns.
- For booked days, the 91-180 days range is most frequent in Arcola (40.4%), reflecting common guest stay durations or potential owner blocking patterns.
- A notable 10.1% of properties secure long booking periods (181+ days booked per year), highlighting successful long-term rental strategies or significant owner usage.
Arcola Airbnb Minimum Stay Requirements Analysis
Distribution of Listings by Minimum Night Requirement
1 Night
11 listings
12.1% of total
2 Nights
39 listings
42.9% of total
3 Nights
10 listings
11% of total
4-6 Nights
9 listings
9.9% of total
7-29 Nights
14 listings
15.4% of total
30+ Nights
8 listings
8.8% of total
Key Insights
- The most prevalent minimum stay requirement in Arcola is 2 Nights, adopted by 42.9% of listings. This highlights the market's preference for shorter, flexible bookings.
Recommendations
- Align with the market by considering a 2 Nights minimum stay, as 42.9% of Arcola hosts use this setting.
- If feasible, allowing 1-night stays, especially midweek or during low season, could capture last-minute bookings, as only 12.1% currently do.
- A 2-night minimum appears standard (42.9%). Consider this for weekends or peak periods.
- Explore offering discounts for stays of 30+ nights to attract the 8.8% of the market seeking extended stays.
- Adjust minimum nights based on seasonality – potentially shorter during low season and longer during peak demand periods in Arcola.
Arcola Airbnb Cancellation Policy Trends Analysis (2025)
Flexible
23 listings
26.4% of total
Moderate
51 listings
58.6% of total
Strict
13 listings
14.9% of total
Cancellation Policy Insights for Arcola
- The prevailing Airbnb cancellation policy trend in Arcola is Moderate, used by 58.6% of listings.
- The market strongly favors guest-friendly terms, with 85.0% of listings offering Flexible or Moderate policies. This suggests guests in Arcola may expect booking flexibility.
Recommendations for Hosts
- Consider adopting a Moderate policy to align with the 58.6% market standard in Arcola.
- Using a Strict policy might deter some guests, as only 14.9% of listings use it. Evaluate if potential revenue protection outweighs possible lower booking rates.
- Regularly review your cancellation policy against competitors and market demand shifts in Arcola.
Arcola STR Booking Lead Time Analysis (2025)
Average Booking Lead Time by Month
Booking Lead Time Insights for Arcola
- The overall average booking lead time for vacation rentals in Arcola is 49 days.
- Guests book furthest in advance for stays during July (average 93 days), likely coinciding with peak travel demand or local events.
- The shortest booking windows occur for stays in January (average 22 days), indicating more last-minute travel plans during this time.
- Seasonally, Summer (77 days avg.) sees the longest lead times, while Winter (43 days avg.) has the shortest, reflecting typical travel planning cycles.
Recommendations for Hosts
- Use the overall average lead time (49 days) as a baseline for your pricing and availability strategy in Arcola.
- For July stays, consider implementing length-of-stay discounts or slightly higher rates for bookings made less than 93 days out to capitalize on advance planning.
- Target marketing efforts for the Summer season well in advance (at least 77 days) to capture early planners.
- Monitor your own booking lead times against these Arcola averages to identify opportunities for dynamic pricing adjustments.
Popular & Essential Airbnb Amenities in Arcola (2025)
Amenity Prevalence
Amenity Insights for Arcola
- Essential amenities in Arcola that guests expect include: Essentials. Lacking these (this) could significantly impact bookings.
- Popular amenities like Kitchen, Hair dryer, Wifi are common but not universal. Offering these can provide a competitive edge.
- Warning: Wifi is not universally provided but is considered essential globally. Ensure reliable Wifi is offered.
Recommendations for Hosts
- Ensure your listing includes all essential amenities for Arcola: Essentials.
- Prioritize adding missing essentials: Essentials.
- Consider adding popular differentiators like Kitchen or Hair dryer to increase appeal.
- Highlight unique or less common amenities you offer (e.g., hot tub, dedicated workspace, EV charger) in your listing description and photos.
- Regularly check competitor amenities in Arcola to stay competitive.
Arcola Airbnb Guest Demographics & Profile Analysis (2025)
Guest Profile Summary for Arcola
- The typical guest profile for Airbnb in Arcola consists of predominantly international visitors (85%), with top international origins including Italy, typically belonging to the Post-2000s (Gen Z/Alpha) group (50%), primarily speaking English or French.
- Domestic travelers account for 15.2% of guests.
- Key international markets include France (36.5%) and Italy (15.2%).
- Top languages spoken are English (35.3%) followed by French (21.2%).
- A significant demographic segment is the Post-2000s (Gen Z/Alpha) group, representing 50% of guests.
Recommendations for Hosts
- Focus marketing internationally, particularly towards travelers from Italy.
- Tailor amenities and listing descriptions to appeal to the dominant Post-2000s (Gen Z/Alpha) demographic (e.g., highlight fast WiFi, smart home features, local guides).
- Highlight unique local experiences or amenities relevant to the primary guest profile.
- Consider seasonal promotions aligned with peak travel times for key origin markets.
Nearby Short-Term Rental Market Comparison
How does the Arcola Airbnb market stack up against its neighbors? Compare key performance metrics like average monthly revenue, ADR, and occupancy rates in surrounding areas to understand the broader regional STR landscape.
| Market | Active Properties | Monthly Revenue | Daily Rate | Avg. Occupancy |
|---|---|---|---|---|
| Laglio | 64 | $4,873 | $463.61 | 47% |
| Brenzone sul Garda | 19 | $4,128 | $335.25 | 52% |
| Portofino | 68 | $4,086 | $454.35 | 44% |
| Sala Comacina | 64 | $3,794 | $400.27 | 50% |
| Cossano Belbo | 13 | $3,632 | $284.21 | 42% |
| Bellagio | 373 | $3,630 | $328.26 | 55% |
| Crespina | 16 | $3,526 | $493.64 | 48% |
| Oliveto Lario | 99 | $3,509 | $327.42 | 55% |
| Carate Urio | 71 | $3,379 | $331.90 | 44% |
| Brienno | 39 | $3,327 | $337.92 | 45% |