Albenga Airbnb Market Analysis 2025: Short Term Rental Data & Vacation Rental Statistics in Liguria, Italy
Is Airbnb profitable in Albenga in 2025? Explore comprehensive Airbnb analytics for Albenga, Liguria, Italy to uncover income potential. This 2025 STR market report for Albenga, based on AirROI data from April 2024 to March 2025, reveals key trends in the niche market of 142 active listings.
Whether you're considering an Airbnb investment in Albenga, optimizing your existing vacation rental, or exploring rental arbitrage opportunities, understanding the Albenga Airbnb data is crucial. Navigating the high regulation landscape is key to maximizing your short term rental income potential. Let's dive into the specifics.
Key Albenga Airbnb Performance Metrics Overview
Monthly Airbnb Revenue Variations & Income Potential in Albenga (2025)
Understanding the monthly revenue variations for Airbnb listings in Albenga is key to maximizing your short term rental income potential. Seasonality significantly impacts earnings. Our analysis, based on data from the past 12 months, shows that the peak revenue month for STRs in Albenga is typically August, while February often presents the lowest earnings, highlighting opportunities for strategic pricing adjustments during shoulder and low seasons. Explore the typical Airbnb income in Albenga across different performance tiers:
- Best-in-class properties (Top 10%) achieve $3,024+ monthly, often utilizing dynamic pricing and superior guest experiences.
- Strong performing properties (Top 25%) earn $1,921 or more, indicating effective management and desirable locations/amenities.
- Typical properties (Median) generate around $1,149 per month, representing the average market performance.
- Entry-level properties (Bottom 25%) see earnings around $598, often with potential for optimization.
Average Monthly Airbnb Earnings Trend in Albenga
Albenga Airbnb Occupancy Rate Trends (2025)
Maximize your bookings by understanding the Albenga STR occupancy trends. Seasonal demand shifts significantly influence how often properties are booked. Typically, Augustsees the highest demand (peak season occupancy), while January experiences the lowest (low season). Effective strategies, like adjusting minimum stays or offering promotions, can boost occupancy during slower periods. Here's how different property tiers perform in Albenga:
- Best-in-class properties (Top 10%) achieve 69%+ occupancy, indicating high desirability and potentially optimized availability.
- Strong performing properties (Top 25%) maintain 49% or higher occupancy, suggesting good market fit and guest satisfaction.
- Typical properties (Median) have an occupancy rate around 31%.
- Entry-level properties (Bottom 25%) average 15% occupancy, potentially facing higher vacancy.
Average Monthly Occupancy Rate Trend in Albenga
Average Daily Rate (ADR) Airbnb Trends in Albenga (2025)
Effective short term rental pricing strategy in Albenga involves understanding monthly ADR fluctuations. The Average Daily Rate (ADR) for Airbnb in Albenga typically peaks in August and dips lowest during March. Leveraging Airbnb dynamic pricing tools or strategies based on this seasonality can significantly boost revenue. Here's a look at the typical nightly rates achieved:
- Best-in-class properties (Top 10%) command rates of $193+ per night, often due to premium features or locations.
- Strong performing properties (Top 25%) achieve nightly rates of $145 or more.
- Typical properties (Median) charge around $109 per night.
- Entry-level properties (Bottom 25%) earn around $87 per night.
Average Daily Rate (ADR) Trend by Month in Albenga
Get Live Albenga Market Intelligence 👇

Explore Real-time Analytics
Airbnb Seasonality Analysis & Trends in Albenga (2025)
Peak Season (August, July, June)
- Revenue averages $2,491 per month
- Occupancy rates average 50.8%
- Daily rates average $143
Shoulder Season
- Revenue averages $1,292 per month
- Occupancy maintains around 31.9%
- Daily rates hold near $127
Low Season (January, February, March)
- Revenue drops to average $745 per month
- Occupancy decreases to average 24.0%
- Daily rates adjust to average $121
Seasonality Insights for Albenga
- The Airbnb seasonality in Albenga shows highly seasonal trends requiring careful strategy. While the sections above show seasonal averages, it's also insightful to look at the extremes:
- During the high season, the absolute peak month showcases Albenga's highest earning potential, with monthly revenues capable of climbing to $2,971, occupancy reaching a high of 61.8%, and ADRs peaking at $148.
- Conversely, the slowest single month of the year, typically falling within the low season, marks the market's lowest point. In this month, revenue might dip to $717, occupancy could drop to 22.4%, and ADRs may adjust down to $120.
- Understanding both the seasonal averages and these monthly peaks and troughs in revenue, occupancy, and ADR is crucial for maximizing your Airbnb profit potential in Albenga.
Seasonal Strategies for Maximizing Profit
- Peak Season: Maximize revenue through premium pricing and potentially longer minimum stays. Ensure high availability.
- Low Season: Offer competitive pricing, special promotions (e.g., extended stay discounts), and flexible cancellation policies. Target off-season travelers like remote workers or budget-conscious guests.
- Shoulder Seasons: Implement dynamic pricing that balances peak and low rates. Target weekend travelers or specific events. Offer slightly more flexible terms than peak season.
- Regularly analyze your own performance against these Albenga seasonality benchmarks and adjust your pricing and availability strategy accordingly.
Best Areas for Airbnb Investment in Albenga (2025)
Exploring the top neighborhoods for short-term rentals in Albenga? This section highlights key areas, outlining why they are attractive for hosts and guests, along with notable local attractions. Consider these locations based on your target guest profile and investment strategy.
| Neighborhood / Area | Why Host Here? (Target Guests & Appeal) | Key Attractions & Landmarks |
|---|---|---|
| Centro Storico | The historic center of Albenga, featuring medieval architecture and charming streets. It's a favorite spot for tourists looking to explore the rich history and culture of the region. | Albenga Cathedral, Benedictine Monastery, Roman ruins, Piazza San Michele, Museo Diocesano |
| Lungomare | The seaside promenade of Albenga that offers visitors beautiful views of the coastline and easy access to the beach. A great area for tourists who want to enjoy sun and sea activities. | Albenga Beach, Lungomare di Albenga, Beach clubs, Water sports, Restaurants with sea views |
| Albengola | A residential area that offers peace and quiet while still being within reach of the city center. Ideal for families and long-term visitors looking for a comfortable stay. | Local parks, Quiet neighborhoods, Family-friendly atmosphere, Access to shops and cafes |
| Case Sparse | Scenic countryside surrounding Albenga offers a unique experience for those looking to escape the hustle and bustle of city life. Perfect for nature lovers seeking rural retreats. | Vineyards, Olive groves, Hiking trails, Panoramic views |
| Suviana | A charming suburb of Albenga known for its tranquility and picturesque surroundings. Suitable for visitors seeking a quiet getaway with access to rural beauty. | Local farms, Scenic vistas, Outdoor activities |
| Garlenda | Just a short drive from Albenga, Garlenda is a golfer's paradise with beautiful landscapes and golfing facilities. Attracts golf enthusiasts and those looking for luxury stays. | Garlenda Golf Club, Nature walks, Boutique accommodations |
| Baiardina | Close to the beach but less touristy, Baiardina offers a more authentic Italian experience while still being near the coast. Great for those looking to avoid crowds. | Local eateries, Access to hidden beaches, Relaxed atmosphere |
| Laigueglia | A charming nearby town with stunning beaches and a lively atmosphere. Perfect for tourists who want to explore beyond Albenga but stay close to the coast. | Laigueglia Beach, Charming old town, Seaside restaurants, Cultural festivals |
Understanding Airbnb License Requirements & STR Laws in Albenga (2025)
Yes, Albenga, Liguria, Italy enforces high STR regulations. Obtaining a license and ensuring compliance is almost certainly required according to current 2025 STR laws. Always verify the latest short term rental regulations and Airbnb license requirements directly with local government authorities for Albenga to ensure full compliance before hosting.
(Source: AirROI data, 2025, based on 73% licensed listings)
Top Performing Airbnb Properties in Albenga (2025)
Benchmark your potential! Explore examples of top-performing Airbnb properties in Albengabased on Trailing Twelve Month (TTM) revenue. Analyze their characteristics, revenue, occupancy rate, and ADR to understand what drives success in this market.
![[550 meters from the sea] Relaxing close to everything](https://a0.muscache.com/im/pictures/miso/Hosting-912181225736615262/original/a1edc9e1-b850-453f-a25f-a2b682f58856.png?im_w=480&im_format=avif)
[550 meters from the sea] Relaxing close to everything
Entire Place • 1 bedroom

Gaia intera villa
Entire Place • 4 bedrooms
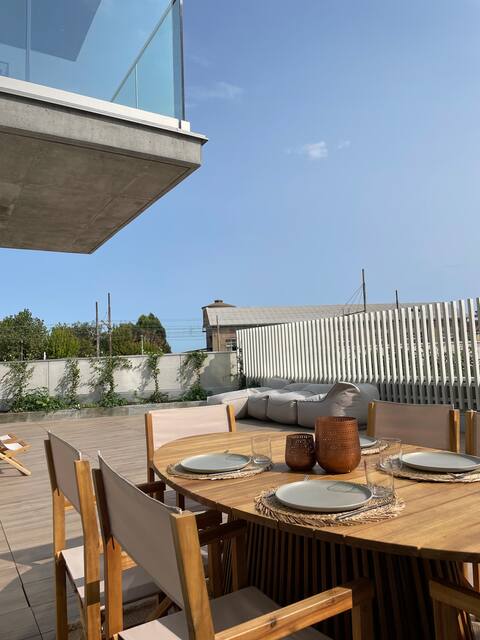
Design and large terrace steps from the sea
Entire Place • 2 bedrooms
Casa Tiziana with reserved parking
Entire Place • 2 bedrooms

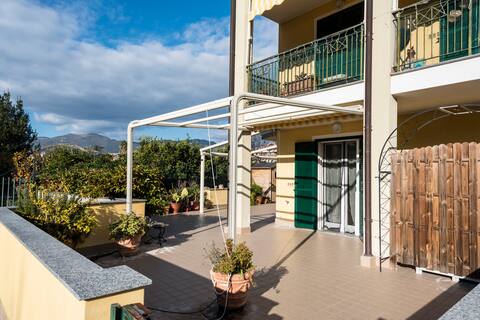
New apartment with balcony and garage included
Entire Place • 2 bedrooms

Casa Olivia - sea view apartment
Entire Place • 2 bedrooms
Note: Performance varies based on location, size, amenities, seasonality, and management quality. Data reflects the past 12 months.
Top Performing Airbnb Hosts in Albenga (2025)
Learn from the best! This table showcases top-performing Airbnb hosts in Albenga based on the number of properties managed and estimated total revenue over the past year. Analyze their scale and performance metrics.
| Host Name | Properties | Grossing Revenue | Stay Reviews | Avg Rating |
|---|---|---|---|---|
| Appartamento Gaia | 3 | $72,783 | 52 | 4.85/5.0 |
| Andrea | 1 | $57,160 | 9 | 3.89/5.0 |
| Stefano | 3 | $56,136 | 204 | 4.70/5.0 |
| Sabia Estate | 2 | $49,559 | 8 | 4.75/5.0 |
| Francesca | 3 | $49,278 | 122 | 4.90/5.0 |
| Margherita | 2 | $45,644 | 263 | 4.84/5.0 |
| Ingaunia | 4 | $42,094 | 13 | 2.47/5.0 |
| Elena | 1 | $40,109 | 17 | 4.94/5.0 |
| Impresa | 3 | $38,256 | 128 | 4.55/5.0 |
| Federica | 1 | $36,023 | 10 | 4.90/5.0 |
Analyzing the strategies of top hosts, such as their property selection, pricing, and guest communication, can offer valuable lessons for optimizing your own Airbnb operations in Albenga.
Dive Deeper: Advanced Albenga STR Market Data (2025)
Ready to unlock more insights? AirROI provides access to advanced metrics and comprehensive Airbnb data for Albenga. Explore detailed analytics beyond this report to refine your investment strategy, optimize pricing, and maximize your vacation rental profits.
Explore Advanced MetricsAlbenga Short-Term Rental Market Composition (2025): Property & Room Types
Room Type Distribution
Property Type Distribution
Market Composition Insights for Albenga
- The Albenga Airbnb market composition is heavily skewed towards Entire Home/Apt listings, which make up 85.2% of the 142 active rentals. This indicates strong guest preference for privacy and space.
- Looking at the property type distribution in Albenga, Apartment/Condo properties are the most common (79.6%), reflecting the local real estate landscape.
- Smaller segments like hotel/boutique, others, outdoor/unique (combined 6.3%) offer potential for unique stay experiences.
Albenga Airbnb Room Capacity Analysis (2025): Bedroom Distribution
Distribution of Listings by Number of Bedrooms
Room Capacity Insights for Albenga
- The dominant room capacity in Albenga is 1 bedroom listings, making up 43.7% of the market. This suggests a strong demand for properties suitable for couples or solo travelers.
- Together, 1 bedroom and 2 bedrooms properties represent 83.1% of the active Airbnb listings in Albenga, indicating a high concentration in these sizes.
- Listings with 3+ bedrooms (9.1%) represent a smaller niche, potentially indicating an underserved market for larger group accommodations in Albenga.
Albenga Vacation Rental Guest Capacity Trends (2025)
Distribution of Listings by Guest Capacity
Guest Capacity Insights for Albenga
- The most common guest capacity trend in Albenga vacation rentals is listings accommodating 4 guests (39.4%). This suggests the primary traveler segment is likely small families or groups.
- Properties designed for 4 guests and 6 guests dominate the Albenga STR market, accounting for 58.4% of listings.
- 26.7% of properties accommodate 6+ guests, serving the market segment for larger families or group travel in Albenga.
- On average, properties in Albenga are equipped to host 4.2 guests.
Albenga Airbnb Booking Patterns (2025): Available vs. Booked Days
Available Days Distribution
Booked Days Distribution
Booking Pattern Insights for Albenga
- The most common availability pattern in Albenga falls within the 271-366 days range, representing 54.9% of listings. This suggests many properties have significant open periods on their calendars.
- Approximately 87.3% of listings show high availability (181+ days open annually), indicating potential for increased bookings or specific owner usage patterns.
- For booked days, the 31-90 days range is most frequent in Albenga (35.9%), reflecting common guest stay durations or potential owner blocking patterns.
- A notable 13.4% of properties secure long booking periods (181+ days booked per year), highlighting successful long-term rental strategies or significant owner usage.
Albenga Airbnb Minimum Stay Requirements Analysis
Distribution of Listings by Minimum Night Requirement
1 Night
35 listings
25.9% of total
2 Nights
45 listings
33.3% of total
3 Nights
9 listings
6.7% of total
4-6 Nights
13 listings
9.6% of total
7-29 Nights
13 listings
9.6% of total
30+ Nights
20 listings
14.8% of total
Key Insights
- The most prevalent minimum stay requirement in Albenga is 2 Nights, adopted by 33.3% of listings. This highlights the market's preference for shorter, flexible bookings.
- A significant segment (14.8%) caters to monthly stays (30+ nights) in Albenga, pointing to opportunities in the extended-stay market.
Recommendations
- Align with the market by considering a 2 Nights minimum stay, as 33.3% of Albenga hosts use this setting.
- If feasible, allowing 1-night stays, especially midweek or during low season, could capture last-minute bookings, as only 25.9% currently do.
- Explore offering discounts for stays of 30+ nights to attract the 14.8% of the market seeking extended stays.
- Adjust minimum nights based on seasonality – potentially shorter during low season and longer during peak demand periods in Albenga.
Albenga Airbnb Cancellation Policy Trends Analysis (2025)
Super Strict 30 Days
3 listings
2.5% of total
Super Strict 60 Days
5 listings
4.2% of total
Flexible
21 listings
17.6% of total
Moderate
67 listings
56.3% of total
Strict
23 listings
19.3% of total
Cancellation Policy Insights for Albenga
- The prevailing Airbnb cancellation policy trend in Albenga is Moderate, used by 56.3% of listings.
- The market strongly favors guest-friendly terms, with 73.9% of listings offering Flexible or Moderate policies. This suggests guests in Albenga may expect booking flexibility.
Recommendations for Hosts
- Consider adopting a Moderate policy to align with the 56.3% market standard in Albenga.
- Regularly review your cancellation policy against competitors and market demand shifts in Albenga.
Albenga STR Booking Lead Time Analysis (2025)
Average Booking Lead Time by Month
Booking Lead Time Insights for Albenga
- The overall average booking lead time for vacation rentals in Albenga is 49 days.
- Guests book furthest in advance for stays during July (average 84 days), likely coinciding with peak travel demand or local events.
- The shortest booking windows occur for stays in November (average 19 days), indicating more last-minute travel plans during this time.
- Seasonally, Summer (75 days avg.) sees the longest lead times, while Winter (30 days avg.) has the shortest, reflecting typical travel planning cycles.
Recommendations for Hosts
- Use the overall average lead time (49 days) as a baseline for your pricing and availability strategy in Albenga.
- For July stays, consider implementing length-of-stay discounts or slightly higher rates for bookings made less than 84 days out to capitalize on advance planning.
- Target marketing efforts for the Summer season well in advance (at least 75 days) to capture early planners.
- Monitor your own booking lead times against these Albenga averages to identify opportunities for dynamic pricing adjustments.
Popular & Essential Airbnb Amenities in Albenga (2025)
Amenity Prevalence
Amenity Insights for Albenga
- Essential amenities in Albenga that guests expect include: TV, Heating. Lacking these (any) could significantly impact bookings.
- Popular amenities like Kitchen, Hot water, Hair dryer are common but not universal. Offering these can provide a competitive edge.
- Warning: Wifi is not universally provided but is considered essential globally. Ensure reliable Wifi is offered.
Recommendations for Hosts
- Ensure your listing includes all essential amenities for Albenga: TV, Heating.
- Prioritize adding missing essentials: TV, Heating.
- Consider adding popular differentiators like Kitchen or Hot water to increase appeal.
- Highlight unique or less common amenities you offer (e.g., hot tub, dedicated workspace, EV charger) in your listing description and photos.
- Regularly check competitor amenities in Albenga to stay competitive.
Albenga Airbnb Guest Demographics & Profile Analysis (2025)
Guest Profile Summary for Albenga
- The typical guest profile for Airbnb in Albenga consists of a mix of domestic (51%) and international guests, often arriving from nearby Turin, typically belonging to the Post-2000s (Gen Z/Alpha) group (50%), primarily speaking English or Italian.
- Domestic travelers account for 51.4% of guests.
- Key international markets include Italy (51.4%) and France (13.7%).
- Top languages spoken are English (34.1%) followed by Italian (23.5%).
- A significant demographic segment is the Post-2000s (Gen Z/Alpha) group, representing 50% of guests.
Recommendations for Hosts
- Balance marketing efforts between domestic and international channels based on the guest mix.
- Tailor amenities and listing descriptions to appeal to the dominant Post-2000s (Gen Z/Alpha) demographic (e.g., highlight fast WiFi, smart home features, local guides).
- Highlight unique local experiences or amenities relevant to the primary guest profile.
- Consider seasonal promotions aligned with peak travel times for key origin markets.
Nearby Short-Term Rental Market Comparison
How does the Albenga Airbnb market stack up against its neighbors? Compare key performance metrics like average monthly revenue, ADR, and occupancy rates in surrounding areas to understand the broader regional STR landscape.
| Market | Active Properties | Monthly Revenue | Daily Rate | Avg. Occupancy |
|---|---|---|---|---|
| Laglio | 64 | $4,873 | $463.61 | 47% |
| Monteu Roero | 16 | $4,432 | $540.14 | 36% |
| Portofino | 68 | $4,086 | $454.35 | 44% |
| Saint-Jean-Cap-Ferrat | 107 | $3,844 | $424.21 | 46% |
| Sala Comacina | 64 | $3,794 | $400.27 | 50% |
| Cossano Belbo | 13 | $3,632 | $284.21 | 42% |
| Bellagio | 373 | $3,630 | $328.26 | 55% |
| Oliveto Lario | 99 | $3,509 | $327.42 | 55% |
| Carate Urio | 71 | $3,379 | $331.90 | 44% |
| Brienno | 39 | $3,327 | $337.92 | 45% |