Terracina Airbnb Market Analysis 2025: Short Term Rental Data & Vacation Rental Statistics in Lazio, Italy
Is Airbnb profitable in Terracina in 2025? Explore comprehensive Airbnb analytics for Terracina, Lazio, Italy to uncover income potential. This 2025 STR market report for Terracina, based on AirROI data from April 2024 to March 2025, reveals key trends in the market of 313 active listings.
Whether you're considering an Airbnb investment in Terracina, optimizing your existing vacation rental, or exploring rental arbitrage opportunities, understanding the Terracina Airbnb data is crucial. Navigating the high regulation landscape is key to maximizing your short term rental income potential. Let's dive into the specifics.
Key Terracina Airbnb Performance Metrics Overview
Monthly Airbnb Revenue Variations & Income Potential in Terracina (2025)
Understanding the monthly revenue variations for Airbnb listings in Terracina is key to maximizing your short term rental income potential. Seasonality significantly impacts earnings. Our analysis, based on data from the past 12 months, shows that the peak revenue month for STRs in Terracina is typically August, while February often presents the lowest earnings, highlighting opportunities for strategic pricing adjustments during shoulder and low seasons. Explore the typical Airbnb income in Terracina across different performance tiers:
- Best-in-class properties (Top 10%) achieve $3,152+ monthly, often utilizing dynamic pricing and superior guest experiences.
- Strong performing properties (Top 25%) earn $1,985 or more, indicating effective management and desirable locations/amenities.
- Typical properties (Median) generate around $1,066 per month, representing the average market performance.
- Entry-level properties (Bottom 25%) see earnings around $461, often with potential for optimization.
Average Monthly Airbnb Earnings Trend in Terracina
Terracina Airbnb Occupancy Rate Trends (2025)
Maximize your bookings by understanding the Terracina STR occupancy trends. Seasonal demand shifts significantly influence how often properties are booked. Typically, Augustsees the highest demand (peak season occupancy), while January experiences the lowest (low season). Effective strategies, like adjusting minimum stays or offering promotions, can boost occupancy during slower periods. Here's how different property tiers perform in Terracina:
- Best-in-class properties (Top 10%) achieve 59%+ occupancy, indicating high desirability and potentially optimized availability.
- Strong performing properties (Top 25%) maintain 43% or higher occupancy, suggesting good market fit and guest satisfaction.
- Typical properties (Median) have an occupancy rate around 25%.
- Entry-level properties (Bottom 25%) average 11% occupancy, potentially facing higher vacancy.
Average Monthly Occupancy Rate Trend in Terracina
Average Daily Rate (ADR) Airbnb Trends in Terracina (2025)
Effective short term rental pricing strategy in Terracina involves understanding monthly ADR fluctuations. The Average Daily Rate (ADR) for Airbnb in Terracina typically peaks in August and dips lowest during March. Leveraging Airbnb dynamic pricing tools or strategies based on this seasonality can significantly boost revenue. Here's a look at the typical nightly rates achieved:
- Best-in-class properties (Top 10%) command rates of $240+ per night, often due to premium features or locations.
- Strong performing properties (Top 25%) achieve nightly rates of $172 or more.
- Typical properties (Median) charge around $124 per night.
- Entry-level properties (Bottom 25%) earn around $96 per night.
Average Daily Rate (ADR) Trend by Month in Terracina
Get Live Terracina Market Intelligence 👇

Explore Real-time Analytics
Airbnb Seasonality Analysis & Trends in Terracina (2025)
Peak Season (August, July, June)
- Revenue averages $2,673 per month
- Occupancy rates average 46.2%
- Daily rates average $164
Shoulder Season
- Revenue averages $1,205 per month
- Occupancy maintains around 25.5%
- Daily rates hold near $146
Low Season (January, February, March)
- Revenue drops to average $617 per month
- Occupancy decreases to average 19.5%
- Daily rates adjust to average $136
Seasonality Insights for Terracina
- The Airbnb seasonality in Terracina shows highly seasonal trends requiring careful strategy. While the sections above show seasonal averages, it's also insightful to look at the extremes:
- During the high season, the absolute peak month showcases Terracina's highest earning potential, with monthly revenues capable of climbing to $3,281, occupancy reaching a high of 58.7%, and ADRs peaking at $168.
- Conversely, the slowest single month of the year, typically falling within the low season, marks the market's lowest point. In this month, revenue might dip to $575, occupancy could drop to 17.1%, and ADRs may adjust down to $135.
- Understanding both the seasonal averages and these monthly peaks and troughs in revenue, occupancy, and ADR is crucial for maximizing your Airbnb profit potential in Terracina.
Seasonal Strategies for Maximizing Profit
- Peak Season: Maximize revenue through premium pricing and potentially longer minimum stays. Ensure high availability.
- Low Season: Offer competitive pricing, special promotions (e.g., extended stay discounts), and flexible cancellation policies. Target off-season travelers like remote workers or budget-conscious guests.
- Shoulder Seasons: Implement dynamic pricing that balances peak and low rates. Target weekend travelers or specific events. Offer slightly more flexible terms than peak season.
- Regularly analyze your own performance against these Terracina seasonality benchmarks and adjust your pricing and availability strategy accordingly.
Best Areas for Airbnb Investment in Terracina (2025)
Exploring the top neighborhoods for short-term rentals in Terracina? This section highlights key areas, outlining why they are attractive for hosts and guests, along with notable local attractions. Consider these locations based on your target guest profile and investment strategy.
| Neighborhood / Area | Why Host Here? (Target Guests & Appeal) | Key Attractions & Landmarks |
|---|---|---|
| Terracina Centro | The historic center of Terracina, known for its medieval architecture and charming streets. A perfect location for tourists looking to explore local culture and history. | Temple of Jupiter Anxur, Piazza del Comune, Roman Forum, Cathedral of Saint Cesare, Ancient Walls |
| Terracina Beach | A popular beach destination with a long sandy coastline. Ideal for visitors wanting to enjoy sunbathing, swimming and water sports. | Terracina Beach, Lido di Ulisse, Beachfront restaurants, Water sports centers, Sunset views |
| San Felice Circeo | This nature reserve offers stunning views and outdoor activities such as hiking and beach access. Attracts nature lovers and hikers. | Circeo National Park, Capo Circeo, La Caletta Beach, Hiking trails, Scenic viewpoints |
| Lago di Fondi | A tranquil lake area perfect for fishing, picnics, and enjoying nature. Great for families and those wanting a peaceful retreat. | Fondi Lake, Fishing spots, Nature trails, Picnic areas, Bird watching |
| Monte San Biagio | A small town offering historical sights and beautiful landscapes. Great for tourists interested in exploring lesser-known parts of Lazio. | Castle of San Biagio, Panoramic views, Countryside trails, Local markets, Historic churches |
| Punta Rossa | A more secluded beach area known for its natural beauty, ideal for visitors seeking a quieter experience away from the more crowded tourist spots. | Hidden beaches, Scenic trails, Diving spots, Nature walks, Secluded restaurants |
| Porto Badino | A small port area with beautiful views and a relaxing atmosphere. Great for water sports and enjoying fresh seafood. | Badino Port, Boat rentals, Seafood restaurants, Relaxing beaches, Water activities |
| Riviera di Ulisse National Park | A national park that includes stunning coastal landscapes, hiking opportunities, and a variety of wildlife. Perfect for outdoor enthusiasts. | Hiking trails, Diverse wildlife, Beach coves, Panoramic views, Historical ruins |
Understanding Airbnb License Requirements & STR Laws in Terracina (2025)
Yes, Terracina, Lazio, Italy enforces high STR regulations. Obtaining a license and ensuring compliance is almost certainly required according to current 2025 STR laws. Always verify the latest short term rental regulations and Airbnb license requirements directly with local government authorities for Terracina to ensure full compliance before hosting.
(Source: AirROI data, 2025, based on 37% licensed listings)
Top Performing Airbnb Properties in Terracina (2025)
Benchmark your potential! Explore examples of top-performing Airbnb properties in Terracinabased on Trailing Twelve Month (TTM) revenue. Analyze their characteristics, revenue, occupancy rate, and ADR to understand what drives success in this market.
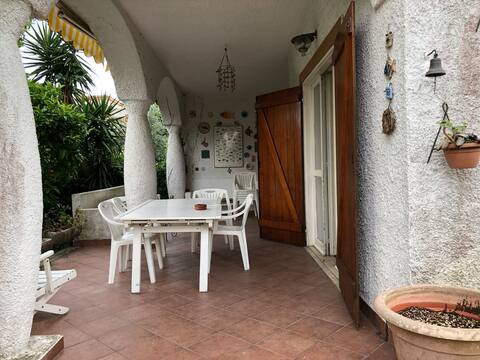
Villa area pvt Circeo, sea a few meters away
Entire Place • 5 bedrooms
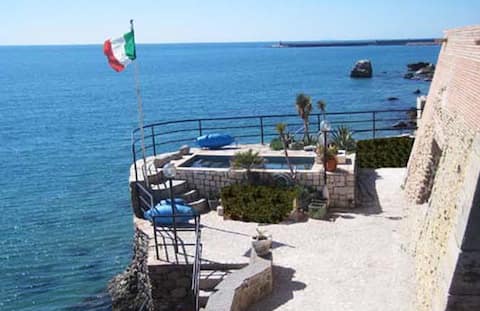
Seawatch Tower - with private access to the sea
Entire Place • 1 bedroom

InClanto Beach House
Entire Place • 2 bedrooms

Beachfront Charm
Entire Place • 4 bedrooms

Sea View Paradise: 2-Bed Coastal Retreat
Entire Place • 2 bedrooms
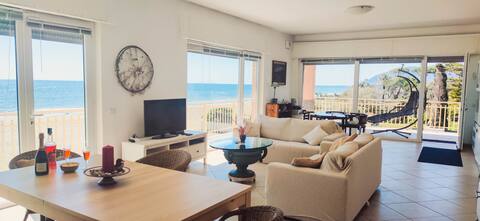
Casa Fronte Mare in Terracina
Entire Place • 4 bedrooms
Note: Performance varies based on location, size, amenities, seasonality, and management quality. Data reflects the past 12 months.
Top Performing Airbnb Hosts in Terracina (2025)
Learn from the best! This table showcases top-performing Airbnb hosts in Terracina based on the number of properties managed and estimated total revenue over the past year. Analyze their scale and performance metrics.
| Host Name | Properties | Grossing Revenue | Stay Reviews | Avg Rating |
|---|---|---|---|---|
| Pino | 5 | $65,901 | 32 | 3.95/5.0 |
| Stefano | 2 | $62,012 | 15 | 5.00/5.0 |
| Costantino | 2 | $52,133 | 110 | 4.79/5.0 |
| Giordano | 2 | $50,949 | 30 | 4.98/5.0 |
| Roberto | 1 | $45,288 | 6 | 5.00/5.0 |
| Giustino | 1 | $45,049 | 31 | 5.00/5.0 |
| Antonio | 3 | $45,006 | 15 | 3.33/5.0 |
| Claudio | 1 | $44,227 | 17 | 4.94/5.0 |
| Federica | 1 | $42,867 | 5 | 4.00/5.0 |
| Host #454523151 | 8 | $42,825 | 0 | 0.00/5.0 |
Analyzing the strategies of top hosts, such as their property selection, pricing, and guest communication, can offer valuable lessons for optimizing your own Airbnb operations in Terracina.
Dive Deeper: Advanced Terracina STR Market Data (2025)
Ready to unlock more insights? AirROI provides access to advanced metrics and comprehensive Airbnb data for Terracina. Explore detailed analytics beyond this report to refine your investment strategy, optimize pricing, and maximize your vacation rental profits.
Explore Advanced MetricsTerracina Short-Term Rental Market Composition (2025): Property & Room Types
Room Type Distribution
Property Type Distribution
Market Composition Insights for Terracina
- The Terracina Airbnb market composition is heavily skewed towards Entire Home/Apt listings, which make up 94.6% of the 313 active rentals. This indicates strong guest preference for privacy and space.
- Looking at the property type distribution in Terracina, Apartment/Condo properties are the most common (55.9%), reflecting the local real estate landscape.
- Houses represent a significant 39.9% portion, catering likely to families or larger groups.
- Smaller segments like hotel/boutique, others, outdoor/unique (combined 4.1%) offer potential for unique stay experiences.
Terracina Airbnb Room Capacity Analysis (2025): Bedroom Distribution
Distribution of Listings by Number of Bedrooms
Room Capacity Insights for Terracina
- The dominant room capacity in Terracina is 2 bedrooms listings, making up 38% of the market. This suggests a strong demand for properties suitable for couples or solo travelers.
- Together, 2 bedrooms and 1 bedroom properties represent 74.4% of the active Airbnb listings in Terracina, indicating a high concentration in these sizes.
- A significant 22.9% of listings offer 3+ bedrooms, catering to larger groups and families seeking more space in Terracina.
Terracina Vacation Rental Guest Capacity Trends (2025)
Distribution of Listings by Guest Capacity
Guest Capacity Insights for Terracina
- The most common guest capacity trend in Terracina vacation rentals is listings accommodating 4 guests (34.2%). This suggests the primary traveler segment is likely small families or groups.
- Properties designed for 4 guests and 6 guests dominate the Terracina STR market, accounting for 52.7% of listings.
- 32.2% of properties accommodate 6+ guests, serving the market segment for larger families or group travel in Terracina.
- On average, properties in Terracina are equipped to host 4.7 guests.
Terracina Airbnb Booking Patterns (2025): Available vs. Booked Days
Available Days Distribution
Booked Days Distribution
Booking Pattern Insights for Terracina
- The most common availability pattern in Terracina falls within the 271-366 days range, representing 74.8% of listings. This suggests many properties have significant open periods on their calendars.
- Approximately 96.8% of listings show high availability (181+ days open annually), indicating potential for increased bookings or specific owner usage patterns.
- For booked days, the 31-90 days range is most frequent in Terracina (40.9%), reflecting common guest stay durations or potential owner blocking patterns.
- A notable 3.2% of properties secure long booking periods (181+ days booked per year), highlighting successful long-term rental strategies or significant owner usage.
Terracina Airbnb Minimum Stay Requirements Analysis
Distribution of Listings by Minimum Night Requirement
1 Night
49 listings
17.1% of total
2 Nights
63 listings
22% of total
3 Nights
41 listings
14.3% of total
4-6 Nights
43 listings
15% of total
7-29 Nights
79 listings
27.6% of total
30+ Nights
11 listings
3.8% of total
Key Insights
- The most prevalent minimum stay requirement in Terracina is 7-29 Nights, adopted by 27.6% of listings. This highlights the market's preference for shorter, flexible bookings.
Recommendations
- Align with the market by considering a 7-29 Nights minimum stay, as 27.6% of Terracina hosts use this setting.
- If feasible, allowing 1-night stays, especially midweek or during low season, could capture last-minute bookings, as only 17.1% currently do.
- Adjust minimum nights based on seasonality – potentially shorter during low season and longer during peak demand periods in Terracina.
Terracina Airbnb Cancellation Policy Trends Analysis (2025)
Super Strict 60 Days
2 listings
0.9% of total
Super Strict 30 Days
1 listings
0.5% of total
Flexible
43 listings
20% of total
Moderate
97 listings
45.1% of total
Strict
72 listings
33.5% of total
Cancellation Policy Insights for Terracina
- The prevailing Airbnb cancellation policy trend in Terracina is Moderate, used by 45.1% of listings.
- There's a relatively balanced mix between guest-friendly (65.1%) and stricter (33.5%) policies, offering choices for different guest needs.
Recommendations for Hosts
- Consider adopting a Moderate policy to align with the 45.1% market standard in Terracina.
- With 33.5% using Strict terms, this is a viable option in Terracina, particularly for high-value properties or during peak demand periods.
- Regularly review your cancellation policy against competitors and market demand shifts in Terracina.
Terracina STR Booking Lead Time Analysis (2025)
Average Booking Lead Time by Month
Booking Lead Time Insights for Terracina
- The overall average booking lead time for vacation rentals in Terracina is 55 days.
- Guests book furthest in advance for stays during July (average 81 days), likely coinciding with peak travel demand or local events.
- The shortest booking windows occur for stays in February (average 19 days), indicating more last-minute travel plans during this time.
- Seasonally, Summer (72 days avg.) sees the longest lead times, while Winter (32 days avg.) has the shortest, reflecting typical travel planning cycles.
Recommendations for Hosts
- Use the overall average lead time (55 days) as a baseline for your pricing and availability strategy in Terracina.
- For July stays, consider implementing length-of-stay discounts or slightly higher rates for bookings made less than 81 days out to capitalize on advance planning.
- Target marketing efforts for the Summer season well in advance (at least 72 days) to capture early planners.
- Monitor your own booking lead times against these Terracina averages to identify opportunities for dynamic pricing adjustments.
Popular & Essential Airbnb Amenities in Terracina (2025)
Amenity Prevalence
Amenity Insights for Terracina
- Essential amenities in Terracina that guests expect include: Kitchen. Lacking these (this) could significantly impact bookings.
- Popular amenities like TV, Hot water, Washer are common but not universal. Offering these can provide a competitive edge.
- Warning: Wifi is not universally provided but is considered essential globally. Ensure reliable Wifi is offered.
Recommendations for Hosts
- Ensure your listing includes all essential amenities for Terracina: Kitchen.
- Prioritize adding missing essentials: Kitchen.
- Consider adding popular differentiators like TV or Hot water to increase appeal.
- Highlight unique or less common amenities you offer (e.g., hot tub, dedicated workspace, EV charger) in your listing description and photos.
- Regularly check competitor amenities in Terracina to stay competitive.
Terracina Airbnb Guest Demographics & Profile Analysis (2025)
Guest Profile Summary for Terracina
- The typical guest profile for Airbnb in Terracina consists of a mix of domestic (49%) and international guests, with top international origins including Germany, typically belonging to the Post-2000s (Gen Z/Alpha) group (50%), primarily speaking English or Italian.
- Domestic travelers account for 48.9% of guests.
- Key international markets include Italy (48.9%) and Germany (9.3%).
- Top languages spoken are English (38.5%) followed by Italian (22.1%).
- A significant demographic segment is the Post-2000s (Gen Z/Alpha) group, representing 50% of guests.
Recommendations for Hosts
- Balance marketing efforts between domestic and international channels based on the guest mix.
- Tailor amenities and listing descriptions to appeal to the dominant Post-2000s (Gen Z/Alpha) demographic (e.g., highlight fast WiFi, smart home features, local guides).
- Highlight unique local experiences or amenities relevant to the primary guest profile.
- Consider seasonal promotions aligned with peak travel times for key origin markets.
Nearby Short-Term Rental Market Comparison
How does the Terracina Airbnb market stack up against its neighbors? Compare key performance metrics like average monthly revenue, ADR, and occupancy rates in surrounding areas to understand the broader regional STR landscape.
| Market | Active Properties | Monthly Revenue | Daily Rate | Avg. Occupancy |
|---|---|---|---|---|
| Positano | 683 | $6,671 | $624.23 | 53% |
| Praiano | 331 | $4,415 | $403.56 | 55% |
| Conca dei Marini | 112 | $4,308 | $395.84 | 53% |
| Capri | 423 | $3,942 | $586.54 | 41% |
| Sorrento | 1,475 | $3,702 | $325.69 | 50% |
| Amalfi | 463 | $3,284 | $317.75 | 48% |
| Massa Lubrense | 832 | $3,255 | $413.33 | 45% |
| Ravello | 261 | $3,201 | $317.16 | 47% |
| Furore | 141 | $3,098 | $340.51 | 51% |
| Rome | 23,290 | $2,898 | $208.87 | 51% |