Nepi Airbnb Market Analysis 2025: Short Term Rental Data & Vacation Rental Statistics in Lazio, Italy
Is Airbnb profitable in Nepi in 2025? Explore comprehensive Airbnb analytics for Nepi, Lazio, Italy to uncover income potential. This 2025 STR market report for Nepi, based on AirROI data from April 2024 to March 2025, reveals key trends in the niche market of 29 active listings.
Whether you're considering an Airbnb investment in Nepi, optimizing your existing vacation rental, or exploring rental arbitrage opportunities, understanding the Nepi Airbnb data is crucial. Navigating the high regulation landscape is key to maximizing your short term rental income potential. Let's dive into the specifics.
Key Nepi Airbnb Performance Metrics Overview
Monthly Airbnb Revenue Variations & Income Potential in Nepi (2025)
Understanding the monthly revenue variations for Airbnb listings in Nepi is key to maximizing your short term rental income potential. Seasonality significantly impacts earnings. Our analysis, based on data from the past 12 months, shows that the peak revenue month for STRs in Nepi is typically July, while January often presents the lowest earnings, highlighting opportunities for strategic pricing adjustments during shoulder and low seasons. Explore the typical Airbnb income in Nepi across different performance tiers:
- Best-in-class properties (Top 10%) achieve $2,742+ monthly, often utilizing dynamic pricing and superior guest experiences.
- Strong performing properties (Top 25%) earn $1,654 or more, indicating effective management and desirable locations/amenities.
- Typical properties (Median) generate around $867 per month, representing the average market performance.
- Entry-level properties (Bottom 25%) see earnings around $442, often with potential for optimization.
Average Monthly Airbnb Earnings Trend in Nepi
Nepi Airbnb Occupancy Rate Trends (2025)
Maximize your bookings by understanding the Nepi STR occupancy trends. Seasonal demand shifts significantly influence how often properties are booked. Typically, Augustsees the highest demand (peak season occupancy), while January experiences the lowest (low season). Effective strategies, like adjusting minimum stays or offering promotions, can boost occupancy during slower periods. Here's how different property tiers perform in Nepi:
- Best-in-class properties (Top 10%) achieve 60%+ occupancy, indicating high desirability and potentially optimized availability.
- Strong performing properties (Top 25%) maintain 43% or higher occupancy, suggesting good market fit and guest satisfaction.
- Typical properties (Median) have an occupancy rate around 25%.
- Entry-level properties (Bottom 25%) average 14% occupancy, potentially facing higher vacancy.
Average Monthly Occupancy Rate Trend in Nepi
Average Daily Rate (ADR) Airbnb Trends in Nepi (2025)
Effective short term rental pricing strategy in Nepi involves understanding monthly ADR fluctuations. The Average Daily Rate (ADR) for Airbnb in Nepi typically peaks in August and dips lowest during March. Leveraging Airbnb dynamic pricing tools or strategies based on this seasonality can significantly boost revenue. Here's a look at the typical nightly rates achieved:
- Best-in-class properties (Top 10%) command rates of $316+ per night, often due to premium features or locations.
- Strong performing properties (Top 25%) achieve nightly rates of $179 or more.
- Typical properties (Median) charge around $93 per night.
- Entry-level properties (Bottom 25%) earn around $66 per night.
Average Daily Rate (ADR) Trend by Month in Nepi
Get Live Nepi Market Intelligence 👇

Explore Real-time Analytics
Airbnb Seasonality Analysis & Trends in Nepi (2025)
Peak Season (July, August, May)
- Revenue averages $2,415 per month
- Occupancy rates average 44.3%
- Daily rates average $152
Shoulder Season
- Revenue averages $1,144 per month
- Occupancy maintains around 29.4%
- Daily rates hold near $143
Low Season (January, March, October)
- Revenue drops to average $581 per month
- Occupancy decreases to average 19.6%
- Daily rates adjust to average $139
Seasonality Insights for Nepi
- The Airbnb seasonality in Nepi shows highly seasonal trends requiring careful strategy. While the sections above show seasonal averages, it's also insightful to look at the extremes:
- During the high season, the absolute peak month showcases Nepi's highest earning potential, with monthly revenues capable of climbing to $2,789, occupancy reaching a high of 50.9%, and ADRs peaking at $155.
- Conversely, the slowest single month of the year, typically falling within the low season, marks the market's lowest point. In this month, revenue might dip to $520, occupancy could drop to 17.9%, and ADRs may adjust down to $131.
- Understanding both the seasonal averages and these monthly peaks and troughs in revenue, occupancy, and ADR is crucial for maximizing your Airbnb profit potential in Nepi.
Seasonal Strategies for Maximizing Profit
- Peak Season: Maximize revenue through premium pricing and potentially longer minimum stays. Ensure high availability.
- Low Season: Offer competitive pricing, special promotions (e.g., extended stay discounts), and flexible cancellation policies. Target off-season travelers like remote workers or budget-conscious guests.
- Shoulder Seasons: Implement dynamic pricing that balances peak and low rates. Target weekend travelers or specific events. Offer slightly more flexible terms than peak season.
- Regularly analyze your own performance against these Nepi seasonality benchmarks and adjust your pricing and availability strategy accordingly.
Best Areas for Airbnb Investment in Nepi (2025)
Exploring the top neighborhoods for short-term rentals in Nepi? This section highlights key areas, outlining why they are attractive for hosts and guests, along with notable local attractions. Consider these locations based on your target guest profile and investment strategy.
| Neighborhood / Area | Why Host Here? (Target Guests & Appeal) | Key Attractions & Landmarks |
|---|---|---|
| Historic Center of Nepi | Charming medieval town with rich history and beautiful architecture, attracting tourists interested in culture and heritage. | Nepi Cathedral, Castle of Nepi, Museo del Palazzo dei Papi, Piazza del Comune, Acquedotto di Nepi |
| Nepi Countryside | Idyllic rural area offering scenic views and tranquility, popular for those seeking a relaxing getaway in nature. | Vineyards and wineries, Nature walks, Local farms, Olive groves, Hiking trails |
| Civita Castellana | Nearby historical town known for its pottery and Etruscan history, a great day trip option for tourists. | Civita Castellana Cathedral, Etruscan ruins, Pottery workshops, Basilica di Santa Maria Maggiore, Scenic views of the Tiber River |
| Lake Vico | A beautiful lakeside area perfect for outdoor activities, attracting visitors looking for adventure and relaxation. | Lake Vico Nature Park, Water sports, Picnic areas, Hiking trails, Fishing spots |
| Bracciano Lake | Popular lake destination with picturesque views and numerous recreational activities, appealing to both locals and tourists. | Bracciano Castle, Water activities, Hiking around the lake, Restaurants with lake views, Camping sites |
| Tuscia Region | A historical and culturally rich area surrounding Nepi, attractive for tourists interested in exploring ancient Etruscan sites. | Tarquinia Etruscan Necropolis, Viterbo's medieval city, Civita di Bagnoregio, Bagnaia Gardens, Santa Rita da Cascia Sanctuary |
| Nepi Market | Vibrant area known for its local market and shopping, popular with visitors looking for authentic experiences and local products. | Weekly market, Local artisan shops, Food stalls, Cafés and restaurants, Cultural events |
| Nepi Festivals | The town hosts various festivals throughout the year, creating a lively atmosphere and attracting numerous visitors. | Annual Historical Parade, Festivals of wine and food, Art exhibitions, Music events, Cultural celebrations |
Understanding Airbnb License Requirements & STR Laws in Nepi (2025)
Yes, Nepi, Lazio, Italy enforces high STR regulations. Obtaining a license and ensuring compliance is almost certainly required according to current 2025 STR laws. Always verify the latest short term rental regulations and Airbnb license requirements directly with local government authorities for Nepi to ensure full compliance before hosting.
(Source: AirROI data, 2025, based on 59% licensed listings)
Top Performing Airbnb Properties in Nepi (2025)
Benchmark your potential! Explore examples of top-performing Airbnb properties in Nepibased on Trailing Twelve Month (TTM) revenue. Analyze their characteristics, revenue, occupancy rate, and ADR to understand what drives success in this market.
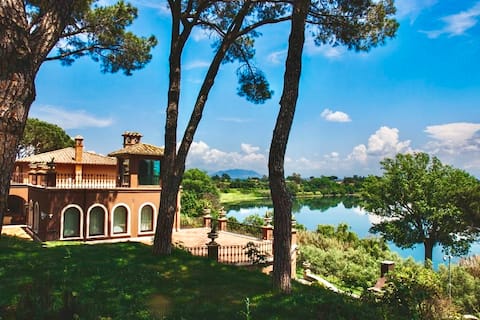
Rome (NEPI) Villa Elda at the gates of Rome
Entire Place • 4 bedrooms
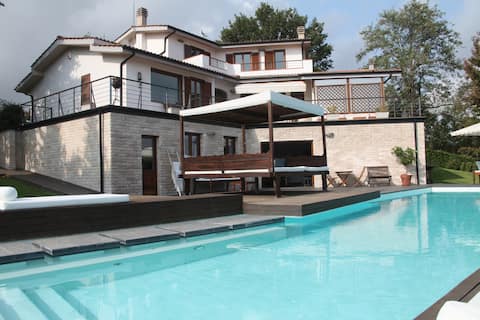
Villa Coccinella
Entire Place • 4 bedrooms
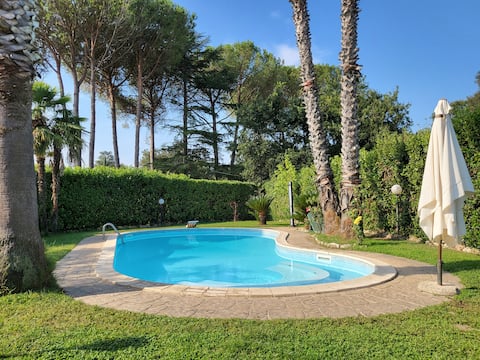
Villa con piscina privata zona Cassia Veientana
Entire Place • 3 bedrooms
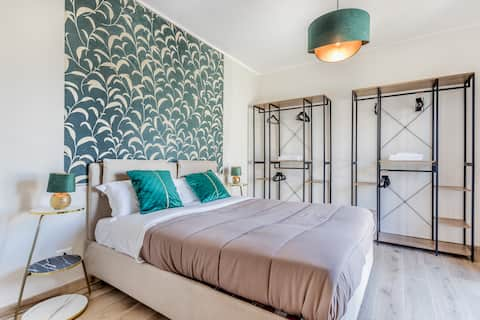
Nepi green apartment
Entire Place • 2 bedrooms
Casale delle papere with private pool near rome
Entire Place • 1 bedroom
Beyond the Siepe apartment
Entire Place • 1 bedroom
Note: Performance varies based on location, size, amenities, seasonality, and management quality. Data reflects the past 12 months.
Top Performing Airbnb Hosts in Nepi (2025)
Learn from the best! This table showcases top-performing Airbnb hosts in Nepi based on the number of properties managed and estimated total revenue over the past year. Analyze their scale and performance metrics.
| Host Name | Properties | Grossing Revenue | Stay Reviews | Avg Rating |
|---|---|---|---|---|
| Tea | 1 | $42,813 | 3 | 5.00/5.0 |
| Dario | 1 | $30,851 | 68 | 4.91/5.0 |
| Olivia | 4 | $24,828 | 25 | 4.84/5.0 |
| Alessandro | 2 | $24,292 | 19 | 5.00/5.0 |
| Host #21766115 | 2 | $22,905 | 1 | 0.00/5.0 |
| Host #80410872 | 1 | $22,590 | 21 | 5.00/5.0 |
| Roberta | 1 | $14,603 | 8 | 5.00/5.0 |
| Consuelo | 1 | $13,955 | 21 | 5.00/5.0 |
| Andrea | 1 | $12,678 | 14 | 4.79/5.0 |
| Luca | 1 | $10,106 | 12 | 5.00/5.0 |
Analyzing the strategies of top hosts, such as their property selection, pricing, and guest communication, can offer valuable lessons for optimizing your own Airbnb operations in Nepi.
Dive Deeper: Advanced Nepi STR Market Data (2025)
Ready to unlock more insights? AirROI provides access to advanced metrics and comprehensive Airbnb data for Nepi. Explore detailed analytics beyond this report to refine your investment strategy, optimize pricing, and maximize your vacation rental profits.
Explore Advanced MetricsNepi Short-Term Rental Market Composition (2025): Property & Room Types
Room Type Distribution
Property Type Distribution
Market Composition Insights for Nepi
- The Nepi Airbnb market composition is heavily skewed towards Entire Home/Apt listings, which make up 100% of the 29 active rentals. This indicates strong guest preference for privacy and space.
- Looking at the property type distribution in Nepi, House properties are the most common (51.7%), reflecting the local real estate landscape.
- Houses represent a significant 51.7% portion, catering likely to families or larger groups.
Nepi Airbnb Room Capacity Analysis (2025): Bedroom Distribution
Distribution of Listings by Number of Bedrooms
Room Capacity Insights for Nepi
- The dominant room capacity in Nepi is 1 bedroom listings, making up 58.6% of the market. This suggests a strong demand for properties suitable for couples or solo travelers.
- Together, 1 bedroom and 3 bedrooms properties represent 72.4% of the active Airbnb listings in Nepi, indicating a high concentration in these sizes.
- With over half the market (58.6%) consisting of studios or 1-bedroom units, Nepi is particularly well-suited for individuals or couples.
- A significant 24.1% of listings offer 3+ bedrooms, catering to larger groups and families seeking more space in Nepi.
Nepi Vacation Rental Guest Capacity Trends (2025)
Distribution of Listings by Guest Capacity
Guest Capacity Insights for Nepi
- The most common guest capacity trend in Nepi vacation rentals is listings accommodating 4 guests (44.8%). This suggests the primary traveler segment is likely small families or groups.
- Properties designed for 4 guests and 2 guests dominate the Nepi STR market, accounting for 58.6% of listings.
- 24.0% of properties accommodate 6+ guests, serving the market segment for larger families or group travel in Nepi.
- On average, properties in Nepi are equipped to host 4.4 guests.
Nepi Airbnb Booking Patterns (2025): Available vs. Booked Days
Available Days Distribution
Booked Days Distribution
Booking Pattern Insights for Nepi
- The most common availability pattern in Nepi falls within the 271-366 days range, representing 65.5% of listings. This suggests many properties have significant open periods on their calendars.
- Approximately 96.5% of listings show high availability (181+ days open annually), indicating potential for increased bookings or specific owner usage patterns.
- For booked days, the 31-90 days range is most frequent in Nepi (44.8%), reflecting common guest stay durations or potential owner blocking patterns.
- A notable 6.9% of properties secure long booking periods (181+ days booked per year), highlighting successful long-term rental strategies or significant owner usage.
Nepi Airbnb Minimum Stay Requirements Analysis
Distribution of Listings by Minimum Night Requirement
1 Night
11 listings
42.3% of total
2 Nights
6 listings
23.1% of total
3 Nights
4 listings
15.4% of total
4-6 Nights
1 listings
3.8% of total
7-29 Nights
3 listings
11.5% of total
30+ Nights
1 listings
3.8% of total
Key Insights
- The most prevalent minimum stay requirement in Nepi is 1 Night, adopted by 42.3% of listings. This highlights the market's preference for shorter, flexible bookings.
- A strong majority (65.4%) of the Nepi Airbnb data shows acceptance of very short stays (1-2 nights), indicating a dynamic, high-turnover market.
Recommendations
- Align with the market by considering a 1 Night minimum stay, as 42.3% of Nepi hosts use this setting.
- Adjust minimum nights based on seasonality – potentially shorter during low season and longer during peak demand periods in Nepi.
Nepi Airbnb Cancellation Policy Trends Analysis (2025)
Flexible
8 listings
34.8% of total
Moderate
9 listings
39.1% of total
Strict
6 listings
26.1% of total
Cancellation Policy Insights for Nepi
- The prevailing Airbnb cancellation policy trend in Nepi is Moderate, used by 39.1% of listings.
- The market strongly favors guest-friendly terms, with 73.9% of listings offering Flexible or Moderate policies. This suggests guests in Nepi may expect booking flexibility.
Recommendations for Hosts
- Consider adopting a Moderate policy to align with the 39.1% market standard in Nepi.
- Regularly review your cancellation policy against competitors and market demand shifts in Nepi.
Nepi STR Booking Lead Time Analysis (2025)
Average Booking Lead Time by Month
Booking Lead Time Insights for Nepi
- The overall average booking lead time for vacation rentals in Nepi is 43 days.
- Guests book furthest in advance for stays during April (average 71 days), likely coinciding with peak travel demand or local events.
- The shortest booking windows occur for stays in November (average 18 days), indicating more last-minute travel plans during this time.
- Seasonally, Summer (60 days avg.) sees the longest lead times, while Fall (36 days avg.) has the shortest, reflecting typical travel planning cycles.
Recommendations for Hosts
- Use the overall average lead time (43 days) as a baseline for your pricing and availability strategy in Nepi.
- For April stays, consider implementing length-of-stay discounts or slightly higher rates for bookings made less than 71 days out to capitalize on advance planning.
- Target marketing efforts for the Summer season well in advance (at least 60 days) to capture early planners.
- Monitor your own booking lead times against these Nepi averages to identify opportunities for dynamic pricing adjustments.
Popular & Essential Airbnb Amenities in Nepi (2025)
Amenity Prevalence
Amenity Insights for Nepi
- Essential amenities in Nepi that guests expect include: Heating, Kitchen, Hot water, TV. Lacking these (any) could significantly impact bookings.
- Popular amenities like Essentials, Wifi, Refrigerator are common but not universal. Offering these can provide a competitive edge.
- Warning: Wifi is not universally provided but is considered essential globally. Ensure reliable Wifi is offered.
Recommendations for Hosts
- Ensure your listing includes all essential amenities for Nepi: Heating, Kitchen, Hot water, TV.
- Prioritize adding missing essentials: Hot water, TV.
- Consider adding popular differentiators like Essentials or Wifi to increase appeal.
- Highlight unique or less common amenities you offer (e.g., hot tub, dedicated workspace, EV charger) in your listing description and photos.
- Regularly check competitor amenities in Nepi to stay competitive.
Nepi Airbnb Guest Demographics & Profile Analysis (2025)
Guest Profile Summary for Nepi
- The typical guest profile for Airbnb in Nepi consists of a mix of domestic (57%) and international guests, often arriving from nearby Rome, typically belonging to the Post-2000s (Gen Z/Alpha) group (50%), primarily speaking English or Italian.
- Domestic travelers account for 57.1% of guests.
- Key international markets include Italy (57.1%) and Germany (5.7%).
- Top languages spoken are English (38.7%) followed by Italian (25.8%).
- A significant demographic segment is the Post-2000s (Gen Z/Alpha) group, representing 50% of guests.
Recommendations for Hosts
- Balance marketing efforts between domestic and international channels based on the guest mix.
- Tailor amenities and listing descriptions to appeal to the dominant Post-2000s (Gen Z/Alpha) demographic (e.g., highlight fast WiFi, smart home features, local guides).
- Highlight unique local experiences or amenities relevant to the primary guest profile.
- Consider seasonal promotions aligned with peak travel times for key origin markets.
Nearby Short-Term Rental Market Comparison
How does the Nepi Airbnb market stack up against its neighbors? Compare key performance metrics like average monthly revenue, ADR, and occupancy rates in surrounding areas to understand the broader regional STR landscape.
| Market | Active Properties | Monthly Revenue | Daily Rate | Avg. Occupancy |
|---|---|---|---|---|
| Tignano | 10 | $3,391 | $500.31 | 36% |
| Buonconvento | 59 | $3,068 | $456.70 | 46% |
| Rome | 23,290 | $2,898 | $208.87 | 51% |
| Collazzone | 28 | $2,839 | $341.11 | 36% |
| Florence | 9,598 | $2,833 | $208.48 | 52% |
| Marcialla | 25 | $2,788 | $236.61 | 54% |
| Parrano | 18 | $2,762 | $329.95 | 34% |
| Impruneta | 131 | $2,761 | $237.93 | 45% |
| Marciano della Chiana | 18 | $2,719 | $377.32 | 35% |
| Gaiole in Chianti | 206 | $2,679 | $344.49 | 39% |