Itri Airbnb Market Analysis 2025: Short Term Rental Data & Vacation Rental Statistics in Lazio, Italy
Is Airbnb profitable in Itri in 2025? Explore comprehensive Airbnb analytics for Itri, Lazio, Italy to uncover income potential. This 2025 STR market report for Itri, based on AirROI data from April 2024 to March 2025, reveals key trends in the niche market of 84 active listings.
Whether you're considering an Airbnb investment in Itri, optimizing your existing vacation rental, or exploring rental arbitrage opportunities, understanding the Itri Airbnb data is crucial. Navigating the high regulation landscape is key to maximizing your short term rental income potential. Let's dive into the specifics.
Key Itri Airbnb Performance Metrics Overview
Monthly Airbnb Revenue Variations & Income Potential in Itri (2025)
Understanding the monthly revenue variations for Airbnb listings in Itri is key to maximizing your short term rental income potential. Seasonality significantly impacts earnings. Our analysis, based on data from the past 12 months, shows that the peak revenue month for STRs in Itri is typically August, while February often presents the lowest earnings, highlighting opportunities for strategic pricing adjustments during shoulder and low seasons. Explore the typical Airbnb income in Itri across different performance tiers:
- Best-in-class properties (Top 10%) achieve $2,563+ monthly, often utilizing dynamic pricing and superior guest experiences.
- Strong performing properties (Top 25%) earn $1,379 or more, indicating effective management and desirable locations/amenities.
- Typical properties (Median) generate around $676 per month, representing the average market performance.
- Entry-level properties (Bottom 25%) see earnings around $302, often with potential for optimization.
Average Monthly Airbnb Earnings Trend in Itri
Itri Airbnb Occupancy Rate Trends (2025)
Maximize your bookings by understanding the Itri STR occupancy trends. Seasonal demand shifts significantly influence how often properties are booked. Typically, Augustsees the highest demand (peak season occupancy), while January experiences the lowest (low season). Effective strategies, like adjusting minimum stays or offering promotions, can boost occupancy during slower periods. Here's how different property tiers perform in Itri:
- Best-in-class properties (Top 10%) achieve 47%+ occupancy, indicating high desirability and potentially optimized availability.
- Strong performing properties (Top 25%) maintain 32% or higher occupancy, suggesting good market fit and guest satisfaction.
- Typical properties (Median) have an occupancy rate around 17%.
- Entry-level properties (Bottom 25%) average 8% occupancy, potentially facing higher vacancy.
Average Monthly Occupancy Rate Trend in Itri
Average Daily Rate (ADR) Airbnb Trends in Itri (2025)
Effective short term rental pricing strategy in Itri involves understanding monthly ADR fluctuations. The Average Daily Rate (ADR) for Airbnb in Itri typically peaks in August and dips lowest during March. Leveraging Airbnb dynamic pricing tools or strategies based on this seasonality can significantly boost revenue. Here's a look at the typical nightly rates achieved:
- Best-in-class properties (Top 10%) command rates of $269+ per night, often due to premium features or locations.
- Strong performing properties (Top 25%) achieve nightly rates of $168 or more.
- Typical properties (Median) charge around $107 per night.
- Entry-level properties (Bottom 25%) earn around $82 per night.
Average Daily Rate (ADR) Trend by Month in Itri
Get Live Itri Market Intelligence 👇

Explore Real-time Analytics
Airbnb Seasonality Analysis & Trends in Itri (2025)
Peak Season (August, July, May)
- Revenue averages $1,856 per month
- Occupancy rates average 34.3%
- Daily rates average $165
Shoulder Season
- Revenue averages $1,064 per month
- Occupancy maintains around 18.5%
- Daily rates hold near $147
Low Season (January, February, March)
- Revenue drops to average $657 per month
- Occupancy decreases to average 18.1%
- Daily rates adjust to average $124
Seasonality Insights for Itri
- The Airbnb seasonality in Itri shows highly seasonal trends requiring careful strategy. While the sections above show seasonal averages, it's also insightful to look at the extremes:
- During the high season, the absolute peak month showcases Itri's highest earning potential, with monthly revenues capable of climbing to $2,428, occupancy reaching a high of 46.2%, and ADRs peaking at $171.
- Conversely, the slowest single month of the year, typically falling within the low season, marks the market's lowest point. In this month, revenue might dip to $646, occupancy could drop to 13.9%, and ADRs may adjust down to $123.
- Understanding both the seasonal averages and these monthly peaks and troughs in revenue, occupancy, and ADR is crucial for maximizing your Airbnb profit potential in Itri.
Seasonal Strategies for Maximizing Profit
- Peak Season: Maximize revenue through premium pricing and potentially longer minimum stays. Ensure high availability.
- Low Season: Offer competitive pricing, special promotions (e.g., extended stay discounts), and flexible cancellation policies. Target off-season travelers like remote workers or budget-conscious guests.
- Shoulder Seasons: Implement dynamic pricing that balances peak and low rates. Target weekend travelers or specific events. Offer slightly more flexible terms than peak season.
- Regularly analyze your own performance against these Itri seasonality benchmarks and adjust your pricing and availability strategy accordingly.
Best Areas for Airbnb Investment in Itri (2025)
Exploring the top neighborhoods for short-term rentals in Itri? This section highlights key areas, outlining why they are attractive for hosts and guests, along with notable local attractions. Consider these locations based on your target guest profile and investment strategy.
| Neighborhood / Area | Why Host Here? (Target Guests & Appeal) | Key Attractions & Landmarks |
|---|---|---|
| Centro Storico | The historic center of Itri is rich in culture and history, making it an attractive destination for tourists who want to explore ancient castles and local architecture. | Itri Castle, Church of San Michele Arcangelo, Via Roma, Local restaurants and cafes, Historical landmarks |
| Itri Hills | The scenic hills surrounding Itri offer stunning views and a peaceful atmosphere, ideal for visitors seeking nature and tranquility just outside the main town. | Nature trails, Hiking opportunities, Panoramic views, Local vineyards |
| La Montagna Spaccata | A nearby natural site known for its dramatic rock formations and beautiful landscapes. It attracts nature lovers and those looking for outdoor activities. | Hiking, Photography spots, Natural beauty, Picnic areas |
| Terracina Beach | Close to Itri, Terracina features beautiful beaches and is popular among tourists looking for a seaside escape with water activities and relaxation. | Terracina beach, Historic old town, Dining options by the sea, Water sports |
| Gaeta | A charming coastal town near Itri known for its stunning beaches and historic sites, Gaeta draws visitors interested in a combination of culture and coastal recreation. | Gaeta Beach, Castello Aragonese, Sanctuary of Montagna Spaccata, Local seafood restaurants |
| Formia | Formia is another coastal town close to Itri, known for its beautiful beaches and vibrant local life, making it a popular destination for beachgoers. | Formia beach, Promenade, Local markets, Cafes and bars |
| Ponte di Itri | An area popular for its picturesque bridge and surrounding countryside. It provides a glimpse into local life and scenic views. | Ponte di Itri, Countryside views, Local farms, Walking paths |
| Latina Countryside | The rural areas surrounding Itri offer agricultural experiences and agritourism, appealing to tourists interested in local produce and rural culture. | Vineyards, Olive groves, Agriturismos, Farm tours |
Understanding Airbnb License Requirements & STR Laws in Itri (2025)
Yes, Itri, Lazio, Italy enforces high STR regulations. Obtaining a license and ensuring compliance is almost certainly required according to current 2025 STR laws. Always verify the latest short term rental regulations and Airbnb license requirements directly with local government authorities for Itri to ensure full compliance before hosting.
(Source: AirROI data, 2025, based on 40% licensed listings)
Top Performing Airbnb Properties in Itri (2025)
Benchmark your potential! Explore examples of top-performing Airbnb properties in Itribased on Trailing Twelve Month (TTM) revenue. Analyze their characteristics, revenue, occupancy rate, and ADR to understand what drives success in this market.

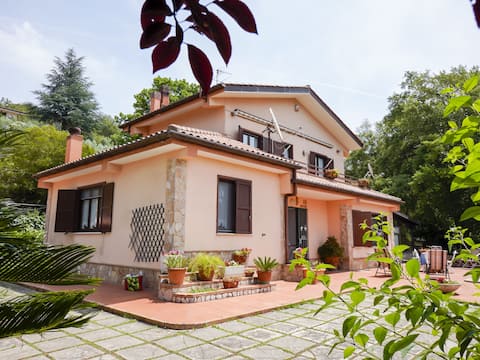
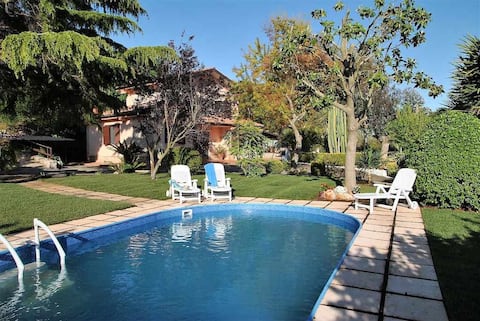
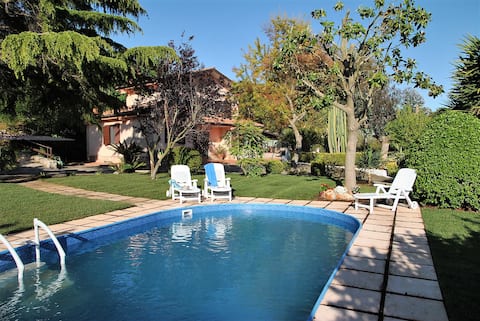
Villa with swimming pool in Italian countryside
Entire Place • 6 bedrooms

Villa Fortuna
Entire Place • 5 bedrooms

Gated 6 Bedroom Villa with Pool on the mountain
Entire Place • 6 bedrooms
Sunny home by Interhome
Entire Place • 5 bedrooms
Vallereal Villa
Entire Place • 5 bedrooms
Villa Vallereale beautiful garden and private pool
Entire Place • 5 bedrooms
Note: Performance varies based on location, size, amenities, seasonality, and management quality. Data reflects the past 12 months.
Top Performing Airbnb Hosts in Itri (2025)
Learn from the best! This table showcases top-performing Airbnb hosts in Itri based on the number of properties managed and estimated total revenue over the past year. Analyze their scale and performance metrics.
| Host Name | Properties | Grossing Revenue | Stay Reviews | Avg Rating |
|---|---|---|---|---|
| Tim Golden Stay Com | 1 | $58,953 | 4 | 4.25/5.0 |
| Emanuele Maria | 1 | $52,003 | 63 | 4.73/5.0 |
| Pino | 1 | $42,693 | 7 | 5.00/5.0 |
| Letizia | 3 | $39,023 | 12 | 4.63/5.0 |
| Sergio | 5 | $32,229 | 19 | 2.41/5.0 |
| Francesco | 2 | $27,934 | 18 | 4.78/5.0 |
| Alessandra - Interhome Group | 1 | $23,795 | 7 | 4.71/5.0 |
| Host #201739458 | 1 | $18,356 | 1 | 0.00/5.0 |
| Sandro | 3 | $17,172 | 64 | 4.75/5.0 |
| Lisa - Interhome Group | 1 | $15,135 | 11 | 4.82/5.0 |
Analyzing the strategies of top hosts, such as their property selection, pricing, and guest communication, can offer valuable lessons for optimizing your own Airbnb operations in Itri.
Dive Deeper: Advanced Itri STR Market Data (2025)
Ready to unlock more insights? AirROI provides access to advanced metrics and comprehensive Airbnb data for Itri. Explore detailed analytics beyond this report to refine your investment strategy, optimize pricing, and maximize your vacation rental profits.
Explore Advanced MetricsItri Short-Term Rental Market Composition (2025): Property & Room Types
Room Type Distribution
Property Type Distribution
Market Composition Insights for Itri
- The Itri Airbnb market composition is heavily skewed towards Entire Home/Apt listings, which make up 81% of the 84 active rentals. This indicates strong guest preference for privacy and space.
- Looking at the property type distribution in Itri, House properties are the most common (53.6%), reflecting the local real estate landscape.
- Houses represent a significant 53.6% portion, catering likely to families or larger groups.
- The presence of 15.5% Hotel/Boutique listings indicates integration with traditional hospitality.
- Smaller segments like others, outdoor/unique (combined 4.8%) offer potential for unique stay experiences.
Itri Airbnb Room Capacity Analysis (2025): Bedroom Distribution
Distribution of Listings by Number of Bedrooms
Room Capacity Insights for Itri
- The dominant room capacity in Itri is 1 bedroom listings, making up 34.5% of the market. This suggests a strong demand for properties suitable for couples or solo travelers.
- Together, 1 bedroom and 2 bedrooms properties represent 64.3% of the active Airbnb listings in Itri, indicating a high concentration in these sizes.
- A significant 22.6% of listings offer 3+ bedrooms, catering to larger groups and families seeking more space in Itri.
Itri Vacation Rental Guest Capacity Trends (2025)
Distribution of Listings by Guest Capacity
Guest Capacity Insights for Itri
- The most common guest capacity trend in Itri vacation rentals is listings accommodating 4 guests (32.1%). This suggests the primary traveler segment is likely small families or groups.
- Properties designed for 4 guests and 8+ guests dominate the Itri STR market, accounting for 47.6% of listings.
- 25.0% of properties accommodate 6+ guests, serving the market segment for larger families or group travel in Itri.
- On average, properties in Itri are equipped to host 4.1 guests.
Itri Airbnb Booking Patterns (2025): Available vs. Booked Days
Available Days Distribution
Booked Days Distribution
Booking Pattern Insights for Itri
- The most common availability pattern in Itri falls within the 271-366 days range, representing 89.3% of listings. This suggests many properties have significant open periods on their calendars.
- Approximately 98.8% of listings show high availability (181+ days open annually), indicating potential for increased bookings or specific owner usage patterns.
- For booked days, the 1-30 days range is most frequent in Itri (47.6%), reflecting common guest stay durations or potential owner blocking patterns.
- A notable 1.2% of properties secure long booking periods (181+ days booked per year), highlighting successful long-term rental strategies or significant owner usage.
Itri Airbnb Minimum Stay Requirements Analysis
Distribution of Listings by Minimum Night Requirement
1 Night
19 listings
24.4% of total
2 Nights
22 listings
28.2% of total
3 Nights
3 listings
3.8% of total
4-6 Nights
6 listings
7.7% of total
7-29 Nights
21 listings
26.9% of total
30+ Nights
7 listings
9% of total
Key Insights
- The most prevalent minimum stay requirement in Itri is 2 Nights, adopted by 28.2% of listings. This highlights the market's preference for shorter, flexible bookings.
Recommendations
- Align with the market by considering a 2 Nights minimum stay, as 28.2% of Itri hosts use this setting.
- If feasible, allowing 1-night stays, especially midweek or during low season, could capture last-minute bookings, as only 24.4% currently do.
- Explore offering discounts for stays of 30+ nights to attract the 9% of the market seeking extended stays.
- Adjust minimum nights based on seasonality – potentially shorter during low season and longer during peak demand periods in Itri.
Itri Airbnb Cancellation Policy Trends Analysis (2025)
Super Strict 30 Days
5 listings
8.9% of total
Flexible
21 listings
37.5% of total
Moderate
21 listings
37.5% of total
Strict
9 listings
16.1% of total
Cancellation Policy Insights for Itri
- The prevailing Airbnb cancellation policy trend in Itri is Flexible, used by 37.5% of listings.
- The market strongly favors guest-friendly terms, with 75.0% of listings offering Flexible or Moderate policies. This suggests guests in Itri may expect booking flexibility.
Recommendations for Hosts
- Consider adopting a Flexible policy to align with the 37.5% market standard in Itri.
- Regularly review your cancellation policy against competitors and market demand shifts in Itri.
Itri STR Booking Lead Time Analysis (2025)
Average Booking Lead Time by Month
Booking Lead Time Insights for Itri
- The overall average booking lead time for vacation rentals in Itri is 39 days.
- Guests book furthest in advance for stays during May (average 91 days), likely coinciding with peak travel demand or local events.
- The shortest booking windows occur for stays in March (average 16 days), indicating more last-minute travel plans during this time.
- Seasonally, Fall (69 days avg.) sees the longest lead times, while Winter (26 days avg.) has the shortest, reflecting typical travel planning cycles.
Recommendations for Hosts
- Use the overall average lead time (39 days) as a baseline for your pricing and availability strategy in Itri.
- For May stays, consider implementing length-of-stay discounts or slightly higher rates for bookings made less than 91 days out to capitalize on advance planning.
- Target marketing efforts for the Fall season well in advance (at least 69 days) to capture early planners.
- Monitor your own booking lead times against these Itri averages to identify opportunities for dynamic pricing adjustments.
Popular & Essential Airbnb Amenities in Itri (2025)
Amenity Prevalence
Amenity Insights for Itri
- Essential amenities in Itri that guests expect include: Kitchen. Lacking these (this) could significantly impact bookings.
- Popular amenities like Hot water, Heating, TV are common but not universal. Offering these can provide a competitive edge.
- Warning: Wifi is not universally provided but is considered essential globally. Ensure reliable Wifi is offered.
Recommendations for Hosts
- Ensure your listing includes all essential amenities for Itri: Kitchen.
- Prioritize adding missing essentials: Kitchen.
- Consider adding popular differentiators like Hot water or Heating to increase appeal.
- Highlight unique or less common amenities you offer (e.g., hot tub, dedicated workspace, EV charger) in your listing description and photos.
- Regularly check competitor amenities in Itri to stay competitive.
Itri Airbnb Guest Demographics & Profile Analysis (2025)
Guest Profile Summary for Itri
- The typical guest profile for Airbnb in Itri consists of primarily domestic travelers (67%), often arriving from nearby Rome, typically belonging to the Post-2000s (Gen Z/Alpha) group (50%), primarily speaking English or Italian.
- Domestic travelers account for 66.5% of guests.
- Key international markets include Italy (66.5%) and France (3.2%).
- Top languages spoken are English (36.4%) followed by Italian (28.8%).
- A significant demographic segment is the Post-2000s (Gen Z/Alpha) group, representing 50% of guests.
Recommendations for Hosts
- Target domestic marketing efforts towards travelers from Rome and Naples.
- Tailor amenities and listing descriptions to appeal to the dominant Post-2000s (Gen Z/Alpha) demographic (e.g., highlight fast WiFi, smart home features, local guides).
- Highlight unique local experiences or amenities relevant to the primary guest profile.
- Consider seasonal promotions aligned with peak travel times for key origin markets.
Nearby Short-Term Rental Market Comparison
How does the Itri Airbnb market stack up against its neighbors? Compare key performance metrics like average monthly revenue, ADR, and occupancy rates in surrounding areas to understand the broader regional STR landscape.
| Market | Active Properties | Monthly Revenue | Daily Rate | Avg. Occupancy |
|---|---|---|---|---|
| Positano | 683 | $6,671 | $624.23 | 53% |
| Praiano | 331 | $4,415 | $403.56 | 55% |
| Conca dei Marini | 112 | $4,308 | $395.84 | 53% |
| Capri | 423 | $3,942 | $586.54 | 41% |
| Sorrento | 1,475 | $3,702 | $325.69 | 50% |
| Amalfi | 463 | $3,284 | $317.75 | 48% |
| Massa Lubrense | 832 | $3,255 | $413.33 | 45% |
| Ravello | 261 | $3,201 | $317.16 | 47% |
| Furore | 141 | $3,098 | $340.51 | 51% |
| Rome | 23,290 | $2,898 | $208.87 | 51% |