Frascati Airbnb Market Analysis 2025: Short Term Rental Data & Vacation Rental Statistics in Lazio, Italy
Is Airbnb profitable in Frascati in 2025? Explore comprehensive Airbnb analytics for Frascati, Lazio, Italy to uncover income potential. This 2025 STR market report for Frascati, based on AirROI data from April 2024 to March 2025, reveals key trends in the niche market of 73 active listings.
Whether you're considering an Airbnb investment in Frascati, optimizing your existing vacation rental, or exploring rental arbitrage opportunities, understanding the Frascati Airbnb data is crucial. Navigating the high regulation landscape is key to maximizing your short term rental income potential. Let's dive into the specifics.
Key Frascati Airbnb Performance Metrics Overview
Monthly Airbnb Revenue Variations & Income Potential in Frascati (2025)
Understanding the monthly revenue variations for Airbnb listings in Frascati is key to maximizing your short term rental income potential. Seasonality significantly impacts earnings. Our analysis, based on data from the past 12 months, shows that the peak revenue month for STRs in Frascati is typically June, while November often presents the lowest earnings, highlighting opportunities for strategic pricing adjustments during shoulder and low seasons. Explore the typical Airbnb income in Frascati across different performance tiers:
- Best-in-class properties (Top 10%) achieve $2,774+ monthly, often utilizing dynamic pricing and superior guest experiences.
- Strong performing properties (Top 25%) earn $1,961 or more, indicating effective management and desirable locations/amenities.
- Typical properties (Median) generate around $1,108 per month, representing the average market performance.
- Entry-level properties (Bottom 25%) see earnings around $613, often with potential for optimization.
Average Monthly Airbnb Earnings Trend in Frascati
Frascati Airbnb Occupancy Rate Trends (2025)
Maximize your bookings by understanding the Frascati STR occupancy trends. Seasonal demand shifts significantly influence how often properties are booked. Typically, Junesees the highest demand (peak season occupancy), while January experiences the lowest (low season). Effective strategies, like adjusting minimum stays or offering promotions, can boost occupancy during slower periods. Here's how different property tiers perform in Frascati:
- Best-in-class properties (Top 10%) achieve 75%+ occupancy, indicating high desirability and potentially optimized availability.
- Strong performing properties (Top 25%) maintain 57% or higher occupancy, suggesting good market fit and guest satisfaction.
- Typical properties (Median) have an occupancy rate around 36%.
- Entry-level properties (Bottom 25%) average 18% occupancy, potentially facing higher vacancy.
Average Monthly Occupancy Rate Trend in Frascati
Average Daily Rate (ADR) Airbnb Trends in Frascati (2025)
Effective short term rental pricing strategy in Frascati involves understanding monthly ADR fluctuations. The Average Daily Rate (ADR) for Airbnb in Frascati typically peaks in January and dips lowest during April. Leveraging Airbnb dynamic pricing tools or strategies based on this seasonality can significantly boost revenue. Here's a look at the typical nightly rates achieved:
- Best-in-class properties (Top 10%) command rates of $165+ per night, often due to premium features or locations.
- Strong performing properties (Top 25%) achieve nightly rates of $117 or more.
- Typical properties (Median) charge around $92 per night.
- Entry-level properties (Bottom 25%) earn around $69 per night.
Average Daily Rate (ADR) Trend by Month in Frascati
Get Live Frascati Market Intelligence 👇

Explore Real-time Analytics
Airbnb Seasonality Analysis & Trends in Frascati (2025)
Peak Season (June, May, July)
- Revenue averages $2,926 per month
- Occupancy rates average 46.1%
- Daily rates average $128
Shoulder Season
- Revenue averages $2,062 per month
- Occupancy maintains around 39.7%
- Daily rates hold near $137
Low Season (January, February, November)
- Revenue drops to average $1,301 per month
- Occupancy decreases to average 31.0%
- Daily rates adjust to average $154
Seasonality Insights for Frascati
- The Airbnb seasonality in Frascati shows highly seasonal trends requiring careful strategy. While the sections above show seasonal averages, it's also insightful to look at the extremes:
- During the high season, the absolute peak month showcases Frascati's highest earning potential, with monthly revenues capable of climbing to $3,489, occupancy reaching a high of 50.7%, and ADRs peaking at $157.
- Conversely, the slowest single month of the year, typically falling within the low season, marks the market's lowest point. In this month, revenue might dip to $1,232, occupancy could drop to 29.5%, and ADRs may adjust down to $127.
- Understanding both the seasonal averages and these monthly peaks and troughs in revenue, occupancy, and ADR is crucial for maximizing your Airbnb profit potential in Frascati.
Seasonal Strategies for Maximizing Profit
- Peak Season: Maximize revenue through premium pricing and potentially longer minimum stays. Ensure high availability.
- Low Season: Offer competitive pricing, special promotions (e.g., extended stay discounts), and flexible cancellation policies. Target off-season travelers like remote workers or budget-conscious guests.
- Shoulder Seasons: Implement dynamic pricing that balances peak and low rates. Target weekend travelers or specific events. Offer slightly more flexible terms than peak season.
- Regularly analyze your own performance against these Frascati seasonality benchmarks and adjust your pricing and availability strategy accordingly.
Best Areas for Airbnb Investment in Frascati (2025)
Exploring the top neighborhoods for short-term rentals in Frascati? This section highlights key areas, outlining why they are attractive for hosts and guests, along with notable local attractions. Consider these locations based on your target guest profile and investment strategy.
| Neighborhood / Area | Why Host Here? (Target Guests & Appeal) | Key Attractions & Landmarks |
|---|---|---|
| Centro Storico | The historic center of Frascati features beautiful architecture, charming streets, and is close to restaurants and shops. It's a prime location for tourists looking to explore the rich history of the area. | Frascati Cathedral, Palazzo Vescovile, Villa Aldobrandini, Piazza del Gesù, Local wine shops, Artisan gelaterias |
| Parco degli Acquedotti | This area is known for its nature and the ancient Roman aqueducts. It's popular with families and nature enthusiasts looking for outdoor activities. | Aqueducts Park, Hiking trails, Picnic areas, Ruins of ancient Roman structures |
| Monte Porzio Catone | Located near Frascati, it's famous for its vineyards and panoramic views. Attracts guests seeking a rural retreat while being close to the city. | Vineyards, Parco Naturale Regionale dei Castelli Romani, Local wine tastings |
| Velletri | Nearby Velletri offers a more authentic Italian town experience with local markets, traditional restaurants, and proximity to nature. | Velletri Market, Castello di Velletri, Local trattorias, Hiking paths in the surrounding hills |
| Grottaferrata | Known for historic sites and monasteries, Grottaferrata is appealing to those interested in Italian culture and history, and it provides a great atmosphere for staying. | Abbazia di San Nilo, Historic villas, Local shops, Cultural festivals |
| Castel Gandolfo | Famous for being the papal residence, this area features stunning views of Lake Albano. It's sought after by tourists looking for scenic beauty. | Papal Palace, Lake Albano, Gardens of the Pope, Historical walking trails |
| Frascati Wine Region | This area is noted for its delightful wines. Guests will enjoy the wine tours and tastings available, making it a favorite for food and wine lovers. | Wine tours, Vineyards, Wine festivals, Culinary experiences |
| Borgo di Frascati | A charming village atmosphere with narrow streets and local cuisine. It is attractive for tourists wanting a quaint Italian experience. | Local eateries, Artisan shops, Cultural events and festivals |
Understanding Airbnb License Requirements & STR Laws in Frascati (2025)
Yes, Frascati, Lazio, Italy enforces high STR regulations. Obtaining a license and ensuring compliance is almost certainly required according to current 2025 STR laws. Always verify the latest short term rental regulations and Airbnb license requirements directly with local government authorities for Frascati to ensure full compliance before hosting.
(Source: AirROI data, 2025, based on 62% licensed listings)
Top Performing Airbnb Properties in Frascati (2025)
Benchmark your potential! Explore examples of top-performing Airbnb properties in Frascatibased on Trailing Twelve Month (TTM) revenue. Analyze their characteristics, revenue, occupancy rate, and ADR to understand what drives success in this market.
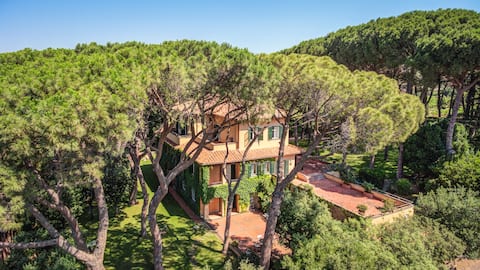
Tenuta 4 pini
Entire Place • 21 bedrooms
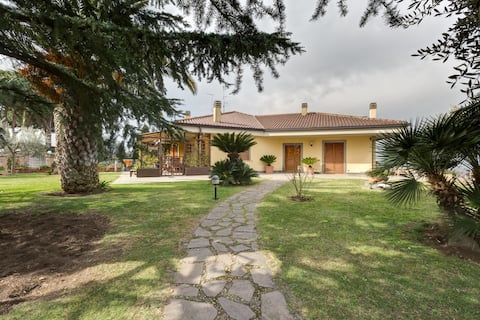
Beautiful Villa in Rome - Frascati
Entire Place • 5 bedrooms
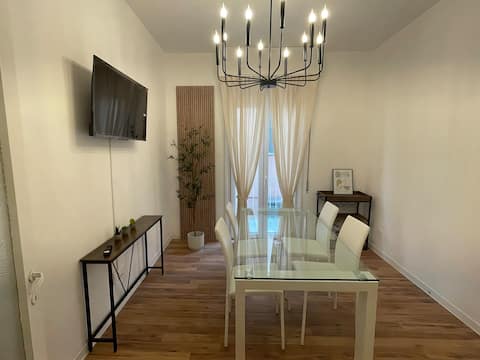
Il Vicoletto in the historic center of Frascati
Entire Place • 2 bedrooms
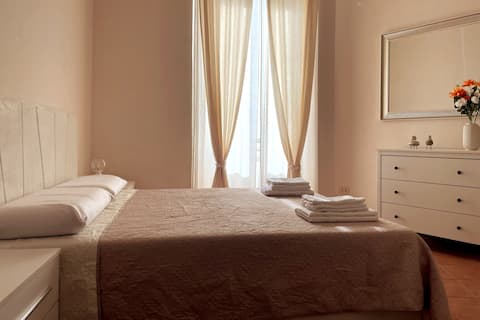
La Perla in the Old Town of Frascati
Entire Place • 2 bedrooms
Exclusive Penthouse with 360° view on Rome
Entire Place • 1 bedroom

Superior @Ilaria's
Private Room • 1 bedroom
Note: Performance varies based on location, size, amenities, seasonality, and management quality. Data reflects the past 12 months.
Top Performing Airbnb Hosts in Frascati (2025)
Learn from the best! This table showcases top-performing Airbnb hosts in Frascati based on the number of properties managed and estimated total revenue over the past year. Analyze their scale and performance metrics.
| Host Name | Properties | Grossing Revenue | Stay Reviews | Avg Rating |
|---|---|---|---|---|
| Carlotta | 1 | $516,591 | 40 | 4.98/5.0 |
| Paolo Riccardo | 7 | $84,601 | 59 | 1.15/5.0 |
| Giorgio | 2 | $73,998 | 45 | 4.78/5.0 |
| Maria Cristina | 8 | $59,805 | 11 | 0.97/5.0 |
| Ilaria | 2 | $54,148 | 110 | 4.87/5.0 |
| Fabio | 1 | $40,867 | 38 | 4.74/5.0 |
| Luca | 10 | $34,277 | 46 | 2.35/5.0 |
| Emiliano | 2 | $33,649 | 77 | 4.86/5.0 |
| Roberto | 1 | $32,674 | 87 | 4.90/5.0 |
| Casa Vacanza Realise | 5 | $30,593 | 172 | 4.69/5.0 |
Analyzing the strategies of top hosts, such as their property selection, pricing, and guest communication, can offer valuable lessons for optimizing your own Airbnb operations in Frascati.
Dive Deeper: Advanced Frascati STR Market Data (2025)
Ready to unlock more insights? AirROI provides access to advanced metrics and comprehensive Airbnb data for Frascati. Explore detailed analytics beyond this report to refine your investment strategy, optimize pricing, and maximize your vacation rental profits.
Explore Advanced MetricsFrascati Short-Term Rental Market Composition (2025): Property & Room Types
Room Type Distribution
Property Type Distribution
Market Composition Insights for Frascati
- The Frascati Airbnb market composition is heavily skewed towards Entire Home/Apt listings, which make up 79.5% of the 73 active rentals. This indicates strong guest preference for privacy and space.
- Looking at the property type distribution in Frascati, Apartment/Condo properties are the most common (68.5%), reflecting the local real estate landscape.
- Houses represent a significant 20.5% portion, catering likely to families or larger groups.
- The presence of 9.6% Hotel/Boutique listings indicates integration with traditional hospitality.
- Smaller segments like outdoor/unique (combined 1.4%) offer potential for unique stay experiences.
Frascati Airbnb Room Capacity Analysis (2025): Bedroom Distribution
Distribution of Listings by Number of Bedrooms
Room Capacity Insights for Frascati
- The dominant room capacity in Frascati is 1 bedroom listings, making up 68.5% of the market. This suggests a strong demand for properties suitable for couples or solo travelers.
- Together, 1 bedroom and 2 bedrooms properties represent 83.6% of the active Airbnb listings in Frascati, indicating a high concentration in these sizes.
- With over half the market (68.5%) consisting of studios or 1-bedroom units, Frascati is particularly well-suited for individuals or couples.
- Listings with 3+ bedrooms (8.2%) represent a smaller niche, potentially indicating an underserved market for larger group accommodations in Frascati.
Frascati Vacation Rental Guest Capacity Trends (2025)
Distribution of Listings by Guest Capacity
Guest Capacity Insights for Frascati
- The most common guest capacity trend in Frascati vacation rentals is listings accommodating 4 guests (28.8%). This suggests the primary traveler segment is likely small families or groups.
- Properties designed for 4 guests and 2 guests dominate the Frascati STR market, accounting for 54.8% of listings.
- On average, properties in Frascati are equipped to host 3.5 guests.
Frascati Airbnb Booking Patterns (2025): Available vs. Booked Days
Available Days Distribution
Booked Days Distribution
Booking Pattern Insights for Frascati
- The most common availability pattern in Frascati falls within the 271-366 days range, representing 46.6% of listings. This suggests many properties have significant open periods on their calendars.
- Approximately 76.7% of listings show high availability (181+ days open annually), indicating potential for increased bookings or specific owner usage patterns.
- For booked days, the 91-180 days range is most frequent in Frascati (32.9%), reflecting common guest stay durations or potential owner blocking patterns.
- A notable 26.1% of properties secure long booking periods (181+ days booked per year), highlighting successful long-term rental strategies or significant owner usage.
Frascati Airbnb Minimum Stay Requirements Analysis
Distribution of Listings by Minimum Night Requirement
1 Night
33 listings
47.1% of total
2 Nights
16 listings
22.9% of total
3 Nights
6 listings
8.6% of total
4-6 Nights
5 listings
7.1% of total
7-29 Nights
5 listings
7.1% of total
30+ Nights
5 listings
7.1% of total
Key Insights
- The most prevalent minimum stay requirement in Frascati is 1 Night, adopted by 47.1% of listings. This highlights the market's preference for shorter, flexible bookings.
- A strong majority (70.0%) of the Frascati Airbnb data shows acceptance of very short stays (1-2 nights), indicating a dynamic, high-turnover market.
Recommendations
- Align with the market by considering a 1 Night minimum stay, as 47.1% of Frascati hosts use this setting.
- Explore offering discounts for stays of 30+ nights to attract the 7.1% of the market seeking extended stays.
- Adjust minimum nights based on seasonality – potentially shorter during low season and longer during peak demand periods in Frascati.
Frascati Airbnb Cancellation Policy Trends Analysis (2025)
Flexible
22 listings
38.6% of total
Moderate
27 listings
47.4% of total
Strict
8 listings
14% of total
Cancellation Policy Insights for Frascati
- The prevailing Airbnb cancellation policy trend in Frascati is Moderate, used by 47.4% of listings.
- The market strongly favors guest-friendly terms, with 86.0% of listings offering Flexible or Moderate policies. This suggests guests in Frascati may expect booking flexibility.
Recommendations for Hosts
- Consider adopting a Moderate policy to align with the 47.4% market standard in Frascati.
- Using a Strict policy might deter some guests, as only 14% of listings use it. Evaluate if potential revenue protection outweighs possible lower booking rates.
- Regularly review your cancellation policy against competitors and market demand shifts in Frascati.
Frascati STR Booking Lead Time Analysis (2025)
Average Booking Lead Time by Month
Booking Lead Time Insights for Frascati
- The overall average booking lead time for vacation rentals in Frascati is 41 days.
- Guests book furthest in advance for stays during May (average 69 days), likely coinciding with peak travel demand or local events.
- The shortest booking windows occur for stays in March (average 30 days), indicating more last-minute travel plans during this time.
- Seasonally, Summer (53 days avg.) sees the longest lead times, while Fall (44 days avg.) has the shortest, reflecting typical travel planning cycles.
Recommendations for Hosts
- Use the overall average lead time (41 days) as a baseline for your pricing and availability strategy in Frascati.
- For May stays, consider implementing length-of-stay discounts or slightly higher rates for bookings made less than 69 days out to capitalize on advance planning.
- Target marketing efforts for the Summer season well in advance (at least 53 days) to capture early planners.
- Monitor your own booking lead times against these Frascati averages to identify opportunities for dynamic pricing adjustments.
Popular & Essential Airbnb Amenities in Frascati (2025)
Amenity Prevalence
Amenity Insights for Frascati
- Essential amenities in Frascati that guests expect include: Wifi. Lacking these (this) could significantly impact bookings.
- Popular amenities like Heating, Kitchen, Essentials are common but not universal. Offering these can provide a competitive edge.
Recommendations for Hosts
- Ensure your listing includes all essential amenities for Frascati: Wifi.
- Prioritize adding missing essentials: Wifi.
- Consider adding popular differentiators like Heating or Kitchen to increase appeal.
- Highlight unique or less common amenities you offer (e.g., hot tub, dedicated workspace, EV charger) in your listing description and photos.
- Regularly check competitor amenities in Frascati to stay competitive.
Frascati Airbnb Guest Demographics & Profile Analysis (2025)
Guest Profile Summary for Frascati
- The typical guest profile for Airbnb in Frascati consists of predominantly international visitors (75%), with top international origins including United States, typically belonging to the Post-2000s (Gen Z/Alpha) group (50%), primarily speaking English or Italian.
- Domestic travelers account for 25.2% of guests.
- Key international markets include Italy (25.2%) and United States (12.6%).
- Top languages spoken are English (39%) followed by Italian (16.7%).
- A significant demographic segment is the Post-2000s (Gen Z/Alpha) group, representing 50% of guests.
Recommendations for Hosts
- Focus marketing internationally, particularly towards travelers from United States.
- Tailor amenities and listing descriptions to appeal to the dominant Post-2000s (Gen Z/Alpha) demographic (e.g., highlight fast WiFi, smart home features, local guides).
- Highlight unique local experiences or amenities relevant to the primary guest profile.
- Consider seasonal promotions aligned with peak travel times for key origin markets.
Nearby Short-Term Rental Market Comparison
How does the Frascati Airbnb market stack up against its neighbors? Compare key performance metrics like average monthly revenue, ADR, and occupancy rates in surrounding areas to understand the broader regional STR landscape.
| Market | Active Properties | Monthly Revenue | Daily Rate | Avg. Occupancy |
|---|---|---|---|---|
| Rome | 23,290 | $2,898 | $208.87 | 51% |
| Collazzone | 28 | $2,839 | $341.11 | 36% |
| Parrano | 18 | $2,762 | $329.95 | 34% |
| Monte Castello di Vibio | 18 | $2,659 | $567.21 | 41% |
| Guardea | 15 | $2,542 | $320.56 | 35% |
| Monteleone d'Orvieto | 31 | $2,537 | $306.96 | 36% |
| Lugnano in Teverina | 19 | $2,238 | $267.38 | 35% |
| San Casciano dei Bagni | 56 | $2,235 | $415.84 | 35% |
| Collevecchio | 12 | $2,213 | $302.16 | 38% |
| Palombara Sabina | 16 | $2,160 | $336.01 | 35% |