Fiuggi Airbnb Market Analysis 2025: Short Term Rental Data & Vacation Rental Statistics in Lazio, Italy
Is Airbnb profitable in Fiuggi in 2025? Explore comprehensive Airbnb analytics for Fiuggi, Lazio, Italy to uncover income potential. This 2025 STR market report for Fiuggi, based on AirROI data from April 2024 to March 2025, reveals key trends in the niche market of 25 active listings.
Whether you're considering an Airbnb investment in Fiuggi, optimizing your existing vacation rental, or exploring rental arbitrage opportunities, understanding the Fiuggi Airbnb data is crucial. Navigating the high regulation landscape is key to maximizing your short term rental income potential. Let's dive into the specifics.
Key Fiuggi Airbnb Performance Metrics Overview
Monthly Airbnb Revenue Variations & Income Potential in Fiuggi (2025)
Understanding the monthly revenue variations for Airbnb listings in Fiuggi is key to maximizing your short term rental income potential. Seasonality significantly impacts earnings. Our analysis, based on data from the past 12 months, shows that the peak revenue month for STRs in Fiuggi is typically May, while November often presents the lowest earnings, highlighting opportunities for strategic pricing adjustments during shoulder and low seasons. Explore the typical Airbnb income in Fiuggi across different performance tiers:
- Best-in-class properties (Top 10%) achieve $1,828+ monthly, often utilizing dynamic pricing and superior guest experiences.
- Strong performing properties (Top 25%) earn $1,127 or more, indicating effective management and desirable locations/amenities.
- Typical properties (Median) generate around $649 per month, representing the average market performance.
- Entry-level properties (Bottom 25%) see earnings around $291, often with potential for optimization.
Average Monthly Airbnb Earnings Trend in Fiuggi
Fiuggi Airbnb Occupancy Rate Trends (2025)
Maximize your bookings by understanding the Fiuggi STR occupancy trends. Seasonal demand shifts significantly influence how often properties are booked. Typically, Maysees the highest demand (peak season occupancy), while November experiences the lowest (low season). Effective strategies, like adjusting minimum stays or offering promotions, can boost occupancy during slower periods. Here's how different property tiers perform in Fiuggi:
- Best-in-class properties (Top 10%) achieve 58%+ occupancy, indicating high desirability and potentially optimized availability.
- Strong performing properties (Top 25%) maintain 40% or higher occupancy, suggesting good market fit and guest satisfaction.
- Typical properties (Median) have an occupancy rate around 23%.
- Entry-level properties (Bottom 25%) average 14% occupancy, potentially facing higher vacancy.
Average Monthly Occupancy Rate Trend in Fiuggi
Average Daily Rate (ADR) Airbnb Trends in Fiuggi (2025)
Effective short term rental pricing strategy in Fiuggi involves understanding monthly ADR fluctuations. The Average Daily Rate (ADR) for Airbnb in Fiuggi typically peaks in August and dips lowest during February. Leveraging Airbnb dynamic pricing tools or strategies based on this seasonality can significantly boost revenue. Here's a look at the typical nightly rates achieved:
- Best-in-class properties (Top 10%) command rates of $122+ per night, often due to premium features or locations.
- Strong performing properties (Top 25%) achieve nightly rates of $91 or more.
- Typical properties (Median) charge around $74 per night.
- Entry-level properties (Bottom 25%) earn around $57 per night.
Average Daily Rate (ADR) Trend by Month in Fiuggi
Get Live Fiuggi Market Intelligence 👇

Explore Real-time Analytics
Airbnb Seasonality Analysis & Trends in Fiuggi (2025)
Peak Season (May, June, August)
- Revenue averages $1,380 per month
- Occupancy rates average 34.6%
- Daily rates average $83
Shoulder Season
- Revenue averages $766 per month
- Occupancy maintains around 27.2%
- Daily rates hold near $80
Low Season (February, March, November)
- Revenue drops to average $505 per month
- Occupancy decreases to average 24.4%
- Daily rates adjust to average $77
Seasonality Insights for Fiuggi
- The Airbnb seasonality in Fiuggi shows highly seasonal trends requiring careful strategy. While the sections above show seasonal averages, it's also insightful to look at the extremes:
- During the high season, the absolute peak month showcases Fiuggi's highest earning potential, with monthly revenues capable of climbing to $1,610, occupancy reaching a high of 43.4%, and ADRs peaking at $86.
- Conversely, the slowest single month of the year, typically falling within the low season, marks the market's lowest point. In this month, revenue might dip to $411, occupancy could drop to 18.1%, and ADRs may adjust down to $74.
- Understanding both the seasonal averages and these monthly peaks and troughs in revenue, occupancy, and ADR is crucial for maximizing your Airbnb profit potential in Fiuggi.
Seasonal Strategies for Maximizing Profit
- Peak Season: Maximize revenue through premium pricing and potentially longer minimum stays. Ensure high availability.
- Low Season: Offer competitive pricing, special promotions (e.g., extended stay discounts), and flexible cancellation policies. Target off-season travelers like remote workers or budget-conscious guests.
- Shoulder Seasons: Implement dynamic pricing that balances peak and low rates. Target weekend travelers or specific events. Offer slightly more flexible terms than peak season.
- Regularly analyze your own performance against these Fiuggi seasonality benchmarks and adjust your pricing and availability strategy accordingly.
Best Areas for Airbnb Investment in Fiuggi (2025)
Exploring the top neighborhoods for short-term rentals in Fiuggi? This section highlights key areas, outlining why they are attractive for hosts and guests, along with notable local attractions. Consider these locations based on your target guest profile and investment strategy.
| Neighborhood / Area | Why Host Here? (Target Guests & Appeal) | Key Attractions & Landmarks |
|---|---|---|
| Centro Storico | The historical center is the heart of Fiuggi, filled with charming streets, shops, and restaurants, attracting tourists seeking culture and history. | Fiuggi's historic thermal baths, Palazzo Conti, Fiuggi Castle, Piazza Spada |
| Terme di Fiuggi | Famous for its therapeutic mineral springs, this area attracts health-conscious visitors looking for relaxation and wellness retreats. | Fiuggi Thermal Spa, Wellness centers, Natural parks, Botanical Garden |
| Parco Regionale dei Monti Simbruini | This regional park offers natural beauty and outdoor activities like hiking and biking, appealing to nature lovers. | Hiking trails, Scenic viewpoints, Wildlife |
| Fiuggi Golf Club | Golf lovers are drawn to this area for its beautiful courses and serene landscape, making it a prime spot for a relaxed stay. | 18-hole golf course, Clubhouse, Golf lessons |
| Sorgenti di Fiuggi | Known for its natural spring waters, this area attracts visitors looking for wellness and spa experiences. | Natural springs, Spa resorts, Walking paths |
| Froshenato | A quiet residential area that offers a more authentic Italian experience, perfect for families and those wanting a peaceful stay. | Local markets, Traditional cuisine, Scenic views |
| Colli di Fiano | This rural area is known for its beautiful hills and vineyards, attracting wine lovers and those seeking tranquility. | Vineyards, Wine tasting, Hiking paths |
| Local Festivals | Fiuggi hosts various festivals throughout the year, which attract tourists and create a lively atmosphere, perfect for short-term rentals. | Fiuggi Summer Festival, Craft fairs, Culinary events |
Understanding Airbnb License Requirements & STR Laws in Fiuggi (2025)
Yes, Fiuggi, Lazio, Italy enforces high STR regulations. Obtaining a license and ensuring compliance is almost certainly required according to current 2025 STR laws. Always verify the latest short term rental regulations and Airbnb license requirements directly with local government authorities for Fiuggi to ensure full compliance before hosting.
(Source: AirROI data, 2025, based on 32% licensed listings)
Top Performing Airbnb Properties in Fiuggi (2025)
Benchmark your potential! Explore examples of top-performing Airbnb properties in Fiuggibased on Trailing Twelve Month (TTM) revenue. Analyze their characteristics, revenue, occupancy rate, and ADR to understand what drives success in this market.
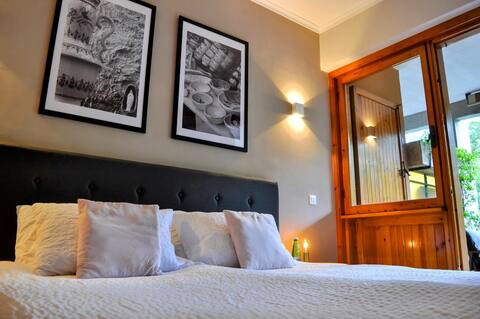
Nature, forest, Golf, Terme, 2 bd, Wi-fi, Netflix
Entire Place • 2 bedrooms
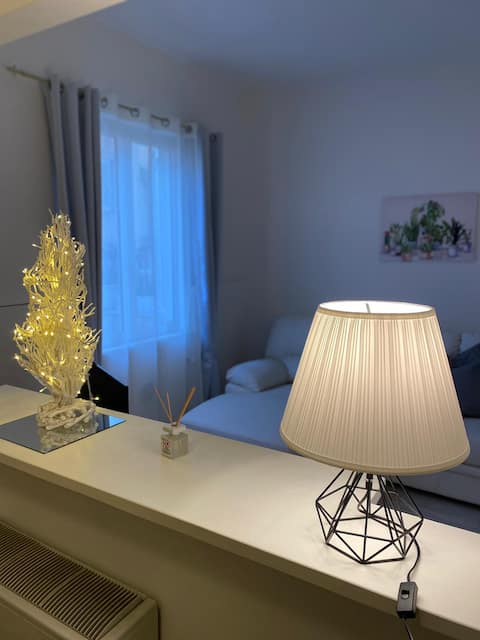
My Suite Fiuggi
Entire Place • 1 bedroom
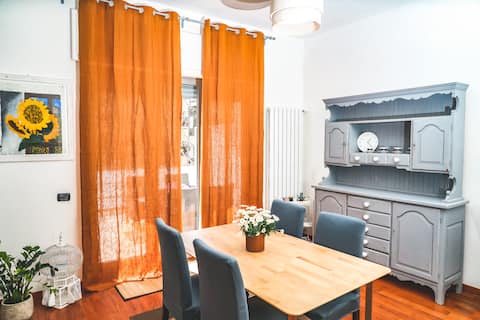
Althea Home
Entire Place • 1 bedroom
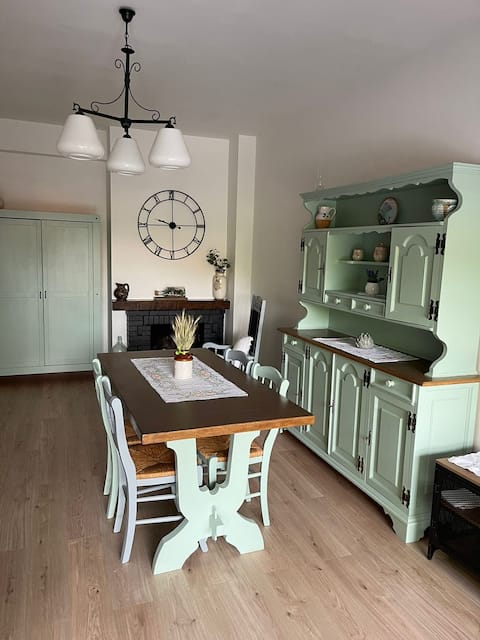
Belappart
Entire Place • 1 bedroom
Exclusive Mini Jacuzzi Apartment
Private Room • N/A
Appartamento nuovo con vista
Entire Place • 2 bedrooms
Note: Performance varies based on location, size, amenities, seasonality, and management quality. Data reflects the past 12 months.
Top Performing Airbnb Hosts in Fiuggi (2025)
Learn from the best! This table showcases top-performing Airbnb hosts in Fiuggi based on the number of properties managed and estimated total revenue over the past year. Analyze their scale and performance metrics.
| Host Name | Properties | Grossing Revenue | Stay Reviews | Avg Rating |
|---|---|---|---|---|
| Dan | 1 | $20,261 | 14 | 4.93/5.0 |
| Alessandro | 1 | $12,465 | 18 | 4.89/5.0 |
| Federica | 1 | $11,672 | 12 | 5.00/5.0 |
| Ella | 1 | $10,930 | 9 | 4.67/5.0 |
| Fabrizio | 1 | $10,143 | 14 | 4.64/5.0 |
| Host #523174270 | 1 | $9,320 | 0 | 0.00/5.0 |
| Porzia | 1 | $9,058 | 19 | 4.95/5.0 |
| Host #340183907 | 1 | $7,295 | 2 | 0.00/5.0 |
| Doug | 2 | $6,673 | 14 | 4.75/5.0 |
| Host #172136493 | 1 | $6,615 | 1 | 0.00/5.0 |
Analyzing the strategies of top hosts, such as their property selection, pricing, and guest communication, can offer valuable lessons for optimizing your own Airbnb operations in Fiuggi.
Dive Deeper: Advanced Fiuggi STR Market Data (2025)
Ready to unlock more insights? AirROI provides access to advanced metrics and comprehensive Airbnb data for Fiuggi. Explore detailed analytics beyond this report to refine your investment strategy, optimize pricing, and maximize your vacation rental profits.
Explore Advanced MetricsFiuggi Short-Term Rental Market Composition (2025): Property & Room Types
Room Type Distribution
Property Type Distribution
Market Composition Insights for Fiuggi
- The Fiuggi Airbnb market composition is heavily skewed towards Entire Home/Apt listings, which make up 92% of the 25 active rentals. This indicates strong guest preference for privacy and space.
- Looking at the property type distribution in Fiuggi, Apartment/Condo properties are the most common (84%), reflecting the local real estate landscape.
- Smaller segments like hotel/boutique (combined 4.0%) offer potential for unique stay experiences.
Fiuggi Airbnb Room Capacity Analysis (2025): Bedroom Distribution
Distribution of Listings by Number of Bedrooms
Room Capacity Insights for Fiuggi
- The dominant room capacity in Fiuggi is 1 bedroom listings, making up 64% of the market. This suggests a strong demand for properties suitable for couples or solo travelers.
- Together, 1 bedroom and 2 bedrooms properties represent 88.0% of the active Airbnb listings in Fiuggi, indicating a high concentration in these sizes.
- With over half the market (64%) consisting of studios or 1-bedroom units, Fiuggi is particularly well-suited for individuals or couples.
- Listings with 3+ bedrooms (8.0%) represent a smaller niche, potentially indicating an underserved market for larger group accommodations in Fiuggi.
Fiuggi Vacation Rental Guest Capacity Trends (2025)
Distribution of Listings by Guest Capacity
Guest Capacity Insights for Fiuggi
- The most common guest capacity trend in Fiuggi vacation rentals is listings accommodating 3 guests (44%). This suggests the primary traveler segment is likely small families or groups.
- Properties designed for 3 guests and 4 guests dominate the Fiuggi STR market, accounting for 80.0% of listings.
- Listings for large groups (6+ guests) are relatively rare (4.0%), potentially indicating an opportunity for hosts targeting this segment in Fiuggi.
- On average, properties in Fiuggi are equipped to host 3.6 guests.
Fiuggi Airbnb Booking Patterns (2025): Available vs. Booked Days
Available Days Distribution
Booked Days Distribution
Booking Pattern Insights for Fiuggi
- The most common availability pattern in Fiuggi falls within the 271-366 days range, representing 72% of listings. This suggests many properties have significant open periods on their calendars.
- Approximately 96.0% of listings show high availability (181+ days open annually), indicating potential for increased bookings or specific owner usage patterns.
- For booked days, the 31-90 days range is most frequent in Fiuggi (52%), reflecting common guest stay durations or potential owner blocking patterns.
- A notable 4.0% of properties secure long booking periods (181+ days booked per year), highlighting successful long-term rental strategies or significant owner usage.
Fiuggi Airbnb Minimum Stay Requirements Analysis
Distribution of Listings by Minimum Night Requirement
1 Night
6 listings
26.1% of total
2 Nights
9 listings
39.1% of total
3 Nights
3 listings
13% of total
7-29 Nights
4 listings
17.4% of total
30+ Nights
1 listings
4.3% of total
Key Insights
- The most prevalent minimum stay requirement in Fiuggi is 2 Nights, adopted by 39.1% of listings. This highlights the market's preference for shorter, flexible bookings.
- A strong majority (65.2%) of the Fiuggi Airbnb data shows acceptance of very short stays (1-2 nights), indicating a dynamic, high-turnover market.
Recommendations
- Align with the market by considering a 2 Nights minimum stay, as 39.1% of Fiuggi hosts use this setting.
- If feasible, allowing 1-night stays, especially midweek or during low season, could capture last-minute bookings, as only 26.1% currently do.
- Adjust minimum nights based on seasonality – potentially shorter during low season and longer during peak demand periods in Fiuggi.
Fiuggi Airbnb Cancellation Policy Trends Analysis (2025)
Flexible
8 listings
47.1% of total
Moderate
6 listings
35.3% of total
Strict
3 listings
17.6% of total
Cancellation Policy Insights for Fiuggi
- The prevailing Airbnb cancellation policy trend in Fiuggi is Flexible, used by 47.1% of listings.
- The market strongly favors guest-friendly terms, with 82.4% of listings offering Flexible or Moderate policies. This suggests guests in Fiuggi may expect booking flexibility.
Recommendations for Hosts
- Consider adopting a Flexible policy to align with the 47.1% market standard in Fiuggi.
- Regularly review your cancellation policy against competitors and market demand shifts in Fiuggi.
Fiuggi STR Booking Lead Time Analysis (2025)
Average Booking Lead Time by Month
Booking Lead Time Insights for Fiuggi
- The overall average booking lead time for vacation rentals in Fiuggi is 57 days.
- Guests book furthest in advance for stays during April (average 105 days), likely coinciding with peak travel demand or local events.
- The shortest booking windows occur for stays in March (average 11 days), indicating more last-minute travel plans during this time.
- Seasonally, Spring (70 days avg.) sees the longest lead times, while Winter (34 days avg.) has the shortest, reflecting typical travel planning cycles.
Recommendations for Hosts
- Use the overall average lead time (57 days) as a baseline for your pricing and availability strategy in Fiuggi.
- For April stays, consider implementing length-of-stay discounts or slightly higher rates for bookings made less than 105 days out to capitalize on advance planning.
- During March, focus on last-minute booking availability and promotions, as guests book with very short notice (11 days avg.).
- Target marketing efforts for the Spring season well in advance (at least 70 days) to capture early planners.
- Monitor your own booking lead times against these Fiuggi averages to identify opportunities for dynamic pricing adjustments.
Popular & Essential Airbnb Amenities in Fiuggi (2025)
Amenity Prevalence
Amenity Insights for Fiuggi
- Essential amenities in Fiuggi that guests expect include: TV. Lacking these (this) could significantly impact bookings.
- Popular amenities like Wifi, Hot water, Kitchen are common but not universal. Offering these can provide a competitive edge.
- Warning: Wifi is not universally provided but is considered essential globally. Ensure reliable Wifi is offered.
Recommendations for Hosts
- Ensure your listing includes all essential amenities for Fiuggi: TV.
- Consider adding popular differentiators like Wifi or Hot water to increase appeal.
- Highlight unique or less common amenities you offer (e.g., hot tub, dedicated workspace, EV charger) in your listing description and photos.
- Regularly check competitor amenities in Fiuggi to stay competitive.
Fiuggi Airbnb Guest Demographics & Profile Analysis (2025)
Guest Profile Summary for Fiuggi
- The typical guest profile for Airbnb in Fiuggi consists of a mix of domestic (55%) and international guests, often arriving from nearby Rome, typically belonging to the Post-2000s (Gen Z/Alpha) group (50%), primarily speaking English or Italian.
- Domestic travelers account for 54.9% of guests.
- Key international markets include Italy (54.9%) and United States (11.8%).
- Top languages spoken are English (32.4%) followed by Italian (23.5%).
- A significant demographic segment is the Post-2000s (Gen Z/Alpha) group, representing 50% of guests.
Recommendations for Hosts
- Balance marketing efforts between domestic and international channels based on the guest mix.
- Tailor amenities and listing descriptions to appeal to the dominant Post-2000s (Gen Z/Alpha) demographic (e.g., highlight fast WiFi, smart home features, local guides).
- Highlight unique local experiences or amenities relevant to the primary guest profile.
- Consider seasonal promotions aligned with peak travel times for key origin markets.
Nearby Short-Term Rental Market Comparison
How does the Fiuggi Airbnb market stack up against its neighbors? Compare key performance metrics like average monthly revenue, ADR, and occupancy rates in surrounding areas to understand the broader regional STR landscape.
| Market | Active Properties | Monthly Revenue | Daily Rate | Avg. Occupancy |
|---|---|---|---|---|
| Positano | 683 | $6,671 | $624.23 | 53% |
| Praiano | 331 | $4,415 | $403.56 | 55% |
| Conca dei Marini | 112 | $4,308 | $395.84 | 53% |
| Capri | 423 | $3,942 | $586.54 | 41% |
| Sorrento | 1,475 | $3,702 | $325.69 | 50% |
| Amalfi | 463 | $3,284 | $317.75 | 48% |
| Massa Lubrense | 832 | $3,255 | $413.33 | 45% |
| Ravello | 261 | $3,201 | $317.16 | 47% |
| Furore | 141 | $3,098 | $340.51 | 51% |
| Rome | 23,290 | $2,898 | $208.87 | 51% |