Cori Airbnb Market Analysis 2025: Short Term Rental Data & Vacation Rental Statistics in Lazio, Italy
Is Airbnb profitable in Cori in 2025? Explore comprehensive Airbnb analytics for Cori, Lazio, Italy to uncover income potential. This 2025 STR market report for Cori, based on AirROI data from April 2024 to March 2025, reveals key trends in the niche market of 20 active listings.
Whether you're considering an Airbnb investment in Cori, optimizing your existing vacation rental, or exploring rental arbitrage opportunities, understanding the Cori Airbnb data is crucial. Understanding the local regulations is key to maximizing your short term rental income potential. Let's dive into the specifics.
Key Cori Airbnb Performance Metrics Overview
Monthly Airbnb Revenue Variations & Income Potential in Cori (2025)
Understanding the monthly revenue variations for Airbnb listings in Cori is key to maximizing your short term rental income potential. Seasonality significantly impacts earnings. Our analysis, based on data from the past 12 months, shows that the peak revenue month for STRs in Cori is typically April, while March often presents the lowest earnings, highlighting opportunities for strategic pricing adjustments during shoulder and low seasons. Explore the typical Airbnb income in Cori across different performance tiers:
- Best-in-class properties (Top 10%) achieve $3,024+ monthly, often utilizing dynamic pricing and superior guest experiences.
- Strong performing properties (Top 25%) earn $1,787 or more, indicating effective management and desirable locations/amenities.
- Typical properties (Median) generate around $663 per month, representing the average market performance.
- Entry-level properties (Bottom 25%) see earnings around $311, often with potential for optimization.
Average Monthly Airbnb Earnings Trend in Cori
Cori Airbnb Occupancy Rate Trends (2025)
Maximize your bookings by understanding the Cori STR occupancy trends. Seasonal demand shifts significantly influence how often properties are booked. Typically, Aprilsees the highest demand (peak season occupancy), while December experiences the lowest (low season). Effective strategies, like adjusting minimum stays or offering promotions, can boost occupancy during slower periods. Here's how different property tiers perform in Cori:
- Best-in-class properties (Top 10%) achieve 54%+ occupancy, indicating high desirability and potentially optimized availability.
- Strong performing properties (Top 25%) maintain 42% or higher occupancy, suggesting good market fit and guest satisfaction.
- Typical properties (Median) have an occupancy rate around 23%.
- Entry-level properties (Bottom 25%) average 9% occupancy, potentially facing higher vacancy.
Average Monthly Occupancy Rate Trend in Cori
Average Daily Rate (ADR) Airbnb Trends in Cori (2025)
Effective short term rental pricing strategy in Cori involves understanding monthly ADR fluctuations. The Average Daily Rate (ADR) for Airbnb in Cori typically peaks in November and dips lowest during October. Leveraging Airbnb dynamic pricing tools or strategies based on this seasonality can significantly boost revenue. Here's a look at the typical nightly rates achieved:
- Best-in-class properties (Top 10%) command rates of $255+ per night, often due to premium features or locations.
- Strong performing properties (Top 25%) achieve nightly rates of $165 or more.
- Typical properties (Median) charge around $88 per night.
- Entry-level properties (Bottom 25%) earn around $53 per night.
Average Daily Rate (ADR) Trend by Month in Cori
Get Live Cori Market Intelligence 👇

Explore Real-time Analytics
Airbnb Seasonality Analysis & Trends in Cori (2025)
Peak Season (April, August, May)
- Revenue averages $2,117 per month
- Occupancy rates average 41.9%
- Daily rates average $123
Shoulder Season
- Revenue averages $1,043 per month
- Occupancy maintains around 26.5%
- Daily rates hold near $124
Low Season (January, March, December)
- Revenue drops to average $542 per month
- Occupancy decreases to average 17.6%
- Daily rates adjust to average $125
Seasonality Insights for Cori
- The Airbnb seasonality in Cori shows highly seasonal trends requiring careful strategy. While the sections above show seasonal averages, it's also insightful to look at the extremes:
- During the high season, the absolute peak month showcases Cori's highest earning potential, with monthly revenues capable of climbing to $2,523, occupancy reaching a high of 61.1%, and ADRs peaking at $137.
- Conversely, the slowest single month of the year, typically falling within the low season, marks the market's lowest point. In this month, revenue might dip to $511, occupancy could drop to 16.4%, and ADRs may adjust down to $116.
- Understanding both the seasonal averages and these monthly peaks and troughs in revenue, occupancy, and ADR is crucial for maximizing your Airbnb profit potential in Cori.
Seasonal Strategies for Maximizing Profit
- Peak Season: Maximize revenue through premium pricing and potentially longer minimum stays. Ensure high availability.
- Low Season: Offer competitive pricing, special promotions (e.g., extended stay discounts), and flexible cancellation policies. Target off-season travelers like remote workers or budget-conscious guests.
- Shoulder Seasons: Implement dynamic pricing that balances peak and low rates. Target weekend travelers or specific events. Offer slightly more flexible terms than peak season.
- Regularly analyze your own performance against these Cori seasonality benchmarks and adjust your pricing and availability strategy accordingly.
Best Areas for Airbnb Investment in Cori (2025)
Exploring the top neighborhoods for short-term rentals in Cori? This section highlights key areas, outlining why they are attractive for hosts and guests, along with notable local attractions. Consider these locations based on your target guest profile and investment strategy.
| Neighborhood / Area | Why Host Here? (Target Guests & Appeal) | Key Attractions & Landmarks |
|---|---|---|
| Centro Storico | The historical center of Cori, rich in ancient architecture and charming streets. A must-see for visitors interested in history and culture, making it an ideal spot for Airbnb guests. | Cori Cathedral, Santa Maria della Pietà, Piazza Signina, Ancient Roman Cisterns, Historical museums |
| Cori Monticano | A scenic area with stunning views of the Monti Lepini, perfect for nature lovers and those seeking tranquility. Ideal for guests looking for hiking and outdoor activities. | Monti Lepini Park, Hiking trails, Beautiful landscapes, Local wineries |
| Porta Romana | A quaint neighborhood with local shops and eateries, providing an authentic Italian experience. Great for tourists who want to immerse themselves in the local lifestyle. | Local gastronomy, Artisan shops, Parks and squares |
| Via della Libertà | A vibrant street lined with cafes and businesses, close to many attractions. Attractive for guests looking for urban experiences and local dining. | Cafe culture, Shopping, Close to public transportation |
| Contrada Acqua Santa | A peaceful residential area with beautiful views, appealing to families and longer-term stays. Offers a relaxing atmosphere away from the hustle and bustle. | Family-friendly environment, Nature views, Local parks |
| Historic Vineyards | Cori is known for its wine production. This area appeals to wine enthusiasts and tourists interested in wine tours and tastings. | Winery tours, Wine tasting events, Grape harvest festivals |
| Cori Festival Grounds | Home to various cultural events and festivals throughout the year. Attractive for guests visiting during festival seasons to experience local traditions and celebrations. | Annual festivals, Local performances, Craft markets |
| Villaggio-Infernetto | A residential area that offers visitors a slice of local life and access to amenities. Suitable for those seeking a home-like stay. | Community events, Local farmers' markets, Parks |
Understanding Airbnb License Requirements & STR Laws in Cori (2025)
With 25% of listings showing registration in 2025, understanding potential Airbnb license requirements is crucial in Cori. Always verify the latest short term rental regulations and Airbnb license requirements directly with local government authorities for Cori to ensure full compliance before hosting.
(Source: AirROI data, 2025, based on 25% licensed listings)
Top Performing Airbnb Properties in Cori (2025)
Benchmark your potential! Explore examples of top-performing Airbnb properties in Coribased on Trailing Twelve Month (TTM) revenue. Analyze their characteristics, revenue, occupancy rate, and ADR to understand what drives success in this market.
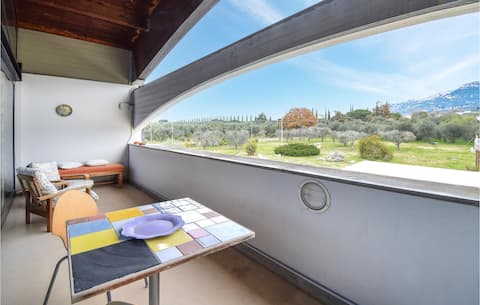
Beautiful apartment in Cori with WiFi
Entire Place • 2 bedrooms

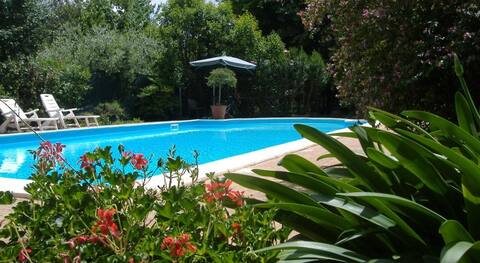
Villa with swimmingpool "Holiday Home Collesanti"
Entire Place • 4 bedrooms
A dip in the greenery
Entire Place • 2 bedrooms
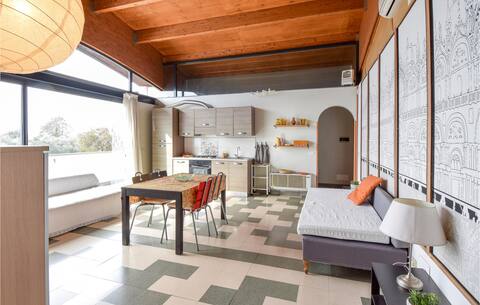
Gorgeous apartment in Cori with kitchen
Entire Place • 2 bedrooms
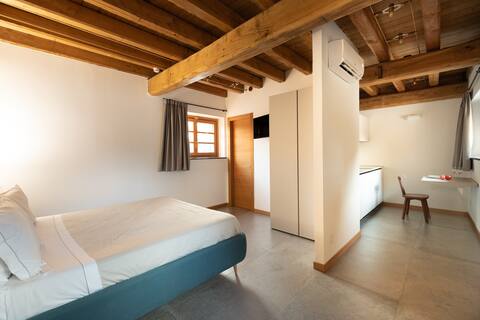
Visita Roma e Napoli senza dover cambiare Relais
Private Room • 1 bedroom

Mare o montagna? Scegli la serenità della campagna
Private Room • 1 bedroom
Note: Performance varies based on location, size, amenities, seasonality, and management quality. Data reflects the past 12 months.
Top Performing Airbnb Hosts in Cori (2025)
Learn from the best! This table showcases top-performing Airbnb hosts in Cori based on the number of properties managed and estimated total revenue over the past year. Analyze their scale and performance metrics.
| Host Name | Properties | Grossing Revenue | Stay Reviews | Avg Rating |
|---|---|---|---|---|
| Host #153920869 | 2 | $38,305 | 3 | 0.00/5.0 |
| Host #469760717 | 5 | $32,149 | 1 | 0.00/5.0 |
| Francesca | 1 | $19,591 | 51 | 4.84/5.0 |
| Dina | 1 | $16,790 | 4 | 5.00/5.0 |
| Host #471792088 | 2 | $10,016 | 5 | 2.50/5.0 |
| Kjeld | 2 | $5,648 | 12 | 3.83/5.0 |
| Marisa | 1 | $4,576 | 61 | 4.98/5.0 |
| Fabio | 1 | $3,465 | 8 | 4.88/5.0 |
| Virginia | 1 | $2,357 | 18 | 4.89/5.0 |
| Enrico | 1 | $1,826 | 8 | 4.75/5.0 |
Analyzing the strategies of top hosts, such as their property selection, pricing, and guest communication, can offer valuable lessons for optimizing your own Airbnb operations in Cori.
Dive Deeper: Advanced Cori STR Market Data (2025)
Ready to unlock more insights? AirROI provides access to advanced metrics and comprehensive Airbnb data for Cori. Explore detailed analytics beyond this report to refine your investment strategy, optimize pricing, and maximize your vacation rental profits.
Explore Advanced MetricsCori Short-Term Rental Market Composition (2025): Property & Room Types
Room Type Distribution
Property Type Distribution
Market Composition Insights for Cori
- The Cori Airbnb market composition is heavily skewed towards Entire Home/Apt listings, which make up 55% of the 20 active rentals. This indicates strong guest preference for privacy and space.
- However, a notable 45% share for Private Rooms suggests opportunities for budget-conscious travelers or hosts renting out spare rooms.
- Looking at the property type distribution in Cori, Apartment/Condo properties are the most common (45%), reflecting the local real estate landscape.
- Houses represent a significant 20% portion, catering likely to families or larger groups.
- The presence of 35% Hotel/Boutique listings indicates integration with traditional hospitality.
Cori Airbnb Room Capacity Analysis (2025): Bedroom Distribution
Distribution of Listings by Number of Bedrooms
Room Capacity Insights for Cori
- The dominant room capacity in Cori is 1 bedroom listings, making up 45% of the market. This suggests a strong demand for properties suitable for couples or solo travelers.
- Together, 1 bedroom and 2 bedrooms properties represent 80.0% of the active Airbnb listings in Cori, indicating a high concentration in these sizes.
Cori Vacation Rental Guest Capacity Trends (2025)
Distribution of Listings by Guest Capacity
Guest Capacity Insights for Cori
- The most common guest capacity trend in Cori vacation rentals is listings accommodating 2 guests (25%). This suggests the primary traveler segment is likely couples or solo travelers.
- Properties designed for 2 guests and 4 guests dominate the Cori STR market, accounting for 45.0% of listings.
- 15.0% of properties accommodate 6+ guests, serving the market segment for larger families or group travel in Cori.
- On average, properties in Cori are equipped to host 3.8 guests.
Cori Airbnb Booking Patterns (2025): Available vs. Booked Days
Available Days Distribution
Booked Days Distribution
Booking Pattern Insights for Cori
- The most common availability pattern in Cori falls within the 271-366 days range, representing 80% of listings. This suggests many properties have significant open periods on their calendars.
- Approximately 100.0% of listings show high availability (181+ days open annually), indicating potential for increased bookings or specific owner usage patterns.
- For booked days, the 31-90 days range is most frequent in Cori (40%), reflecting common guest stay durations or potential owner blocking patterns.
Cori Airbnb Minimum Stay Requirements Analysis
Distribution of Listings by Minimum Night Requirement
1 Night
6 listings
33.3% of total
2 Nights
7 listings
38.9% of total
3 Nights
1 listings
5.6% of total
4-6 Nights
1 listings
5.6% of total
30+ Nights
3 listings
16.7% of total
Key Insights
- The most prevalent minimum stay requirement in Cori is 2 Nights, adopted by 38.9% of listings. This highlights the market's preference for shorter, flexible bookings.
- A strong majority (72.2%) of the Cori Airbnb data shows acceptance of very short stays (1-2 nights), indicating a dynamic, high-turnover market.
- A significant segment (16.7%) caters to monthly stays (30+ nights) in Cori, pointing to opportunities in the extended-stay market.
Recommendations
- Align with the market by considering a 2 Nights minimum stay, as 38.9% of Cori hosts use this setting.
- Explore offering discounts for stays of 30+ nights to attract the 16.7% of the market seeking extended stays.
- Adjust minimum nights based on seasonality – potentially shorter during low season and longer during peak demand periods in Cori.
Cori Airbnb Cancellation Policy Trends Analysis (2025)
Flexible
4 listings
36.4% of total
Moderate
2 listings
18.2% of total
Strict
5 listings
45.5% of total
Cancellation Policy Insights for Cori
- The prevailing Airbnb cancellation policy trend in Cori is Strict, used by 45.5% of listings.
- There's a relatively balanced mix between guest-friendly (54.6%) and stricter (45.5%) policies, offering choices for different guest needs.
Recommendations for Hosts
- Consider adopting a Strict policy to align with the 45.5% market standard in Cori.
- With 45.5% using Strict terms, this is a viable option in Cori, particularly for high-value properties or during peak demand periods.
- Regularly review your cancellation policy against competitors and market demand shifts in Cori.
Cori STR Booking Lead Time Analysis (2025)
Average Booking Lead Time by Month
Booking Lead Time Insights for Cori
- The overall average booking lead time for vacation rentals in Cori is 39 days.
- Guests book furthest in advance for stays during June (average 95 days), likely coinciding with peak travel demand or local events.
- The shortest booking windows occur for stays in March (average 13 days), indicating more last-minute travel plans during this time.
- Seasonally, Summer (67 days avg.) sees the longest lead times, while Winter (46 days avg.) has the shortest, reflecting typical travel planning cycles.
Recommendations for Hosts
- Use the overall average lead time (39 days) as a baseline for your pricing and availability strategy in Cori.
- For June stays, consider implementing length-of-stay discounts or slightly higher rates for bookings made less than 95 days out to capitalize on advance planning.
- During March, focus on last-minute booking availability and promotions, as guests book with very short notice (13 days avg.).
- Target marketing efforts for the Summer season well in advance (at least 67 days) to capture early planners.
- Monitor your own booking lead times against these Cori averages to identify opportunities for dynamic pricing adjustments.
Popular & Essential Airbnb Amenities in Cori (2025)
Amenity Prevalence
Amenity Insights for Cori
- Essential amenities in Cori that guests expect include: Kitchen, Essentials, Heating, Washer. Lacking these (any) could significantly impact bookings.
- Popular amenities like TV, Wifi, Hangers are common but not universal. Offering these can provide a competitive edge.
- Warning: Wifi is not universally provided but is considered essential globally. Ensure reliable Wifi is offered.
Recommendations for Hosts
- Ensure your listing includes all essential amenities for Cori: Kitchen, Essentials, Heating, Washer.
- Prioritize adding missing essentials: Washer.
- Consider adding popular differentiators like TV or Wifi to increase appeal.
- Highlight unique or less common amenities you offer (e.g., hot tub, dedicated workspace, EV charger) in your listing description and photos.
- Regularly check competitor amenities in Cori to stay competitive.
Cori Airbnb Guest Demographics & Profile Analysis (2025)
Guest Profile Summary for Cori
- The typical guest profile for Airbnb in Cori consists of predominantly international visitors (68%), with top international origins including France, typically belonging to the Post-2000s (Gen Z/Alpha) group (50%), primarily speaking English or German.
- Domestic travelers account for 32.0% of guests.
- Key international markets include Italy (32%) and France (14%).
- Top languages spoken are English (37%) followed by German (15.1%).
- A significant demographic segment is the Post-2000s (Gen Z/Alpha) group, representing 50% of guests.
Recommendations for Hosts
- Focus marketing internationally, particularly towards travelers from France.
- Tailor amenities and listing descriptions to appeal to the dominant Post-2000s (Gen Z/Alpha) demographic (e.g., highlight fast WiFi, smart home features, local guides).
- Highlight unique local experiences or amenities relevant to the primary guest profile.
- Consider seasonal promotions aligned with peak travel times for key origin markets.
Nearby Short-Term Rental Market Comparison
How does the Cori Airbnb market stack up against its neighbors? Compare key performance metrics like average monthly revenue, ADR, and occupancy rates in surrounding areas to understand the broader regional STR landscape.
| Market | Active Properties | Monthly Revenue | Daily Rate | Avg. Occupancy |
|---|---|---|---|---|
| Rome | 23,290 | $2,898 | $208.87 | 51% |
| Collazzone | 28 | $2,839 | $341.11 | 36% |
| Parrano | 18 | $2,762 | $329.95 | 34% |
| Monte Castello di Vibio | 18 | $2,659 | $567.21 | 41% |
| Guardea | 15 | $2,542 | $320.56 | 35% |
| Monteleone d'Orvieto | 31 | $2,537 | $306.96 | 36% |
| Lugnano in Teverina | 19 | $2,238 | $267.38 | 35% |
| San Casciano dei Bagni | 56 | $2,235 | $415.84 | 35% |
| Collevecchio | 12 | $2,213 | $302.16 | 38% |
| Palombara Sabina | 16 | $2,160 | $336.01 | 35% |