Bagnoregio Airbnb Market Analysis 2025: Short Term Rental Data & Vacation Rental Statistics in Lazio, Italy
Is Airbnb profitable in Bagnoregio in 2025? Explore comprehensive Airbnb analytics for Bagnoregio, Lazio, Italy to uncover income potential. This 2025 STR market report for Bagnoregio, based on AirROI data from April 2024 to March 2025, reveals key trends in the niche market of 92 active listings.
Whether you're considering an Airbnb investment in Bagnoregio, optimizing your existing vacation rental, or exploring rental arbitrage opportunities, understanding the Bagnoregio Airbnb data is crucial. Navigating the high regulation landscape is key to maximizing your short term rental income potential. Let's dive into the specifics.
Key Bagnoregio Airbnb Performance Metrics Overview
Monthly Airbnb Revenue Variations & Income Potential in Bagnoregio (2025)
Understanding the monthly revenue variations for Airbnb listings in Bagnoregio is key to maximizing your short term rental income potential. Seasonality significantly impacts earnings. Our analysis, based on data from the past 12 months, shows that the peak revenue month for STRs in Bagnoregio is typically August, while February often presents the lowest earnings, highlighting opportunities for strategic pricing adjustments during shoulder and low seasons. Explore the typical Airbnb income in Bagnoregio across different performance tiers:
- Best-in-class properties (Top 10%) achieve $3,581+ monthly, often utilizing dynamic pricing and superior guest experiences.
- Strong performing properties (Top 25%) earn $2,066 or more, indicating effective management and desirable locations/amenities.
- Typical properties (Median) generate around $953 per month, representing the average market performance.
- Entry-level properties (Bottom 25%) see earnings around $434, often with potential for optimization.
Average Monthly Airbnb Earnings Trend in Bagnoregio
Bagnoregio Airbnb Occupancy Rate Trends (2025)
Maximize your bookings by understanding the Bagnoregio STR occupancy trends. Seasonal demand shifts significantly influence how often properties are booked. Typically, Augustsees the highest demand (peak season occupancy), while January experiences the lowest (low season). Effective strategies, like adjusting minimum stays or offering promotions, can boost occupancy during slower periods. Here's how different property tiers perform in Bagnoregio:
- Best-in-class properties (Top 10%) achieve 62%+ occupancy, indicating high desirability and potentially optimized availability.
- Strong performing properties (Top 25%) maintain 44% or higher occupancy, suggesting good market fit and guest satisfaction.
- Typical properties (Median) have an occupancy rate around 23%.
- Entry-level properties (Bottom 25%) average 11% occupancy, potentially facing higher vacancy.
Average Monthly Occupancy Rate Trend in Bagnoregio
Average Daily Rate (ADR) Airbnb Trends in Bagnoregio (2025)
Effective short term rental pricing strategy in Bagnoregio involves understanding monthly ADR fluctuations. The Average Daily Rate (ADR) for Airbnb in Bagnoregio typically peaks in November and dips lowest during April. Leveraging Airbnb dynamic pricing tools or strategies based on this seasonality can significantly boost revenue. Here's a look at the typical nightly rates achieved:
- Best-in-class properties (Top 10%) command rates of $438+ per night, often due to premium features or locations.
- Strong performing properties (Top 25%) achieve nightly rates of $201 or more.
- Typical properties (Median) charge around $118 per night.
- Entry-level properties (Bottom 25%) earn around $85 per night.
Average Daily Rate (ADR) Trend by Month in Bagnoregio
Get Live Bagnoregio Market Intelligence 👇

Explore Real-time Analytics
Airbnb Seasonality Analysis & Trends in Bagnoregio (2025)
Peak Season (August, July, May)
- Revenue averages $2,627 per month
- Occupancy rates average 39.7%
- Daily rates average $180
Shoulder Season
- Revenue averages $1,489 per month
- Occupancy maintains around 27.8%
- Daily rates hold near $182
Low Season (January, February, March)
- Revenue drops to average $757 per month
- Occupancy decreases to average 19.9%
- Daily rates adjust to average $185
Seasonality Insights for Bagnoregio
- The Airbnb seasonality in Bagnoregio shows highly seasonal trends requiring careful strategy. While the sections above show seasonal averages, it's also insightful to look at the extremes:
- During the high season, the absolute peak month showcases Bagnoregio's highest earning potential, with monthly revenues capable of climbing to $3,090, occupancy reaching a high of 45.3%, and ADRs peaking at $195.
- Conversely, the slowest single month of the year, typically falling within the low season, marks the market's lowest point. In this month, revenue might dip to $648, occupancy could drop to 18.3%, and ADRs may adjust down to $175.
- Understanding both the seasonal averages and these monthly peaks and troughs in revenue, occupancy, and ADR is crucial for maximizing your Airbnb profit potential in Bagnoregio.
Seasonal Strategies for Maximizing Profit
- Peak Season: Maximize revenue through premium pricing and potentially longer minimum stays. Ensure high availability.
- Low Season: Offer competitive pricing, special promotions (e.g., extended stay discounts), and flexible cancellation policies. Target off-season travelers like remote workers or budget-conscious guests.
- Shoulder Seasons: Implement dynamic pricing that balances peak and low rates. Target weekend travelers or specific events. Offer slightly more flexible terms than peak season.
- Regularly analyze your own performance against these Bagnoregio seasonality benchmarks and adjust your pricing and availability strategy accordingly.
Best Areas for Airbnb Investment in Bagnoregio (2025)
Exploring the top neighborhoods for short-term rentals in Bagnoregio? This section highlights key areas, outlining why they are attractive for hosts and guests, along with notable local attractions. Consider these locations based on your target guest profile and investment strategy.
| Neighborhood / Area | Why Host Here? (Target Guests & Appeal) | Key Attractions & Landmarks |
|---|---|---|
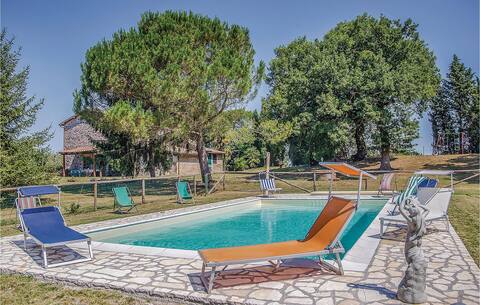
| Historic Center of Bagnoregio | A picturesque medieval town known for its unique cliffside location and stunning views. It's a sought-after destination for tourists exploring Italian history, offering a charming atmosphere and rich cultural experiences. | Civita di Bagnoregio, Bagnoregio's Cathedral, Piazza San Donato, Palazzo Mazzetti, Church of San Nicolò, Bagnoregio Lookout Point |
| Civita di Bagnoregio | Often referred to as the 'dying town', this enchanting village is famous for its fragile landscape and incredible architecture. It draws visitors interested in history, art, and breathtaking scenery further enhancing its appeal as an Airbnb destination. | Civita di Bagnoregio, Civita's Roman Theater, Etruscan Ruins, Mediterranean Views, Natural Park of Bagnoregio |
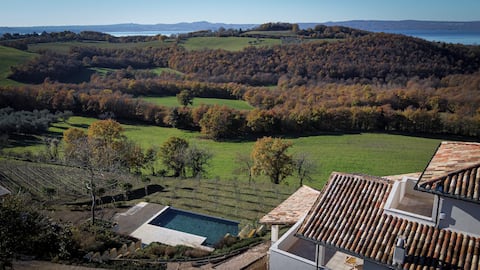
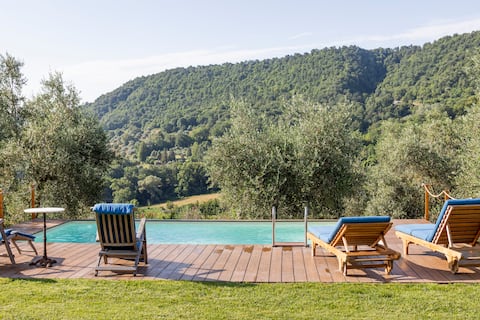
| Valley of Bagnoregio | This scenic valley surrounds Bagnoregio and offers a tranquil escape with beautiful landscapes and outdoor activities. Ideal for guests looking for nature and relaxation, making it a good choice for hosts catering to nature lovers. | Bagnoregio Nature Park, Hiking Trails, Wine Tasting Tours, Olive Groves, River Valley Views |
| Nearby Lago di Bolsena | One of the largest volcanic lakes in Europe, perfect for water sports and beach activities. Attracts families and tourists looking for a summer getaway, making it a valuable location for Airbnb hosts. | Beach Areas, Boat Rentals, Fishing, Lago di Bolsena Cycling Trails, Local Restaurants |
| Orvieto | Just a short drive away, this historic city is famous for its stunning cathedral and underground tunnels. A popular day trip option for guests staying in Bagnoregio, enhancing the area's appeal for Airbnb listings. | Orvieto Cathedral, St. Patrick's Well, Orvieto Underground, Orvieto's Historic Center, Duomo di Orvieto |
| Viterbo | A city known for its medieval architecture and hot springs, it offers a unique blend of history and relaxation. Its proximity to Bagnoregio makes it an attractive location for visitors looking to explore multiple destinations. | Palazzo dei Papi, Hot Springs, Viterbo Cathedral, Medieval Quarter, Etruscan Ruins |
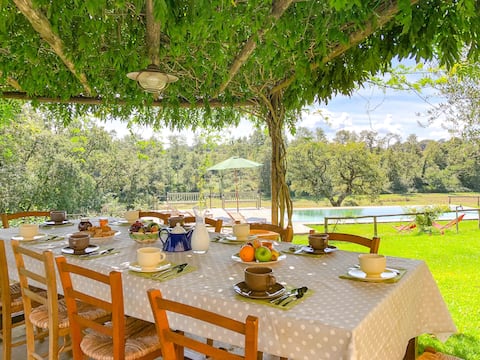
| Tuscia Region | Renowned for its beautiful landscapes, vineyards, and charming villages. This region attracts tourists seeking authentic Italian experiences and provides a great opportunity for Airbnb hosts. | Vineyard Tours, Local Cuisine, Charming Villages, Scenic Drives, Cultural Festivals |
| Cultural Events in Bagnoregio | Hosting numerous cultural events throughout the year, this area attracts individuals interested in art, music, and local traditions. Ideal for short-term stays during festival seasons. | Bagnoregio Festival, Art Exhibitions, Local Craft Fairs, Music Festivals, Traditional Food Festivals |
Understanding Airbnb License Requirements & STR Laws in Bagnoregio (2025)
Yes, Bagnoregio, Lazio, Italy enforces high STR regulations. Obtaining a license and ensuring compliance is almost certainly required according to current 2025 STR laws. Always verify the latest short term rental regulations and Airbnb license requirements directly with local government authorities for Bagnoregio to ensure full compliance before hosting.
(Source: AirROI data, 2025, based on 53% licensed listings)
Top Performing Airbnb Properties in Bagnoregio (2025)
Benchmark your potential! Explore examples of top-performing Airbnb properties in Bagnoregiobased on Trailing Twelve Month (TTM) revenue. Analyze their characteristics, revenue, occupancy rate, and ADR to understand what drives success in this market.
Maurizia
Entire Place • 6 bedrooms

Gorgeous home in Bagnoregio
Entire Place • 7 bedrooms
Luxueuze villa met infinity pool aan Bolsenameer
Entire Place • 8 bedrooms

L'Incanto di Civita (La Terrazza)
Entire Place • 1 bedroom
Sant'Anselmo
Entire Place • 2 bedrooms
Podere Campanella - A peaceful Retreat -
Entire Place • 4 bedrooms
Note: Performance varies based on location, size, amenities, seasonality, and management quality. Data reflects the past 12 months.
Top Performing Airbnb Hosts in Bagnoregio (2025)
Learn from the best! This table showcases top-performing Airbnb hosts in Bagnoregio based on the number of properties managed and estimated total revenue over the past year. Analyze their scale and performance metrics.
| Host Name | Properties | Grossing Revenue | Stay Reviews | Avg Rating |
|---|---|---|---|---|
| Chiara | 2 | $69,195 | 443 | 4.99/5.0 |
| Luigi | 3 | $67,252 | 334 | 4.93/5.0 |
| Novasol | 1 | $62,426 | 16 | 4.63/5.0 |
| Violante | 3 | $56,404 | 21 | 3.20/5.0 |
| Host #153912369 | 1 | $53,115 | 0 | 0.00/5.0 |
| Host #195673456 | 1 | $50,577 | 8 | 4.88/5.0 |
| Jannis | 1 | $48,944 | 24 | 4.96/5.0 |
| Lisa - Interhome Group | 10 | $46,650 | 101 | 4.30/5.0 |
| David | 4 | $34,635 | 20 | 3.65/5.0 |
| Giovanni | 6 | $33,773 | 6 | 0.83/5.0 |
Analyzing the strategies of top hosts, such as their property selection, pricing, and guest communication, can offer valuable lessons for optimizing your own Airbnb operations in Bagnoregio.
Dive Deeper: Advanced Bagnoregio STR Market Data (2025)
Ready to unlock more insights? AirROI provides access to advanced metrics and comprehensive Airbnb data for Bagnoregio. Explore detailed analytics beyond this report to refine your investment strategy, optimize pricing, and maximize your vacation rental profits.
Explore Advanced MetricsBagnoregio Short-Term Rental Market Composition (2025): Property & Room Types
Room Type Distribution
Property Type Distribution
Market Composition Insights for Bagnoregio
- The Bagnoregio Airbnb market composition is heavily skewed towards Entire Home/Apt listings, which make up 84.8% of the 92 active rentals. This indicates strong guest preference for privacy and space.
- Looking at the property type distribution in Bagnoregio, House properties are the most common (46.7%), reflecting the local real estate landscape.
- Houses represent a significant 46.7% portion, catering likely to families or larger groups.
- Smaller segments like hotel/boutique, others, outdoor/unique (combined 6.5%) offer potential for unique stay experiences.
Bagnoregio Airbnb Room Capacity Analysis (2025): Bedroom Distribution
Distribution of Listings by Number of Bedrooms
Room Capacity Insights for Bagnoregio
- The dominant room capacity in Bagnoregio is 1 bedroom listings, making up 39.1% of the market. This suggests a strong demand for properties suitable for couples or solo travelers.
- Together, 1 bedroom and 2 bedrooms properties represent 69.5% of the active Airbnb listings in Bagnoregio, indicating a high concentration in these sizes.
- A significant 22.8% of listings offer 3+ bedrooms, catering to larger groups and families seeking more space in Bagnoregio.
Bagnoregio Vacation Rental Guest Capacity Trends (2025)
Distribution of Listings by Guest Capacity
Guest Capacity Insights for Bagnoregio
- The most common guest capacity trend in Bagnoregio vacation rentals is listings accommodating 4 guests (26.1%). This suggests the primary traveler segment is likely small families or groups.
- Properties designed for 4 guests and 2 guests dominate the Bagnoregio STR market, accounting for 48.9% of listings.
- 30.4% of properties accommodate 6+ guests, serving the market segment for larger families or group travel in Bagnoregio.
- On average, properties in Bagnoregio are equipped to host 4.3 guests.
Bagnoregio Airbnb Booking Patterns (2025): Available vs. Booked Days
Available Days Distribution
Booked Days Distribution
Booking Pattern Insights for Bagnoregio
- The most common availability pattern in Bagnoregio falls within the 271-366 days range, representing 70.7% of listings. This suggests many properties have significant open periods on their calendars.
- Approximately 93.5% of listings show high availability (181+ days open annually), indicating potential for increased bookings or specific owner usage patterns.
- For booked days, the 31-90 days range is most frequent in Bagnoregio (39.1%), reflecting common guest stay durations or potential owner blocking patterns.
- A notable 6.5% of properties secure long booking periods (181+ days booked per year), highlighting successful long-term rental strategies or significant owner usage.
Bagnoregio Airbnb Minimum Stay Requirements Analysis
Distribution of Listings by Minimum Night Requirement
1 Night
43 listings
49.4% of total
2 Nights
14 listings
16.1% of total
3 Nights
9 listings
10.3% of total
4-6 Nights
2 listings
2.3% of total
7-29 Nights
15 listings
17.2% of total
30+ Nights
4 listings
4.6% of total
Key Insights
- The most prevalent minimum stay requirement in Bagnoregio is 1 Night, adopted by 49.4% of listings. This highlights the market's preference for shorter, flexible bookings.
- A strong majority (65.5%) of the Bagnoregio Airbnb data shows acceptance of very short stays (1-2 nights), indicating a dynamic, high-turnover market.
Recommendations
- Align with the market by considering a 1 Night minimum stay, as 49.4% of Bagnoregio hosts use this setting.
- Adjust minimum nights based on seasonality – potentially shorter during low season and longer during peak demand periods in Bagnoregio.
Bagnoregio Airbnb Cancellation Policy Trends Analysis (2025)
Super Strict 60 Days
1 listings
1.3% of total
Super Strict 30 Days
12 listings
15.6% of total
Flexible
26 listings
33.8% of total
Moderate
27 listings
35.1% of total
Strict
11 listings
14.3% of total
Cancellation Policy Insights for Bagnoregio
- The prevailing Airbnb cancellation policy trend in Bagnoregio is Moderate, used by 35.1% of listings.
- There's a relatively balanced mix between guest-friendly (68.9%) and stricter (14.3%) policies, offering choices for different guest needs.
Recommendations for Hosts
- Consider adopting a Moderate policy to align with the 35.1% market standard in Bagnoregio.
- Using a Strict policy might deter some guests, as only 14.3% of listings use it. Evaluate if potential revenue protection outweighs possible lower booking rates.
- Regularly review your cancellation policy against competitors and market demand shifts in Bagnoregio.
Bagnoregio STR Booking Lead Time Analysis (2025)
Average Booking Lead Time by Month
Booking Lead Time Insights for Bagnoregio
- The overall average booking lead time for vacation rentals in Bagnoregio is 58 days.
- Guests book furthest in advance for stays during June (average 91 days), likely coinciding with peak travel demand or local events.
- The shortest booking windows occur for stays in November (average 23 days), indicating more last-minute travel plans during this time.
- Seasonally, Summer (79 days avg.) sees the longest lead times, while Winter (34 days avg.) has the shortest, reflecting typical travel planning cycles.
Recommendations for Hosts
- Use the overall average lead time (58 days) as a baseline for your pricing and availability strategy in Bagnoregio.
- For June stays, consider implementing length-of-stay discounts or slightly higher rates for bookings made less than 91 days out to capitalize on advance planning.
- Target marketing efforts for the Summer season well in advance (at least 79 days) to capture early planners.
- Monitor your own booking lead times against these Bagnoregio averages to identify opportunities for dynamic pricing adjustments.
Popular & Essential Airbnb Amenities in Bagnoregio (2025)
Amenity Prevalence
Amenity Insights for Bagnoregio
- Essential amenities in Bagnoregio that guests expect include: Wifi, Kitchen. Lacking these (any) could significantly impact bookings.
- Popular amenities like Heating, TV, Hot water are common but not universal. Offering these can provide a competitive edge.
Recommendations for Hosts
- Ensure your listing includes all essential amenities for Bagnoregio: Wifi, Kitchen.
- Prioritize adding missing essentials: Wifi, Kitchen.
- Consider adding popular differentiators like Heating or TV to increase appeal.
- Highlight unique or less common amenities you offer (e.g., hot tub, dedicated workspace, EV charger) in your listing description and photos.
- Regularly check competitor amenities in Bagnoregio to stay competitive.
Bagnoregio Airbnb Guest Demographics & Profile Analysis (2025)
Guest Profile Summary for Bagnoregio
- The typical guest profile for Airbnb in Bagnoregio consists of predominantly international visitors (81%), with top international origins including Italy, typically belonging to the Post-2000s (Gen Z/Alpha) group (50%), primarily speaking English or Italian.
- Domestic travelers account for 18.6% of guests.
- Key international markets include United States (35.8%) and Italy (18.6%).
- Top languages spoken are English (49.9%) followed by Italian (13.3%).
- A significant demographic segment is the Post-2000s (Gen Z/Alpha) group, representing 50% of guests.
Recommendations for Hosts
- Focus marketing internationally, particularly towards travelers from Italy.
- Tailor amenities and listing descriptions to appeal to the dominant Post-2000s (Gen Z/Alpha) demographic (e.g., highlight fast WiFi, smart home features, local guides).
- Highlight unique local experiences or amenities relevant to the primary guest profile.
- Consider seasonal promotions aligned with peak travel times for key origin markets.
Nearby Short-Term Rental Market Comparison
How does the Bagnoregio Airbnb market stack up against its neighbors? Compare key performance metrics like average monthly revenue, ADR, and occupancy rates in surrounding areas to understand the broader regional STR landscape.
| Market | Active Properties | Monthly Revenue | Daily Rate | Avg. Occupancy |
|---|---|---|---|---|
| Tignano | 10 | $3,391 | $500.31 | 36% |
| Buonconvento | 59 | $3,068 | $456.70 | 46% |
| Rome | 23,290 | $2,898 | $208.87 | 51% |
| Collazzone | 28 | $2,839 | $341.11 | 36% |
| Florence | 9,598 | $2,833 | $208.48 | 52% |
| Marcialla | 25 | $2,788 | $236.61 | 54% |
| Parrano | 18 | $2,762 | $329.95 | 34% |
| Impruneta | 131 | $2,761 | $237.93 | 45% |
| Marciano della Chiana | 18 | $2,719 | $377.32 | 35% |
| Gaiole in Chianti | 206 | $2,679 | $344.49 | 39% |