Ventasso Airbnb Market Analysis 2025: Short Term Rental Data & Vacation Rental Statistics in Emilia-Romagna, Italy
Is Airbnb profitable in Ventasso in 2025? Explore comprehensive Airbnb analytics for Ventasso, Emilia-Romagna, Italy to uncover income potential. This 2025 STR market report for Ventasso, based on AirROI data from April 2024 to March 2025, reveals key trends in the niche market of 17 active listings.
Whether you're considering an Airbnb investment in Ventasso, optimizing your existing vacation rental, or exploring rental arbitrage opportunities, understanding the Ventasso Airbnb data is crucial. Understanding the local regulations is key to maximizing your short term rental income potential. Let's dive into the specifics.
Key Ventasso Airbnb Performance Metrics Overview
Monthly Airbnb Revenue Variations & Income Potential in Ventasso (2025)
Understanding the monthly revenue variations for Airbnb listings in Ventasso is key to maximizing your short term rental income potential. Seasonality significantly impacts earnings. Our analysis, based on data from the past 12 months, shows that the peak revenue month for STRs in Ventasso is typically May, while March often presents the lowest earnings, highlighting opportunities for strategic pricing adjustments during shoulder and low seasons. Explore the typical Airbnb income in Ventasso across different performance tiers:
- Best-in-class properties (Top 10%) achieve $1,673+ monthly, often utilizing dynamic pricing and superior guest experiences.
- Strong performing properties (Top 25%) earn $1,177 or more, indicating effective management and desirable locations/amenities.
- Typical properties (Median) generate around $475 per month, representing the average market performance.
- Entry-level properties (Bottom 25%) see earnings around $212, often with potential for optimization.
Average Monthly Airbnb Earnings Trend in Ventasso
Ventasso Airbnb Occupancy Rate Trends (2025)
Maximize your bookings by understanding the Ventasso STR occupancy trends. Seasonal demand shifts significantly influence how often properties are booked. Typically, Septembersees the highest demand (peak season occupancy), while June experiences the lowest (low season). Effective strategies, like adjusting minimum stays or offering promotions, can boost occupancy during slower periods. Here's how different property tiers perform in Ventasso:
- Best-in-class properties (Top 10%) achieve 44%+ occupancy, indicating high desirability and potentially optimized availability.
- Strong performing properties (Top 25%) maintain 35% or higher occupancy, suggesting good market fit and guest satisfaction.
- Typical properties (Median) have an occupancy rate around 17%.
- Entry-level properties (Bottom 25%) average 10% occupancy, potentially facing higher vacancy.
Average Monthly Occupancy Rate Trend in Ventasso
Average Daily Rate (ADR) Airbnb Trends in Ventasso (2025)
Effective short term rental pricing strategy in Ventasso involves understanding monthly ADR fluctuations. The Average Daily Rate (ADR) for Airbnb in Ventasso typically peaks in November and dips lowest during September. Leveraging Airbnb dynamic pricing tools or strategies based on this seasonality can significantly boost revenue. Here's a look at the typical nightly rates achieved:
- Best-in-class properties (Top 10%) command rates of $154+ per night, often due to premium features or locations.
- Strong performing properties (Top 25%) achieve nightly rates of $112 or more.
- Typical properties (Median) charge around $86 per night.
- Entry-level properties (Bottom 25%) earn around $64 per night.
Average Daily Rate (ADR) Trend by Month in Ventasso
Get Live Ventasso Market Intelligence 👇

Explore Real-time Analytics
Airbnb Seasonality Analysis & Trends in Ventasso (2025)
Peak Season (May, April, August)
- Revenue averages $1,021 per month
- Occupancy rates average 19.5%
- Daily rates average $98
Shoulder Season
- Revenue averages $757 per month
- Occupancy maintains around 26.1%
- Daily rates hold near $99
Low Season (February, March, June)
- Revenue drops to average $456 per month
- Occupancy decreases to average 19.8%
- Daily rates adjust to average $98
Seasonality Insights for Ventasso
- The Airbnb seasonality in Ventasso shows highly seasonal trends requiring careful strategy. While the sections above show seasonal averages, it's also insightful to look at the extremes:
- During the high season, the absolute peak month showcases Ventasso's highest earning potential, with monthly revenues capable of climbing to $1,061, occupancy reaching a high of 36.1%, and ADRs peaking at $101.
- Conversely, the slowest single month of the year, typically falling within the low season, marks the market's lowest point. In this month, revenue might dip to $343, occupancy could drop to 9.7%, and ADRs may adjust down to $97.
- Understanding both the seasonal averages and these monthly peaks and troughs in revenue, occupancy, and ADR is crucial for maximizing your Airbnb profit potential in Ventasso.
Seasonal Strategies for Maximizing Profit
- Peak Season: Maximize revenue through premium pricing and potentially longer minimum stays. Ensure high availability.
- Low Season: Offer competitive pricing, special promotions (e.g., extended stay discounts), and flexible cancellation policies. Target off-season travelers like remote workers or budget-conscious guests.
- Shoulder Seasons: Implement dynamic pricing that balances peak and low rates. Target weekend travelers or specific events. Offer slightly more flexible terms than peak season.
- Regularly analyze your own performance against these Ventasso seasonality benchmarks and adjust your pricing and availability strategy accordingly.
Best Areas for Airbnb Investment in Ventasso (2025)
Exploring the top neighborhoods for short-term rentals in Ventasso? This section highlights key areas, outlining why they are attractive for hosts and guests, along with notable local attractions. Consider these locations based on your target guest profile and investment strategy.
| Neighborhood / Area | Why Host Here? (Target Guests & Appeal) | Key Attractions & Landmarks |
|---|---|---|
| Civico di Ventasso | A charming village known for its stunning views of the Apennine mountains and rich cultural heritage. It's ideal for those seeking a tranquil retreat in nature and a taste of traditional Italian life. | Parco Nazionale dell'Appennino Tosco-Emiliano, Chiesa di San Giovanni Battista, Centro Storico di Ventasso, Sentieri Naturalistici, Local Festivals |
| Busana | A picturesque small town surrounded by nature, famous for its ski resorts and hiking trails. It's perfect for winter sports enthusiasts and summer hikers alike. | Pista da sci di Ventasso, Il Centro Culturale di Busana, Percorsi di trekking, Parco Avventura |
| Cascina di Ventasso | Known for its rustic charm and beautiful countryside, this area attracts those looking for peace and outdoor adventures, including biking and seasonal agritourism. | Aziende Agricole Locali, Strade dei Vini e dei Sapori, Eventi di Agriturismo, Panorami Montani, Storia Locale |
| Secchio | A serene area perfect for families and outdoor lovers, offering unique experiences in nature such as fishing and forest exploration. | Fiumi e Laghi, Escursioni e Passeggiate, Case Storiche, Eventi Comunitari |
| Cavalito | A quaint hamlet that offers visitors a glimpse into rural Italian life and opportunities for hiking, it’s great for those seeking a cultural experience. | Santi Abbondio e Giovanni Battista Church, Edifici Storici, Percorsi Naturalistici, Attività Culturali |
| Reggio nell'Emilia | This nearby city offers a blend of history, culture, and modern amenities. It's ideal for visitors interested in art, architecture, and food. | Teatro Municipale, Piazza Prampolini, Basilica della Ghiara, Museo del Tricolore, Gastronomia Locale |
| Collagna | A small town perfect for nature lovers and those interested in winter sports. Nearby slopes provide winter activities, while the summer offers great hiking. | Monte La Nuda, Attività Invernali, Escursioni Estive, Borghi Storici |
| Preston | A local area rich in agricultural heritage, offering tourists experiences in rural tourism and local produce like balsamic vinegar and cheeses. | Fattorie Locali, Mercati Rionali, Eventi Culinari, Cultura Gastronomica |
Understanding Airbnb License Requirements & STR Laws in Ventasso (2025)
With 29% of listings showing registration in 2025, understanding potential Airbnb license requirements is crucial in Ventasso. Always verify the latest short term rental regulations and Airbnb license requirements directly with local government authorities for Ventasso to ensure full compliance before hosting.
(Source: AirROI data, 2025, based on 29% licensed listings)
Top Performing Airbnb Properties in Ventasso (2025)
Benchmark your potential! Explore examples of top-performing Airbnb properties in Ventassobased on Trailing Twelve Month (TTM) revenue. Analyze their characteristics, revenue, occupancy rate, and ADR to understand what drives success in this market.
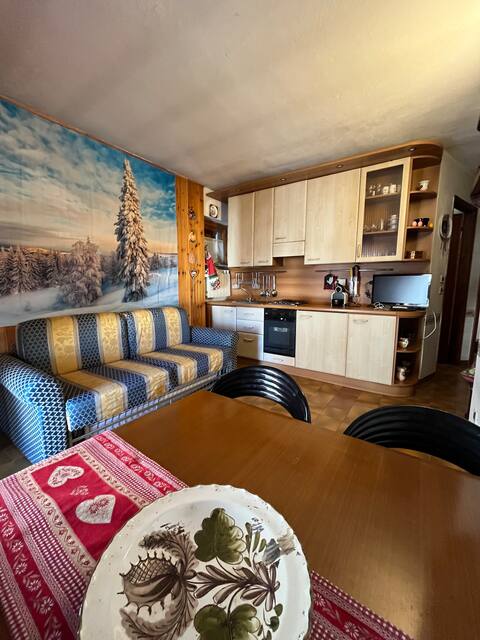
![Apartment [Cerreto Laghi]](https://a0.muscache.com/im/pictures/miso/Hosting-1010218332538253821/original/ba9e12d2-2fd1-438b-9eee-4b7351d330b2.jpeg?im_w=480&im_format=avif)
Apartment [Cerreto Laghi]
Entire Place • 2 bedrooms
Il frassineto
Entire Place • 2 bedrooms
Mulino nell'Appennino Reggiano
Entire Place • 3 bedrooms
"Ai Monti"
Entire Place • 2 bedrooms

Holiday home "La Piagna"
Entire Place • 3 bedrooms
Due passi dalle piste da sci
Entire Place • 1 bedroom
Note: Performance varies based on location, size, amenities, seasonality, and management quality. Data reflects the past 12 months.
Top Performing Airbnb Hosts in Ventasso (2025)
Learn from the best! This table showcases top-performing Airbnb hosts in Ventasso based on the number of properties managed and estimated total revenue over the past year. Analyze their scale and performance metrics.
| Host Name | Properties | Grossing Revenue | Stay Reviews | Avg Rating |
|---|---|---|---|---|
| Marco | 2 | $11,367 | 14 | 4.89/5.0 |
| Bruno | 1 | $9,253 | 19 | 4.58/5.0 |
| Matteo | 1 | $8,509 | 6 | 4.67/5.0 |
| Host #62743637 | 1 | $7,412 | 0 | 0.00/5.0 |
| Daniele | 1 | $7,107 | 24 | 5.00/5.0 |
| Host #88732377 | 1 | $5,175 | 1 | 0.00/5.0 |
| Host #215407630 | 1 | $3,128 | 0 | 0.00/5.0 |
| Host #447709587 | 3 | $1,975 | 4 | 0.00/5.0 |
| Daniela | 1 | $1,711 | 3 | 5.00/5.0 |
| Host #1624773 | 1 | $780 | 4 | 4.50/5.0 |
Analyzing the strategies of top hosts, such as their property selection, pricing, and guest communication, can offer valuable lessons for optimizing your own Airbnb operations in Ventasso.
Dive Deeper: Advanced Ventasso STR Market Data (2025)
Ready to unlock more insights? AirROI provides access to advanced metrics and comprehensive Airbnb data for Ventasso. Explore detailed analytics beyond this report to refine your investment strategy, optimize pricing, and maximize your vacation rental profits.
Explore Advanced MetricsVentasso Short-Term Rental Market Composition (2025): Property & Room Types
Room Type Distribution
Property Type Distribution
Market Composition Insights for Ventasso
- The Ventasso Airbnb market composition is heavily skewed towards Entire Home/Apt listings, which make up 82.4% of the 17 active rentals. This indicates strong guest preference for privacy and space.
- Looking at the property type distribution in Ventasso, Apartment/Condo properties are the most common (52.9%), reflecting the local real estate landscape.
- Houses represent a significant 23.5% portion, catering likely to families or larger groups.
- The presence of 17.6% Hotel/Boutique listings indicates integration with traditional hospitality.
Ventasso Airbnb Room Capacity Analysis (2025): Bedroom Distribution
Distribution of Listings by Number of Bedrooms
Room Capacity Insights for Ventasso
- The dominant room capacity in Ventasso is 1 bedroom listings, making up 52.9% of the market. This suggests a strong demand for properties suitable for couples or solo travelers.
- Together, 1 bedroom and 2 bedrooms properties represent 82.3% of the active Airbnb listings in Ventasso, indicating a high concentration in these sizes.
- With over half the market (52.9%) consisting of studios or 1-bedroom units, Ventasso is particularly well-suited for individuals or couples.
Ventasso Vacation Rental Guest Capacity Trends (2025)
Distribution of Listings by Guest Capacity
Guest Capacity Insights for Ventasso
- The most common guest capacity trend in Ventasso vacation rentals is listings accommodating 4 guests (35.3%). This suggests the primary traveler segment is likely small families or groups.
- Properties designed for 4 guests and 6 guests dominate the Ventasso STR market, accounting for 58.8% of listings.
- 41.2% of properties accommodate 6+ guests, serving the market segment for larger families or group travel in Ventasso.
- On average, properties in Ventasso are equipped to host 4.8 guests.
Ventasso Airbnb Booking Patterns (2025): Available vs. Booked Days
Available Days Distribution
Booked Days Distribution
Booking Pattern Insights for Ventasso
- The most common availability pattern in Ventasso falls within the 271-366 days range, representing 88.2% of listings. This suggests many properties have significant open periods on their calendars.
- Approximately 100.0% of listings show high availability (181+ days open annually), indicating potential for increased bookings or specific owner usage patterns.
- For booked days, the 1-30 days range is most frequent in Ventasso (58.8%), reflecting common guest stay durations or potential owner blocking patterns.
Ventasso Airbnb Minimum Stay Requirements Analysis
Distribution of Listings by Minimum Night Requirement
1 Night
8 listings
50% of total
2 Nights
2 listings
12.5% of total
4-6 Nights
2 listings
12.5% of total
7-29 Nights
4 listings
25% of total
Key Insights
- The most prevalent minimum stay requirement in Ventasso is 1 Night, adopted by 50% of listings. This highlights the market's preference for shorter, flexible bookings.
- A strong majority (62.5%) of the Ventasso Airbnb data shows acceptance of very short stays (1-2 nights), indicating a dynamic, high-turnover market.
Recommendations
- Align with the market by considering a 1 Night minimum stay, as 50% of Ventasso hosts use this setting.
- Adjust minimum nights based on seasonality – potentially shorter during low season and longer during peak demand periods in Ventasso.
Ventasso Airbnb Cancellation Policy Trends Analysis (2025)
Flexible
6 listings
60% of total
Moderate
3 listings
30% of total
Strict
1 listings
10% of total
Cancellation Policy Insights for Ventasso
- The prevailing Airbnb cancellation policy trend in Ventasso is Flexible, used by 60% of listings.
- The market strongly favors guest-friendly terms, with 90.0% of listings offering Flexible or Moderate policies. This suggests guests in Ventasso may expect booking flexibility.
Recommendations for Hosts
- Consider adopting a Flexible policy to align with the 60% market standard in Ventasso.
- Given the high prevalence of Flexible policies (60%), offering this can enhance booking appeal, especially during shoulder seasons.
- Using a Strict policy might deter some guests, as only 10% of listings use it. Evaluate if potential revenue protection outweighs possible lower booking rates.
- Regularly review your cancellation policy against competitors and market demand shifts in Ventasso.
Ventasso STR Booking Lead Time Analysis (2025)
Average Booking Lead Time by Month
Booking Lead Time Insights for Ventasso
- The overall average booking lead time for vacation rentals in Ventasso is 37 days.
- Guests book furthest in advance for stays during April (average 76 days), likely coinciding with peak travel demand or local events.
- The shortest booking windows occur for stays in March (average 0 days), indicating more last-minute travel plans during this time.
- Seasonally, Fall (47 days avg.) sees the longest lead times, while Winter (20 days avg.) has the shortest, reflecting typical travel planning cycles.
Recommendations for Hosts
- Use the overall average lead time (37 days) as a baseline for your pricing and availability strategy in Ventasso.
- For April stays, consider implementing length-of-stay discounts or slightly higher rates for bookings made less than 76 days out to capitalize on advance planning.
- During March, focus on last-minute booking availability and promotions, as guests book with very short notice (0 days avg.).
- Target marketing efforts for the Fall season well in advance (at least 47 days) to capture early planners.
- Monitor your own booking lead times against these Ventasso averages to identify opportunities for dynamic pricing adjustments.
Popular & Essential Airbnb Amenities in Ventasso (2025)
Amenity Prevalence
Amenity Insights for Ventasso
- Essential amenities in Ventasso that guests expect include: Kitchen. Lacking these (this) could significantly impact bookings.
- Popular amenities like Heating, Essentials, Free parking on premises are common but not universal. Offering these can provide a competitive edge.
- Warning: Wifi is not universally provided but is considered essential globally. Ensure reliable Wifi is offered.
Recommendations for Hosts
- Ensure your listing includes all essential amenities for Ventasso: Kitchen.
- Consider adding popular differentiators like Heating or Essentials to increase appeal.
- Highlight unique or less common amenities you offer (e.g., hot tub, dedicated workspace, EV charger) in your listing description and photos.
- Regularly check competitor amenities in Ventasso to stay competitive.
Ventasso Airbnb Guest Demographics & Profile Analysis (2025)
Guest Profile Summary for Ventasso
- The typical guest profile for Airbnb in Ventasso consists of primarily domestic travelers (82%), often arriving from nearby Bologna, typically belonging to the Post-2000s (Gen Z/Alpha) group (50%), primarily speaking Italian or English.
- Domestic travelers account for 81.8% of guests.
- Key international markets include Italy (81.8%) and Canada (9.1%).
- Top languages spoken are Italian (38.5%) followed by English (38.5%).
- A significant demographic segment is the Post-2000s (Gen Z/Alpha) group, representing 50% of guests.
Recommendations for Hosts
- Target domestic marketing efforts towards travelers from Bologna and Seravezza.
- Tailor amenities and listing descriptions to appeal to the dominant Post-2000s (Gen Z/Alpha) demographic (e.g., highlight fast WiFi, smart home features, local guides).
- Highlight unique local experiences or amenities relevant to the primary guest profile.
- Consider seasonal promotions aligned with peak travel times for key origin markets.
Nearby Short-Term Rental Market Comparison
How does the Ventasso Airbnb market stack up against its neighbors? Compare key performance metrics like average monthly revenue, ADR, and occupancy rates in surrounding areas to understand the broader regional STR landscape.
| Market | Active Properties | Monthly Revenue | Daily Rate | Avg. Occupancy |
|---|---|---|---|---|
| Laglio | 64 | $4,873 | $463.61 | 47% |
| Brenzone sul Garda | 19 | $4,128 | $335.25 | 52% |
| Portofino | 68 | $4,086 | $454.35 | 44% |
| Sala Comacina | 64 | $3,794 | $400.27 | 50% |
| Bellagio | 373 | $3,630 | $328.26 | 55% |
| Crespina | 16 | $3,526 | $493.64 | 48% |
| Oliveto Lario | 99 | $3,509 | $327.42 | 55% |
| Tignano | 10 | $3,391 | $500.31 | 36% |
| Carate Urio | 71 | $3,379 | $331.90 | 44% |
| Brienno | 39 | $3,327 | $337.92 | 45% |