Sestola Airbnb Market Analysis 2025: Short Term Rental Data & Vacation Rental Statistics in Emilia-Romagna, Italy
Is Airbnb profitable in Sestola in 2025? Explore comprehensive Airbnb analytics for Sestola, Emilia-Romagna, Italy to uncover income potential. This 2025 STR market report for Sestola, based on AirROI data from April 2024 to March 2025, reveals key trends in the niche market of 32 active listings.
Whether you're considering an Airbnb investment in Sestola, optimizing your existing vacation rental, or exploring rental arbitrage opportunities, understanding the Sestola Airbnb data is crucial. Navigating the high regulation landscape is key to maximizing your short term rental income potential. Let's dive into the specifics.
Key Sestola Airbnb Performance Metrics Overview
Monthly Airbnb Revenue Variations & Income Potential in Sestola (2025)
Understanding the monthly revenue variations for Airbnb listings in Sestola is key to maximizing your short term rental income potential. Seasonality significantly impacts earnings. Our analysis, based on data from the past 12 months, shows that the peak revenue month for STRs in Sestola is typically August, while November often presents the lowest earnings, highlighting opportunities for strategic pricing adjustments during shoulder and low seasons. Explore the typical Airbnb income in Sestola across different performance tiers:
- Best-in-class properties (Top 10%) achieve $2,257+ monthly, often utilizing dynamic pricing and superior guest experiences.
- Strong performing properties (Top 25%) earn $1,341 or more, indicating effective management and desirable locations/amenities.
- Typical properties (Median) generate around $742 per month, representing the average market performance.
- Entry-level properties (Bottom 25%) see earnings around $325, often with potential for optimization.
Average Monthly Airbnb Earnings Trend in Sestola
Sestola Airbnb Occupancy Rate Trends (2025)
Maximize your bookings by understanding the Sestola STR occupancy trends. Seasonal demand shifts significantly influence how often properties are booked. Typically, Augustsees the highest demand (peak season occupancy), while April experiences the lowest (low season). Effective strategies, like adjusting minimum stays or offering promotions, can boost occupancy during slower periods. Here's how different property tiers perform in Sestola:
- Best-in-class properties (Top 10%) achieve 53%+ occupancy, indicating high desirability and potentially optimized availability.
- Strong performing properties (Top 25%) maintain 37% or higher occupancy, suggesting good market fit and guest satisfaction.
- Typical properties (Median) have an occupancy rate around 22%.
- Entry-level properties (Bottom 25%) average 11% occupancy, potentially facing higher vacancy.
Average Monthly Occupancy Rate Trend in Sestola
Average Daily Rate (ADR) Airbnb Trends in Sestola (2025)
Effective short term rental pricing strategy in Sestola involves understanding monthly ADR fluctuations. The Average Daily Rate (ADR) for Airbnb in Sestola typically peaks in December and dips lowest during September. Leveraging Airbnb dynamic pricing tools or strategies based on this seasonality can significantly boost revenue. Here's a look at the typical nightly rates achieved:
- Best-in-class properties (Top 10%) command rates of $144+ per night, often due to premium features or locations.
- Strong performing properties (Top 25%) achieve nightly rates of $123 or more.
- Typical properties (Median) charge around $99 per night.
- Entry-level properties (Bottom 25%) earn around $69 per night.
Average Daily Rate (ADR) Trend by Month in Sestola
Get Live Sestola Market Intelligence 👇

Explore Real-time Analytics
Airbnb Seasonality Analysis & Trends in Sestola (2025)
Peak Season (August, February, January)
- Revenue averages $1,604 per month
- Occupancy rates average 41.7%
- Daily rates average $113
Shoulder Season
- Revenue averages $965 per month
- Occupancy maintains around 24.1%
- Daily rates hold near $99
Low Season (March, October, November)
- Revenue drops to average $609 per month
- Occupancy decreases to average 18.5%
- Daily rates adjust to average $106
Seasonality Insights for Sestola
- The Airbnb seasonality in Sestola shows highly seasonal trends requiring careful strategy. While the sections above show seasonal averages, it's also insightful to look at the extremes:
- During the high season, the absolute peak month showcases Sestola's highest earning potential, with monthly revenues capable of climbing to $2,023, occupancy reaching a high of 57.1%, and ADRs peaking at $124.
- Conversely, the slowest single month of the year, typically falling within the low season, marks the market's lowest point. In this month, revenue might dip to $530, occupancy could drop to 16.3%, and ADRs may adjust down to $93.
- Understanding both the seasonal averages and these monthly peaks and troughs in revenue, occupancy, and ADR is crucial for maximizing your Airbnb profit potential in Sestola.
Seasonal Strategies for Maximizing Profit
- Peak Season: Maximize revenue through premium pricing and potentially longer minimum stays. Ensure high availability.
- Low Season: Offer competitive pricing, special promotions (e.g., extended stay discounts), and flexible cancellation policies. Target off-season travelers like remote workers or budget-conscious guests.
- Shoulder Seasons: Implement dynamic pricing that balances peak and low rates. Target weekend travelers or specific events. Offer slightly more flexible terms than peak season.
- Regularly analyze your own performance against these Sestola seasonality benchmarks and adjust your pricing and availability strategy accordingly.
Best Areas for Airbnb Investment in Sestola (2025)
Exploring the top neighborhoods for short-term rentals in Sestola? This section highlights key areas, outlining why they are attractive for hosts and guests, along with notable local attractions. Consider these locations based on your target guest profile and investment strategy.
| Neighborhood / Area | Why Host Here? (Target Guests & Appeal) | Key Attractions & Landmarks |
|---|---|---|
| Sestola City Center | The heart of Sestola, this area is bustling with restaurants, shops, and easy access to local attractions. Ideal for tourists wanting to experience the local culture and cuisine. | Castello di Sestola, Piazza dei Martiri, local trattorias, rental shops for ski equipment, Sestola ski resort |
| Sestola Ski Resort | A popular area during the winter months for skiing enthusiasts. It attracts visitors seeking winter sports and is a great location for Airbnb hosts targeting seasonal travelers. | Ski slopes, Sestola Winter Park, Snowshoeing trails, Ski schools, Mountain restaurants |
| Sestola Hiking Trails | Known for its picturesque hiking routes, this area draws nature lovers and adventure seekers. Perfect for Airbnb hosts targeting outdoor enthusiasts. | Nature Park of Sasso-Titan, Various hiking trails, Scenic viewpoints, Guided tours, Wildlife watching |
| Villaggio del Sole | A family-friendly area with various accommodations and recreational activities. Ideal for families visiting during summer or winter holidays. | Family resorts, Playgrounds, Outdoor sports facilities, Local festivals, Markets |
| Local Vineyards | The surrounding areas of Sestola are home to local vineyards and wineries, attracting those interested in wine tourism and culinary experiences. | Winery tours, Wine tasting events, Local cuisine, Vineyard walking paths, Culinary workshops |
| Historical Sites | Sestola is rich in history, making its historical sites attractive to tourists interested in culture and history. | Ancient churches, Museo della Montagna, Historical buildings, Guided heritage walks, Local artisan shops |
| Nature Parks | The proximity to natural parks provides a serene getaway for those looking to escape the hustle and bustle, attracting eco-tourists and relaxation seekers. | Parco del Frignano, Wildlife trails, Picnic areas, Guided nature walks, Scenic drives |
| Festivals and Events | Sestola hosts various cultural and culinary festivals throughout the year, drawing both locals and tourists. Renting an Airbnb during these peak times can be highly lucrative. | Sestola Carnival, Food festivals, Cultural events, Local music events, Outdoor markets |
Understanding Airbnb License Requirements & STR Laws in Sestola (2025)
Yes, Sestola, Emilia-Romagna, Italy enforces high STR regulations. Obtaining a license and ensuring compliance is almost certainly required according to current 2025 STR laws. Always verify the latest short term rental regulations and Airbnb license requirements directly with local government authorities for Sestola to ensure full compliance before hosting.
(Source: AirROI data, 2025, based on 38% licensed listings)
Top Performing Airbnb Properties in Sestola (2025)
Benchmark your potential! Explore examples of top-performing Airbnb properties in Sestolabased on Trailing Twelve Month (TTM) revenue. Analyze their characteristics, revenue, occupancy rate, and ADR to understand what drives success in this market.
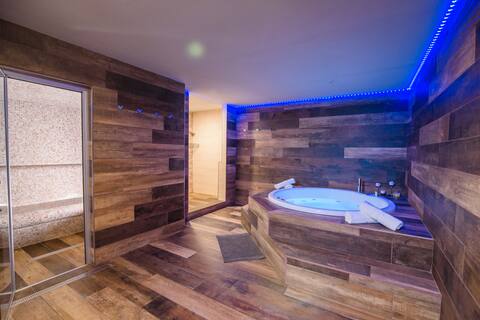
House with hot tub and sauna
Entire Place • 2 bedrooms
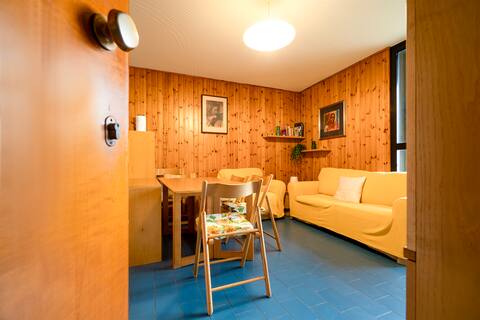
The house with a castle view
Entire Place • 1 bedroom
![[Centro Storico Sestola] - WiFi & Netflix](https://a0.muscache.com/im/pictures/hosting/Hosting-U3RheVN1cHBseUxpc3Rpbmc6MTA3MTA4MTk4ODE1MDI5OTMzNg%3D%3D/original/0e219d8a-9465-4eb5-9548-a8d946686e38.jpeg?im_w=480&im_format=avif)
[Centro Storico Sestola] - WiFi & Netflix
Entire Place • 1 bedroom
![[★★★★★ Monte Cimone ] Loft Sestola Centro](https://a0.muscache.com/im/ml/photo_enhancement/pictures/miso/Hosting-53660452/original/ead62ecd-e590-47e1-9310-3eaad2a67bdb.jpeg?im_w=480&im_format=avif)
[★★★★★ Monte Cimone ] Loft Sestola Centro
Entire Place • 1 bedroom
![Rifugio a Pian del Falco [comfort and sport LaNinfa]](https://a0.muscache.com/im/pictures/hosting/Hosting-U3RheVN1cHBseUxpc3Rpbmc6Nzk5Nzk3NDU5NTA1MzI0NTUz/original/874f5a4e-10cf-401f-9d70-1552e8805ffa.jpeg?im_w=480&im_format=avif)
Rifugio a Pian del Falco [comfort and sport LaNinfa]
Entire Place • 1 bedroom

Relaxation, tranquility, nature
Entire Place • 3 bedrooms
Note: Performance varies based on location, size, amenities, seasonality, and management quality. Data reflects the past 12 months.
Top Performing Airbnb Hosts in Sestola (2025)
Learn from the best! This table showcases top-performing Airbnb hosts in Sestola based on the number of properties managed and estimated total revenue over the past year. Analyze their scale and performance metrics.
| Host Name | Properties | Grossing Revenue | Stay Reviews | Avg Rating |
|---|---|---|---|---|
| Giada | 2 | $31,987 | 35 | 4.56/5.0 |
| Andrea | 1 | $24,711 | 7 | 5.00/5.0 |
| Luana | 1 | $21,398 | 16 | 4.81/5.0 |
| Romano | 2 | $17,745 | 138 | 4.83/5.0 |
| Host #494032722 | 2 | $14,931 | 0 | 0.00/5.0 |
| Alessandro | 1 | $12,688 | 10 | 4.70/5.0 |
| Francesca | 1 | $11,095 | 4 | 5.00/5.0 |
| Manuel | 1 | $10,764 | 12 | 5.00/5.0 |
| Yaroslava | 1 | $9,819 | 17 | 4.94/5.0 |
| Stefania | 1 | $8,092 | 7 | 5.00/5.0 |
Analyzing the strategies of top hosts, such as their property selection, pricing, and guest communication, can offer valuable lessons for optimizing your own Airbnb operations in Sestola.
Dive Deeper: Advanced Sestola STR Market Data (2025)
Ready to unlock more insights? AirROI provides access to advanced metrics and comprehensive Airbnb data for Sestola. Explore detailed analytics beyond this report to refine your investment strategy, optimize pricing, and maximize your vacation rental profits.
Explore Advanced MetricsSestola Short-Term Rental Market Composition (2025): Property & Room Types
Room Type Distribution
Property Type Distribution
Market Composition Insights for Sestola
- The Sestola Airbnb market composition is heavily skewed towards Entire Home/Apt listings, which make up 100% of the 32 active rentals. This indicates strong guest preference for privacy and space.
- Looking at the property type distribution in Sestola, Apartment/Condo properties are the most common (71.9%), reflecting the local real estate landscape.
- Houses represent a significant 28.1% portion, catering likely to families or larger groups.
Sestola Airbnb Room Capacity Analysis (2025): Bedroom Distribution
Distribution of Listings by Number of Bedrooms
Room Capacity Insights for Sestola
- The dominant room capacity in Sestola is 2 bedrooms listings, making up 46.9% of the market. This suggests a strong demand for properties suitable for couples or solo travelers.
- Together, 2 bedrooms and 1 bedroom properties represent 90.7% of the active Airbnb listings in Sestola, indicating a high concentration in these sizes.
- Listings with 3+ bedrooms (9.4%) represent a smaller niche, potentially indicating an underserved market for larger group accommodations in Sestola.
Sestola Vacation Rental Guest Capacity Trends (2025)
Distribution of Listings by Guest Capacity
Guest Capacity Insights for Sestola
- The most common guest capacity trend in Sestola vacation rentals is listings accommodating 4 guests (34.4%). This suggests the primary traveler segment is likely small families or groups.
- Properties designed for 4 guests and 6 guests dominate the Sestola STR market, accounting for 65.7% of listings.
- 40.7% of properties accommodate 6+ guests, serving the market segment for larger families or group travel in Sestola.
- On average, properties in Sestola are equipped to host 4.9 guests.
Sestola Airbnb Booking Patterns (2025): Available vs. Booked Days
Available Days Distribution
Booked Days Distribution
Booking Pattern Insights for Sestola
- The most common availability pattern in Sestola falls within the 271-366 days range, representing 84.4% of listings. This suggests many properties have significant open periods on their calendars.
- Approximately 96.9% of listings show high availability (181+ days open annually), indicating potential for increased bookings or specific owner usage patterns.
- For booked days, the 1-30 days range is most frequent in Sestola (43.8%), reflecting common guest stay durations or potential owner blocking patterns.
- A notable 3.1% of properties secure long booking periods (181+ days booked per year), highlighting successful long-term rental strategies or significant owner usage.
Sestola Airbnb Minimum Stay Requirements Analysis
Distribution of Listings by Minimum Night Requirement
1 Night
7 listings
23.3% of total
2 Nights
8 listings
26.7% of total
3 Nights
4 listings
13.3% of total
4-6 Nights
5 listings
16.7% of total
7-29 Nights
2 listings
6.7% of total
30+ Nights
4 listings
13.3% of total
Key Insights
- The most prevalent minimum stay requirement in Sestola is 2 Nights, adopted by 26.7% of listings. This highlights the market's preference for shorter, flexible bookings.
- A significant segment (13.3%) caters to monthly stays (30+ nights) in Sestola, pointing to opportunities in the extended-stay market.
Recommendations
- Align with the market by considering a 2 Nights minimum stay, as 26.7% of Sestola hosts use this setting.
- If feasible, allowing 1-night stays, especially midweek or during low season, could capture last-minute bookings, as only 23.3% currently do.
- Explore offering discounts for stays of 30+ nights to attract the 13.3% of the market seeking extended stays.
- Adjust minimum nights based on seasonality – potentially shorter during low season and longer during peak demand periods in Sestola.
Sestola Airbnb Cancellation Policy Trends Analysis (2025)
Super Strict 30 Days
1 listings
3.6% of total
Flexible
11 listings
39.3% of total
Moderate
13 listings
46.4% of total
Strict
3 listings
10.7% of total
Cancellation Policy Insights for Sestola
- The prevailing Airbnb cancellation policy trend in Sestola is Moderate, used by 46.4% of listings.
- The market strongly favors guest-friendly terms, with 85.7% of listings offering Flexible or Moderate policies. This suggests guests in Sestola may expect booking flexibility.
Recommendations for Hosts
- Consider adopting a Moderate policy to align with the 46.4% market standard in Sestola.
- Using a Strict policy might deter some guests, as only 10.7% of listings use it. Evaluate if potential revenue protection outweighs possible lower booking rates.
- Regularly review your cancellation policy against competitors and market demand shifts in Sestola.
Sestola STR Booking Lead Time Analysis (2025)
Average Booking Lead Time by Month
Booking Lead Time Insights for Sestola
- The overall average booking lead time for vacation rentals in Sestola is 44 days.
- Guests book furthest in advance for stays during July (average 79 days), likely coinciding with peak travel demand or local events.
- The shortest booking windows occur for stays in November (average 12 days), indicating more last-minute travel plans during this time.
- Seasonally, Summer (70 days avg.) sees the longest lead times, while Fall (34 days avg.) has the shortest, reflecting typical travel planning cycles.
Recommendations for Hosts
- Use the overall average lead time (44 days) as a baseline for your pricing and availability strategy in Sestola.
- For July stays, consider implementing length-of-stay discounts or slightly higher rates for bookings made less than 79 days out to capitalize on advance planning.
- During November, focus on last-minute booking availability and promotions, as guests book with very short notice (12 days avg.).
- Target marketing efforts for the Summer season well in advance (at least 70 days) to capture early planners.
- Monitor your own booking lead times against these Sestola averages to identify opportunities for dynamic pricing adjustments.
Popular & Essential Airbnb Amenities in Sestola (2025)
Amenity Prevalence
Amenity Insights for Sestola
- Essential amenities in Sestola that guests expect include: Heating, TV, Kitchen. Lacking these (any) could significantly impact bookings.
- Popular amenities like Hot water, Hangers, Hair dryer are common but not universal. Offering these can provide a competitive edge.
Recommendations for Hosts
- Ensure your listing includes all essential amenities for Sestola: Heating, TV, Kitchen.
- Prioritize adding missing essentials: TV, Kitchen.
- Consider adding popular differentiators like Hot water or Hangers to increase appeal.
- Highlight unique or less common amenities you offer (e.g., hot tub, dedicated workspace, EV charger) in your listing description and photos.
- Regularly check competitor amenities in Sestola to stay competitive.
Sestola Airbnb Guest Demographics & Profile Analysis (2025)
Guest Profile Summary for Sestola
- The typical guest profile for Airbnb in Sestola consists of primarily domestic travelers (94%), often arriving from nearby Bologna, typically belonging to the Post-2000s (Gen Z/Alpha) group (50%), primarily speaking English or Italian.
- Domestic travelers account for 93.8% of guests.
- Key international markets include Italy (93.8%) and France (1.3%).
- Top languages spoken are English (36.8%) followed by Italian (36.8%).
- A significant demographic segment is the Post-2000s (Gen Z/Alpha) group, representing 50% of guests.
Recommendations for Hosts
- Target domestic marketing efforts towards travelers from Bologna and Pisa.
- Tailor amenities and listing descriptions to appeal to the dominant Post-2000s (Gen Z/Alpha) demographic (e.g., highlight fast WiFi, smart home features, local guides).
- Highlight unique local experiences or amenities relevant to the primary guest profile.
- Consider seasonal promotions aligned with peak travel times for key origin markets.
Nearby Short-Term Rental Market Comparison
How does the Sestola Airbnb market stack up against its neighbors? Compare key performance metrics like average monthly revenue, ADR, and occupancy rates in surrounding areas to understand the broader regional STR landscape.
| Market | Active Properties | Monthly Revenue | Daily Rate | Avg. Occupancy |
|---|---|---|---|---|
| Laglio | 64 | $4,873 | $463.61 | 47% |
| Brenzone sul Garda | 19 | $4,128 | $335.25 | 52% |
| Portofino | 68 | $4,086 | $454.35 | 44% |
| Sala Comacina | 64 | $3,794 | $400.27 | 50% |
| Bellagio | 373 | $3,630 | $328.26 | 55% |
| Crespina | 16 | $3,526 | $493.64 | 48% |
| Oliveto Lario | 99 | $3,509 | $327.42 | 55% |
| Tignano | 10 | $3,391 | $500.31 | 36% |
| Carate Urio | 71 | $3,379 | $331.90 | 44% |
| Brienno | 39 | $3,327 | $337.92 | 45% |