Santa Sofia Airbnb Market Analysis 2025: Short Term Rental Data & Vacation Rental Statistics in Emilia-Romagna, Italy
Is Airbnb profitable in Santa Sofia in 2025? Explore comprehensive Airbnb analytics for Santa Sofia, Emilia-Romagna, Italy to uncover income potential. This 2025 STR market report for Santa Sofia, based on AirROI data from April 2024 to March 2025, reveals key trends in the niche market of 20 active listings.
Whether you're considering an Airbnb investment in Santa Sofia, optimizing your existing vacation rental, or exploring rental arbitrage opportunities, understanding the Santa Sofia Airbnb data is crucial. Understanding the local regulations is key to maximizing your short term rental income potential. Let's dive into the specifics.
Key Santa Sofia Airbnb Performance Metrics Overview
Monthly Airbnb Revenue Variations & Income Potential in Santa Sofia (2025)
Understanding the monthly revenue variations for Airbnb listings in Santa Sofia is key to maximizing your short term rental income potential. Seasonality significantly impacts earnings. Our analysis, based on data from the past 12 months, shows that the peak revenue month for STRs in Santa Sofia is typically February, while November often presents the lowest earnings, highlighting opportunities for strategic pricing adjustments during shoulder and low seasons. Explore the typical Airbnb income in Santa Sofia across different performance tiers:
- Best-in-class properties (Top 10%) achieve $2,266+ monthly, often utilizing dynamic pricing and superior guest experiences.
- Strong performing properties (Top 25%) earn $1,550 or more, indicating effective management and desirable locations/amenities.
- Typical properties (Median) generate around $539 per month, representing the average market performance.
- Entry-level properties (Bottom 25%) see earnings around $300, often with potential for optimization.
Average Monthly Airbnb Earnings Trend in Santa Sofia
Santa Sofia Airbnb Occupancy Rate Trends (2025)
Maximize your bookings by understanding the Santa Sofia STR occupancy trends. Seasonal demand shifts significantly influence how often properties are booked. Typically, Februarysees the highest demand (peak season occupancy), while June experiences the lowest (low season). Effective strategies, like adjusting minimum stays or offering promotions, can boost occupancy during slower periods. Here's how different property tiers perform in Santa Sofia:
- Best-in-class properties (Top 10%) achieve 44%+ occupancy, indicating high desirability and potentially optimized availability.
- Strong performing properties (Top 25%) maintain 32% or higher occupancy, suggesting good market fit and guest satisfaction.
- Typical properties (Median) have an occupancy rate around 18%.
- Entry-level properties (Bottom 25%) average 11% occupancy, potentially facing higher vacancy.
Average Monthly Occupancy Rate Trend in Santa Sofia
Average Daily Rate (ADR) Airbnb Trends in Santa Sofia (2025)
Effective short term rental pricing strategy in Santa Sofia involves understanding monthly ADR fluctuations. The Average Daily Rate (ADR) for Airbnb in Santa Sofia typically peaks in April and dips lowest during September. Leveraging Airbnb dynamic pricing tools or strategies based on this seasonality can significantly boost revenue. Here's a look at the typical nightly rates achieved:
- Best-in-class properties (Top 10%) command rates of $225+ per night, often due to premium features or locations.
- Strong performing properties (Top 25%) achieve nightly rates of $140 or more.
- Typical properties (Median) charge around $102 per night.
- Entry-level properties (Bottom 25%) earn around $75 per night.
Average Daily Rate (ADR) Trend by Month in Santa Sofia
Get Live Santa Sofia Market Intelligence 👇

Explore Real-time Analytics
Airbnb Seasonality Analysis & Trends in Santa Sofia (2025)
Peak Season (February, July, March)
- Revenue averages $1,541 per month
- Occupancy rates average 30.5%
- Daily rates average $146
Shoulder Season
- Revenue averages $1,068 per month
- Occupancy maintains around 22.1%
- Daily rates hold near $146
Low Season (June, November, December)
- Revenue drops to average $516 per month
- Occupancy decreases to average 17.8%
- Daily rates adjust to average $145
Seasonality Insights for Santa Sofia
- The Airbnb seasonality in Santa Sofia shows highly seasonal trends requiring careful strategy. While the sections above show seasonal averages, it's also insightful to look at the extremes:
- During the high season, the absolute peak month showcases Santa Sofia's highest earning potential, with monthly revenues capable of climbing to $1,768, occupancy reaching a high of 37.5%, and ADRs peaking at $152.
- Conversely, the slowest single month of the year, typically falling within the low season, marks the market's lowest point. In this month, revenue might dip to $454, occupancy could drop to 12.9%, and ADRs may adjust down to $142.
- Understanding both the seasonal averages and these monthly peaks and troughs in revenue, occupancy, and ADR is crucial for maximizing your Airbnb profit potential in Santa Sofia.
Seasonal Strategies for Maximizing Profit
- Peak Season: Maximize revenue through premium pricing and potentially longer minimum stays. Ensure high availability.
- Low Season: Offer competitive pricing, special promotions (e.g., extended stay discounts), and flexible cancellation policies. Target off-season travelers like remote workers or budget-conscious guests.
- Shoulder Seasons: Implement dynamic pricing that balances peak and low rates. Target weekend travelers or specific events. Offer slightly more flexible terms than peak season.
- Regularly analyze your own performance against these Santa Sofia seasonality benchmarks and adjust your pricing and availability strategy accordingly.
Best Areas for Airbnb Investment in Santa Sofia (2025)
Exploring the top neighborhoods for short-term rentals in Santa Sofia? This section highlights key areas, outlining why they are attractive for hosts and guests, along with notable local attractions. Consider these locations based on your target guest profile and investment strategy.
| Neighborhood / Area | Why Host Here? (Target Guests & Appeal) | Key Attractions & Landmarks |
|---|---|---|
| Historical Center | The charming historical center of Santa Sofia is rich in culture and history, making it an attractive destination for tourists interested in exploring the local heritage. | San Giovanni Battista Church, Piazza delle Libertà, Casa del Popolo, Local artisan shops, Annual festivals |
| Foreste Casentinesi | This area is perfect for nature lovers and hikers, offering stunning landscapes and outdoor activities. Ideal for guests seeking a retreat in nature. | Foresta di Camaldoli, Eremo di Camaldoli, Borgo di Castel San Niccolò, Wildlife spotting, Hiking trails |
| Borgo San Lorenzo | A nearby town with local charm and hospitality, known for its thermal baths and rich culinary heritage, ideal for travelers looking for wellness. | Abbey of San Lorenzo, Thermal baths, Local vineyards, Markets, Culinary tours |
| Ravenna | Famous for its stunning mosaics and as a UNESCO World Heritage Site, Ravenna is a strong attraction for art and history enthusiasts. | Basilica di San Vitale, Mausoleum of Galla Placidia, Museo Nazionale di Ravenna, Piazza del Popolo, Ravenna's mosaics |
| Forli | A vibrant city with its own historic downtown and cultural offerings, it provides a diverse experience for tourists looking for city life. | Piazza Aurelio Saffi, Museo di San Domenico, Palazzo Romagnoli, Cultural events, Local dining |
| Firenze | Nearby Florence, a world-renowned city for its art, architecture, and history, attracts millions of visitors each year. | Uffizi Gallery, Florence Cathedral, Ponte Vecchio, Boboli Gardens, Michelangelo's David |
| Cesena | Known for its beautiful historic center and the Malatesta Library, Cesena offers a blend of history and modern living. | Malatesta Library, Piazza del Popolo, Historical museums, Local cafes, Festivals |
| Bologna | As the capital of Emilia-Romagna, Bologna is known for its gastronomy and lively university atmosphere, making it a hotspot for food lovers and students. | Piazza Maggiore, Towers of Bologna, Bologna University, Local trattorias, Culinary workshops |
Understanding Airbnb License Requirements & STR Laws in Santa Sofia (2025)
With 15% of listings showing registration in 2025, understanding potential Airbnb license requirements is crucial in Santa Sofia. Always verify the latest short term rental regulations and Airbnb license requirements directly with local government authorities for Santa Sofia to ensure full compliance before hosting.
(Source: AirROI data, 2025, based on 15% licensed listings)
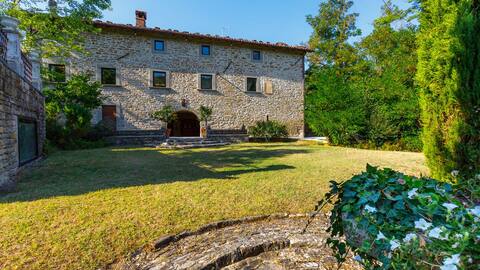
Top Performing Airbnb Properties in Santa Sofia (2025)
Benchmark your potential! Explore examples of top-performing Airbnb properties in Santa Sofiabased on Trailing Twelve Month (TTM) revenue. Analyze their characteristics, revenue, occupancy rate, and ADR to understand what drives success in this market.
Pieve del Borgo 6+2, Emma Villas
Entire Place • 3 bedrooms
Casolare nella natura
Private Room • 2 bedrooms

Stone house in the heart of Hagia Sophia
Entire Place • 1 bedroom
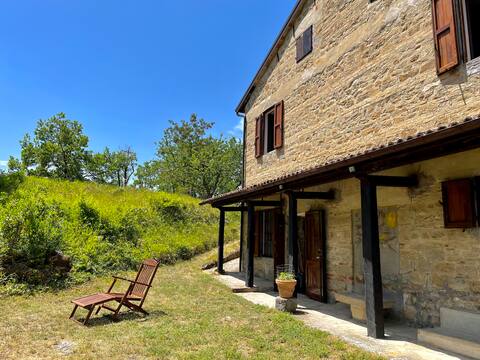
Country House - Foreste Casentinesi National Park
Entire Place • 3 bedrooms
Comodo appartamento in collina
Entire Place • 1 bedroom
Gamberotti Private Valley
Entire Place • 3 bedrooms
Note: Performance varies based on location, size, amenities, seasonality, and management quality. Data reflects the past 12 months.
Top Performing Airbnb Hosts in Santa Sofia (2025)
Learn from the best! This table showcases top-performing Airbnb hosts in Santa Sofia based on the number of properties managed and estimated total revenue over the past year. Analyze their scale and performance metrics.
| Host Name | Properties | Grossing Revenue | Stay Reviews | Avg Rating |
|---|---|---|---|---|
| Emma | 1 | $16,854 | 3 | 3.33/5.0 |
| Giuseppe | 6 | $14,875 | 17 | 2.31/5.0 |
| Host #483437160 | 1 | $13,245 | 0 | 0.00/5.0 |
| Gianluca | 1 | $13,002 | 15 | 4.60/5.0 |
| Host #49811230 | 1 | $9,386 | 0 | 0.00/5.0 |
| Host #479180592 | 1 | $9,104 | 23 | 4.96/5.0 |
| Host #29303044 | 1 | $7,748 | 0 | 0.00/5.0 |
| Host #437291663 | 2 | $7,281 | 3 | 0.00/5.0 |
| Paola | 1 | $4,879 | 14 | 4.93/5.0 |
| Patrizia | 1 | $3,382 | 5 | 4.60/5.0 |
Analyzing the strategies of top hosts, such as their property selection, pricing, and guest communication, can offer valuable lessons for optimizing your own Airbnb operations in Santa Sofia.
Dive Deeper: Advanced Santa Sofia STR Market Data (2025)
Ready to unlock more insights? AirROI provides access to advanced metrics and comprehensive Airbnb data for Santa Sofia. Explore detailed analytics beyond this report to refine your investment strategy, optimize pricing, and maximize your vacation rental profits.
Explore Advanced MetricsSanta Sofia Short-Term Rental Market Composition (2025): Property & Room Types
Room Type Distribution
Property Type Distribution
Market Composition Insights for Santa Sofia
- The Santa Sofia Airbnb market composition is heavily skewed towards Private Room listings, which make up 50% of the 20 active rentals. This indicates strong guest preference for privacy and space.
- Looking at the property type distribution in Santa Sofia, Hotel/Boutique properties are the most common (40%), reflecting the local real estate landscape.
- Houses represent a significant 40% portion, catering likely to families or larger groups.
- The presence of 40% Hotel/Boutique listings indicates integration with traditional hospitality.
Santa Sofia Airbnb Room Capacity Analysis (2025): Bedroom Distribution
Distribution of Listings by Number of Bedrooms
Room Capacity Insights for Santa Sofia
- The dominant room capacity in Santa Sofia is 1 bedroom listings, making up 50% of the market. This suggests a strong demand for properties suitable for couples or solo travelers.
- Together, 1 bedroom and 3 bedrooms properties represent 75.0% of the active Airbnb listings in Santa Sofia, indicating a high concentration in these sizes.
- A significant 25.0% of listings offer 3+ bedrooms, catering to larger groups and families seeking more space in Santa Sofia.
Santa Sofia Vacation Rental Guest Capacity Trends (2025)
Distribution of Listings by Guest Capacity
Guest Capacity Insights for Santa Sofia
- The most common guest capacity trend in Santa Sofia vacation rentals is listings accommodating 4 guests (20%). This suggests the primary traveler segment is likely small families or groups.
- Properties designed for 4 guests and 6 guests dominate the Santa Sofia STR market, accounting for 40.0% of listings.
- 40.0% of properties accommodate 6+ guests, serving the market segment for larger families or group travel in Santa Sofia.
- On average, properties in Santa Sofia are equipped to host 4.5 guests.
Santa Sofia Airbnb Booking Patterns (2025): Available vs. Booked Days
Available Days Distribution
Booked Days Distribution
Booking Pattern Insights for Santa Sofia
- The most common availability pattern in Santa Sofia falls within the 271-366 days range, representing 90% of listings. This suggests many properties have significant open periods on their calendars.
- Approximately 95.0% of listings show high availability (181+ days open annually), indicating potential for increased bookings or specific owner usage patterns.
- For booked days, the 1-30 days range is most frequent in Santa Sofia (60%), reflecting common guest stay durations or potential owner blocking patterns.
- A notable 5.0% of properties secure long booking periods (181+ days booked per year), highlighting successful long-term rental strategies or significant owner usage.
Santa Sofia Airbnb Minimum Stay Requirements Analysis
Distribution of Listings by Minimum Night Requirement
1 Night
9 listings
47.4% of total
2 Nights
4 listings
21.1% of total
4-6 Nights
1 listings
5.3% of total
7-29 Nights
5 listings
26.3% of total
Key Insights
- The most prevalent minimum stay requirement in Santa Sofia is 1 Night, adopted by 47.4% of listings. This highlights the market's preference for shorter, flexible bookings.
- A strong majority (68.5%) of the Santa Sofia Airbnb data shows acceptance of very short stays (1-2 nights), indicating a dynamic, high-turnover market.
Recommendations
- Align with the market by considering a 1 Night minimum stay, as 47.4% of Santa Sofia hosts use this setting.
- Adjust minimum nights based on seasonality – potentially shorter during low season and longer during peak demand periods in Santa Sofia.
Santa Sofia Airbnb Cancellation Policy Trends Analysis (2025)
Super Strict 60 Days
1 listings
8.3% of total
Super Strict 30 Days
1 listings
8.3% of total
Flexible
4 listings
33.3% of total
Moderate
6 listings
50% of total
Cancellation Policy Insights for Santa Sofia
- The prevailing Airbnb cancellation policy trend in Santa Sofia is Moderate, used by 50% of listings.
- The market strongly favors guest-friendly terms, with 83.3% of listings offering Flexible or Moderate policies. This suggests guests in Santa Sofia may expect booking flexibility.
Recommendations for Hosts
- Consider adopting a Moderate policy to align with the 50% market standard in Santa Sofia.
- Regularly review your cancellation policy against competitors and market demand shifts in Santa Sofia.
Santa Sofia STR Booking Lead Time Analysis (2025)
Average Booking Lead Time by Month
Booking Lead Time Insights for Santa Sofia
- The overall average booking lead time for vacation rentals in Santa Sofia is 40 days.
- Guests book furthest in advance for stays during October (average 72 days), likely coinciding with peak travel demand or local events.
- The shortest booking windows occur for stays in November (average 4 days), indicating more last-minute travel plans during this time.
- Seasonally, Fall (49 days avg.) sees the longest lead times, while Spring (17 days avg.) has the shortest, reflecting typical travel planning cycles.
Recommendations for Hosts
- Use the overall average lead time (40 days) as a baseline for your pricing and availability strategy in Santa Sofia.
- For October stays, consider implementing length-of-stay discounts or slightly higher rates for bookings made less than 72 days out to capitalize on advance planning.
- During November, focus on last-minute booking availability and promotions, as guests book with very short notice (4 days avg.).
- Target marketing efforts for the Fall season well in advance (at least 49 days) to capture early planners.
- Monitor your own booking lead times against these Santa Sofia averages to identify opportunities for dynamic pricing adjustments.
Popular & Essential Airbnb Amenities in Santa Sofia (2025)
Amenity Prevalence
Amenity Insights for Santa Sofia
- Essential amenities in Santa Sofia that guests expect include: Heating, Essentials. Lacking these (any) could significantly impact bookings.
- Popular amenities like TV, Wifi, Kitchen are common but not universal. Offering these can provide a competitive edge.
- Warning: Wifi is not universally provided but is considered essential globally. Ensure reliable Wifi is offered.
Recommendations for Hosts
- Ensure your listing includes all essential amenities for Santa Sofia: Heating, Essentials.
- Consider adding popular differentiators like TV or Wifi to increase appeal.
- Highlight unique or less common amenities you offer (e.g., hot tub, dedicated workspace, EV charger) in your listing description and photos.
- Regularly check competitor amenities in Santa Sofia to stay competitive.
Santa Sofia Airbnb Guest Demographics & Profile Analysis (2025)
Guest Profile Summary for Santa Sofia
- The typical guest profile for Airbnb in Santa Sofia consists of a mix of domestic (63%) and international guests, often arriving from nearby Rome, typically belonging to the Post-2000s (Gen Z/Alpha) group (50%), primarily speaking English or Spanish.
- Domestic travelers account for 63.3% of guests.
- Key international markets include Italy (63.3%) and France (10%).
- Top languages spoken are English (30.4%) followed by Spanish (19.6%).
- A significant demographic segment is the Post-2000s (Gen Z/Alpha) group, representing 50% of guests.
Recommendations for Hosts
- Target domestic marketing efforts towards travelers from Rome and Rennes.
- Tailor amenities and listing descriptions to appeal to the dominant Post-2000s (Gen Z/Alpha) demographic (e.g., highlight fast WiFi, smart home features, local guides).
- Highlight unique local experiences or amenities relevant to the primary guest profile.
- Consider seasonal promotions aligned with peak travel times for key origin markets.
Nearby Short-Term Rental Market Comparison
How does the Santa Sofia Airbnb market stack up against its neighbors? Compare key performance metrics like average monthly revenue, ADR, and occupancy rates in surrounding areas to understand the broader regional STR landscape.
| Market | Active Properties | Monthly Revenue | Daily Rate | Avg. Occupancy |
|---|---|---|---|---|
| Crespina | 16 | $3,526 | $493.64 | 48% |
| Tignano | 10 | $3,391 | $500.31 | 36% |
| Luni Mare | 11 | $3,102 | $169.59 | 40% |
| Buonconvento | 59 | $3,068 | $456.70 | 46% |
| Castelfranco di Sotto | 47 | $2,881 | $294.54 | 38% |
| Collazzone | 28 | $2,839 | $341.11 | 36% |
| Florence | 9,598 | $2,833 | $208.48 | 52% |
| Marcialla | 25 | $2,788 | $236.61 | 54% |
| Parrano | 18 | $2,762 | $329.95 | 34% |
| Impruneta | 131 | $2,761 | $237.93 | 45% |