Modigliana Airbnb Market Analysis 2025: Short Term Rental Data & Vacation Rental Statistics in Emilia-Romagna, Italy
Is Airbnb profitable in Modigliana in 2025? Explore comprehensive Airbnb analytics for Modigliana, Emilia-Romagna, Italy to uncover income potential. This 2025 STR market report for Modigliana, based on AirROI data from April 2024 to March 2025, reveals key trends in the niche market of 17 active listings.
Whether you're considering an Airbnb investment in Modigliana, optimizing your existing vacation rental, or exploring rental arbitrage opportunities, understanding the Modigliana Airbnb data is crucial. Navigating the high regulation landscape is key to maximizing your short term rental income potential. Let's dive into the specifics.
Key Modigliana Airbnb Performance Metrics Overview
Monthly Airbnb Revenue Variations & Income Potential in Modigliana (2025)
Understanding the monthly revenue variations for Airbnb listings in Modigliana is key to maximizing your short term rental income potential. Seasonality significantly impacts earnings. Our analysis, based on data from the past 12 months, shows that the peak revenue month for STRs in Modigliana is typically May, while January often presents the lowest earnings, highlighting opportunities for strategic pricing adjustments during shoulder and low seasons. Explore the typical Airbnb income in Modigliana across different performance tiers:
- Best-in-class properties (Top 10%) achieve $3,168+ monthly, often utilizing dynamic pricing and superior guest experiences.
- Strong performing properties (Top 25%) earn $1,635 or more, indicating effective management and desirable locations/amenities.
- Typical properties (Median) generate around $947 per month, representing the average market performance.
- Entry-level properties (Bottom 25%) see earnings around $612, often with potential for optimization.
Average Monthly Airbnb Earnings Trend in Modigliana
Modigliana Airbnb Occupancy Rate Trends (2025)
Maximize your bookings by understanding the Modigliana STR occupancy trends. Seasonal demand shifts significantly influence how often properties are booked. Typically, Februarysees the highest demand (peak season occupancy), while December experiences the lowest (low season). Effective strategies, like adjusting minimum stays or offering promotions, can boost occupancy during slower periods. Here's how different property tiers perform in Modigliana:
- Best-in-class properties (Top 10%) achieve 68%+ occupancy, indicating high desirability and potentially optimized availability.
- Strong performing properties (Top 25%) maintain 41% or higher occupancy, suggesting good market fit and guest satisfaction.
- Typical properties (Median) have an occupancy rate around 23%.
- Entry-level properties (Bottom 25%) average 18% occupancy, potentially facing higher vacancy.
Average Monthly Occupancy Rate Trend in Modigliana
Average Daily Rate (ADR) Airbnb Trends in Modigliana (2025)
Effective short term rental pricing strategy in Modigliana involves understanding monthly ADR fluctuations. The Average Daily Rate (ADR) for Airbnb in Modigliana typically peaks in August and dips lowest during November. Leveraging Airbnb dynamic pricing tools or strategies based on this seasonality can significantly boost revenue. Here's a look at the typical nightly rates achieved:
- Best-in-class properties (Top 10%) command rates of $472+ per night, often due to premium features or locations.
- Strong performing properties (Top 25%) achieve nightly rates of $196 or more.
- Typical properties (Median) charge around $134 per night.
- Entry-level properties (Bottom 25%) earn around $91 per night.
Average Daily Rate (ADR) Trend by Month in Modigliana
Get Live Modigliana Market Intelligence 👇

Explore Real-time Analytics
Airbnb Seasonality Analysis & Trends in Modigliana (2025)
Peak Season (May, August, June)
- Revenue averages $2,445 per month
- Occupancy rates average 33.9%
- Daily rates average $220
Shoulder Season
- Revenue averages $1,551 per month
- Occupancy maintains around 39.9%
- Daily rates hold near $199
Low Season (January, March, December)
- Revenue drops to average $592 per month
- Occupancy decreases to average 18.4%
- Daily rates adjust to average $171
Seasonality Insights for Modigliana
- The Airbnb seasonality in Modigliana shows highly seasonal trends requiring careful strategy. While the sections above show seasonal averages, it's also insightful to look at the extremes:
- During the high season, the absolute peak month showcases Modigliana's highest earning potential, with monthly revenues capable of climbing to $2,737, occupancy reaching a high of 85.7%, and ADRs peaking at $223.
- Conversely, the slowest single month of the year, typically falling within the low season, marks the market's lowest point. In this month, revenue might dip to $462, occupancy could drop to 13.4%, and ADRs may adjust down to $162.
- Understanding both the seasonal averages and these monthly peaks and troughs in revenue, occupancy, and ADR is crucial for maximizing your Airbnb profit potential in Modigliana.
Seasonal Strategies for Maximizing Profit
- Peak Season: Maximize revenue through premium pricing and potentially longer minimum stays. Ensure high availability.
- Low Season: Offer competitive pricing, special promotions (e.g., extended stay discounts), and flexible cancellation policies. Target off-season travelers like remote workers or budget-conscious guests.
- Shoulder Seasons: Implement dynamic pricing that balances peak and low rates. Target weekend travelers or specific events. Offer slightly more flexible terms than peak season.
- Regularly analyze your own performance against these Modigliana seasonality benchmarks and adjust your pricing and availability strategy accordingly.
Best Areas for Airbnb Investment in Modigliana (2025)
Exploring the top neighborhoods for short-term rentals in Modigliana? This section highlights key areas, outlining why they are attractive for hosts and guests, along with notable local attractions. Consider these locations based on your target guest profile and investment strategy.
| Neighborhood / Area | Why Host Here? (Target Guests & Appeal) | Key Attractions & Landmarks |
|---|---|---|
| Centro Storico | The historic center of Modigliana, featuring beautiful medieval architecture and charming streets. It is attractive for tourists who appreciate history and culture. | Church of San Francesco, Palazzo Azzalini, Piazza della Libertà, Castello di Modigliana, Museo Civico |
| Parco della Resistenza | A serene park area in Modigliana, ideal for nature lovers and families. Provides a peaceful retreat with walking trails and natural beauty. | Parco della Resistenza, Picnic areas, Walking paths |
| Via Roma | A central street known for its shops and local eateries. Offers visitors a vibrant local experience and easy access to various amenities. | Local shops, Cafés, Restaurants, Open-air markets |
| Colline di Modigliana | The surrounding hills offer stunning views and a chance to experience the rural beauty of Emilia-Romagna. Popular for agriturismo stays and wine tours. | Vineyards, Olive groves, Hiking trails, Scenic viewpoints |
| Frazione di Pieve | A quaint village nearby featuring picturesque landscapes and a quieter lifestyle. Great for guests seeking peace and a taste of local life. | Historic buildings, Local festivals, Panoramic views |
| Castellina | An intriguing area with historical ruins and nature. It’s perfect for tourists interested in exploration and outdoor activities. | Ruins of ancient structures, Walking trails, Natural sights |
| Local Food Markets | Modigliana is known for its culinary delights and local produce. An area that attracts food enthusiasts and those interested in the local cuisine. | Weekly farmers market, Gastronomy events, Local specialties tastings |
| Nearby Faenza | Just a short drive away, Faenza is known for its ceramics and beautiful architecture. It offers additional attractions and activities for visitors. | Faenza Cathedral, Ceramics Museum, Piazza del Popolo, Local galleries |
Understanding Airbnb License Requirements & STR Laws in Modigliana (2025)
Yes, Modigliana, Emilia-Romagna, Italy enforces high STR regulations. Obtaining a license and ensuring compliance is almost certainly required according to current 2025 STR laws. Always verify the latest short term rental regulations and Airbnb license requirements directly with local government authorities for Modigliana to ensure full compliance before hosting.
(Source: AirROI data, 2025, based on 47% licensed listings)
Top Performing Airbnb Properties in Modigliana (2025)
Benchmark your potential! Explore examples of top-performing Airbnb properties in Modiglianabased on Trailing Twelve Month (TTM) revenue. Analyze their characteristics, revenue, occupancy rate, and ADR to understand what drives success in this market.
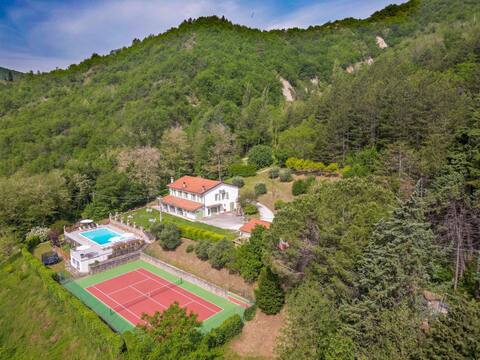
Villa-Benini pool tennis nature countryside
Entire Place • 6 bedrooms
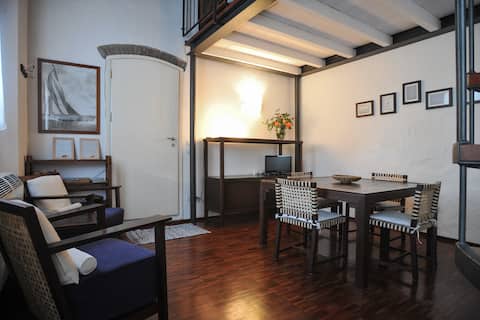
Cozy loft with double garden
Entire Place • 1 bedroom
LeC Family B&B
Entire Place • 2 bedrooms

La Casina Blu
Entire Place • 1 bedroom
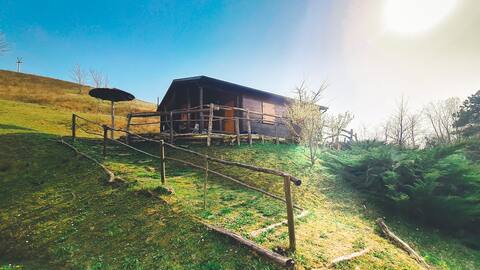
Panoramic bungalow
Entire Place • 2 bedrooms
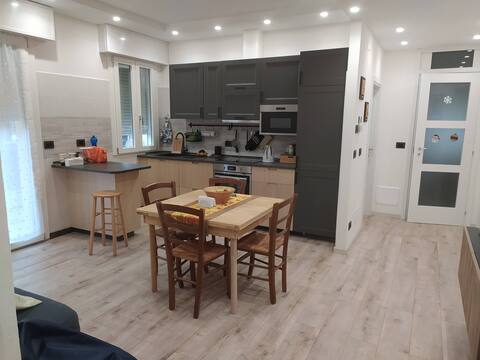
Confortevole appartamento con parcheggio gratuito
Entire Place • 2 bedrooms
Note: Performance varies based on location, size, amenities, seasonality, and management quality. Data reflects the past 12 months.
Top Performing Airbnb Hosts in Modigliana (2025)
Learn from the best! This table showcases top-performing Airbnb hosts in Modigliana based on the number of properties managed and estimated total revenue over the past year. Analyze their scale and performance metrics.
| Host Name | Properties | Grossing Revenue | Stay Reviews | Avg Rating |
|---|---|---|---|---|
| Guido | 1 | $58,024 | 14 | 4.86/5.0 |
| Alessandra | 1 | $15,204 | 84 | 4.81/5.0 |
| La Luna Sul Trebbio | 2 | $11,319 | 45 | 4.75/5.0 |
| Olga | 1 | $10,169 | 15 | 5.00/5.0 |
| Host #7302225 | 1 | $9,074 | 8 | 5.00/5.0 |
| Antonella | 3 | $7,829 | 14 | 4.90/5.0 |
| Host #476365182 | 1 | $6,615 | 0 | 0.00/5.0 |
| Teresa | 2 | $5,408 | 3 | 2.50/5.0 |
| Host #19683695 | 1 | $2,710 | 1 | 0.00/5.0 |
| Host #431966971 | 1 | $1,792 | 1 | 0.00/5.0 |
Analyzing the strategies of top hosts, such as their property selection, pricing, and guest communication, can offer valuable lessons for optimizing your own Airbnb operations in Modigliana.
Dive Deeper: Advanced Modigliana STR Market Data (2025)
Ready to unlock more insights? AirROI provides access to advanced metrics and comprehensive Airbnb data for Modigliana. Explore detailed analytics beyond this report to refine your investment strategy, optimize pricing, and maximize your vacation rental profits.
Explore Advanced MetricsModigliana Short-Term Rental Market Composition (2025): Property & Room Types
Room Type Distribution
Property Type Distribution
Market Composition Insights for Modigliana
- The Modigliana Airbnb market composition is heavily skewed towards Entire Home/Apt listings, which make up 88.2% of the 17 active rentals. This indicates strong guest preference for privacy and space.
- Looking at the property type distribution in Modigliana, Apartment/Condo properties are the most common (52.9%), reflecting the local real estate landscape.
- Houses represent a significant 35.3% portion, catering likely to families or larger groups.
Modigliana Airbnb Room Capacity Analysis (2025): Bedroom Distribution
Distribution of Listings by Number of Bedrooms
Room Capacity Insights for Modigliana
- The dominant room capacity in Modigliana is 1 bedroom listings, making up 41.2% of the market. This suggests a strong demand for properties suitable for couples or solo travelers.
- Together, 1 bedroom and 2 bedrooms properties represent 76.5% of the active Airbnb listings in Modigliana, indicating a high concentration in these sizes.
Modigliana Vacation Rental Guest Capacity Trends (2025)
Distribution of Listings by Guest Capacity
Guest Capacity Insights for Modigliana
- The most common guest capacity trend in Modigliana vacation rentals is listings accommodating 5 guests (23.5%). This suggests the primary traveler segment is likely larger groups.
- Properties designed for 5 guests and 6 guests dominate the Modigliana STR market, accounting for 41.1% of listings.
- 23.5% of properties accommodate 6+ guests, serving the market segment for larger families or group travel in Modigliana.
- On average, properties in Modigliana are equipped to host 3.9 guests.
Modigliana Airbnb Booking Patterns (2025): Available vs. Booked Days
Available Days Distribution
Booked Days Distribution
Booking Pattern Insights for Modigliana
- The most common availability pattern in Modigliana falls within the 271-366 days range, representing 76.5% of listings. This suggests many properties have significant open periods on their calendars.
- Approximately 94.1% of listings show high availability (181+ days open annually), indicating potential for increased bookings or specific owner usage patterns.
- For booked days, the 1-30 days range is most frequent in Modigliana (58.8%), reflecting common guest stay durations or potential owner blocking patterns.
- A notable 11.8% of properties secure long booking periods (181+ days booked per year), highlighting successful long-term rental strategies or significant owner usage.
Modigliana Airbnb Minimum Stay Requirements Analysis
Distribution of Listings by Minimum Night Requirement
1 Night
6 listings
42.9% of total
2 Nights
3 listings
21.4% of total
3 Nights
2 listings
14.3% of total
4-6 Nights
1 listings
7.1% of total
7-29 Nights
1 listings
7.1% of total
30+ Nights
1 listings
7.1% of total
Key Insights
- The most prevalent minimum stay requirement in Modigliana is 1 Night, adopted by 42.9% of listings. This highlights the market's preference for shorter, flexible bookings.
- A strong majority (64.3%) of the Modigliana Airbnb data shows acceptance of very short stays (1-2 nights), indicating a dynamic, high-turnover market.
Recommendations
- Align with the market by considering a 1 Night minimum stay, as 42.9% of Modigliana hosts use this setting.
- Explore offering discounts for stays of 30+ nights to attract the 7.1% of the market seeking extended stays.
- Adjust minimum nights based on seasonality – potentially shorter during low season and longer during peak demand periods in Modigliana.
Modigliana Airbnb Cancellation Policy Trends Analysis (2025)
Super Strict 30 Days
2 listings
16.7% of total
Flexible
5 listings
41.7% of total
Moderate
2 listings
16.7% of total
Strict
3 listings
25% of total
Cancellation Policy Insights for Modigliana
- The prevailing Airbnb cancellation policy trend in Modigliana is Flexible, used by 41.7% of listings.
- There's a relatively balanced mix between guest-friendly (58.4%) and stricter (25.0%) policies, offering choices for different guest needs.
Recommendations for Hosts
- Consider adopting a Flexible policy to align with the 41.7% market standard in Modigliana.
- Regularly review your cancellation policy against competitors and market demand shifts in Modigliana.
Modigliana STR Booking Lead Time Analysis (2025)
Average Booking Lead Time by Month
Booking Lead Time Insights for Modigliana
- The overall average booking lead time for vacation rentals in Modigliana is 59 days.
- Guests book furthest in advance for stays during October (average 96 days), likely coinciding with peak travel demand or local events.
- The shortest booking windows occur for stays in November (average 0 days), indicating more last-minute travel plans during this time.
- Seasonally, Summer (80 days avg.) sees the longest lead times, while Fall (52 days avg.) has the shortest, reflecting typical travel planning cycles.
Recommendations for Hosts
- Use the overall average lead time (59 days) as a baseline for your pricing and availability strategy in Modigliana.
- For October stays, consider implementing length-of-stay discounts or slightly higher rates for bookings made less than 96 days out to capitalize on advance planning.
- During November, focus on last-minute booking availability and promotions, as guests book with very short notice (0 days avg.).
- Target marketing efforts for the Summer season well in advance (at least 80 days) to capture early planners.
- Monitor your own booking lead times against these Modigliana averages to identify opportunities for dynamic pricing adjustments.
Popular & Essential Airbnb Amenities in Modigliana (2025)
Amenity Prevalence
Amenity Insights for Modigliana
- Essential amenities in Modigliana that guests expect include: Heating, Wifi. Lacking these (any) could significantly impact bookings.
- Popular amenities like Hot water, Kitchen, Private entrance are common but not universal. Offering these can provide a competitive edge.
Recommendations for Hosts
- Ensure your listing includes all essential amenities for Modigliana: Heating, Wifi.
- Consider adding popular differentiators like Hot water or Kitchen to increase appeal.
- Highlight unique or less common amenities you offer (e.g., hot tub, dedicated workspace, EV charger) in your listing description and photos.
- Regularly check competitor amenities in Modigliana to stay competitive.
Modigliana Airbnb Guest Demographics & Profile Analysis (2025)
Guest Profile Summary for Modigliana
- The typical guest profile for Airbnb in Modigliana consists of a mix of domestic (36%) and international guests, with top international origins including France, typically belonging to the 1990s (Older Gen Z) group (50%), primarily speaking English or French.
- Domestic travelers account for 36.0% of guests.
- Key international markets include Italy (36%) and France (20%).
- Top languages spoken are English (33.3%) followed by French (16.7%).
- A significant demographic segment is the Post-2000s (Gen Z/Alpha) group, representing 50% of guests.
Recommendations for Hosts
- Focus marketing internationally, particularly towards travelers from France.
- Tailor amenities and listing descriptions to appeal to the dominant 1990s (Older Gen Z) demographic (e.g., highlight fast WiFi, smart home features, local guides).
- Highlight unique local experiences or amenities relevant to the primary guest profile.
- Consider seasonal promotions aligned with peak travel times for key origin markets.
Nearby Short-Term Rental Market Comparison
How does the Modigliana Airbnb market stack up against its neighbors? Compare key performance metrics like average monthly revenue, ADR, and occupancy rates in surrounding areas to understand the broader regional STR landscape.
| Market | Active Properties | Monthly Revenue | Daily Rate | Avg. Occupancy |
|---|---|---|---|---|
| Brenzone sul Garda | 19 | $4,128 | $335.25 | 52% |
| Crespina | 16 | $3,526 | $493.64 | 48% |
| Venice | 6,405 | $3,454 | $238.80 | 53% |
| Tignano | 10 | $3,391 | $500.31 | 36% |
| Luni Mare | 11 | $3,102 | $169.59 | 40% |
| Buonconvento | 59 | $3,068 | $456.70 | 46% |
| Cazzago San Martino | 14 | $3,018 | $474.20 | 28% |
| Castelfranco di Sotto | 47 | $2,881 | $294.54 | 38% |
| Florence | 9,598 | $2,833 | $208.48 | 52% |
| Marcialla | 25 | $2,788 | $236.61 | 54% |