Mirandola Airbnb Market Analysis 2025: Short Term Rental Data & Vacation Rental Statistics in Emilia-Romagna, Italy
Is Airbnb profitable in Mirandola in 2025? Explore comprehensive Airbnb analytics for Mirandola, Emilia-Romagna, Italy to uncover income potential. This 2025 STR market report for Mirandola, based on AirROI data from April 2024 to March 2025, reveals key trends in the niche market of 21 active listings.
Whether you're considering an Airbnb investment in Mirandola, optimizing your existing vacation rental, or exploring rental arbitrage opportunities, understanding the Mirandola Airbnb data is crucial. Understanding the local regulations is key to maximizing your short term rental income potential. Let's dive into the specifics.
Key Mirandola Airbnb Performance Metrics Overview
Monthly Airbnb Revenue Variations & Income Potential in Mirandola (2025)
Understanding the monthly revenue variations for Airbnb listings in Mirandola is key to maximizing your short term rental income potential. Seasonality significantly impacts earnings. Our analysis, based on data from the past 12 months, shows that the peak revenue month for STRs in Mirandola is typically June, while December often presents the lowest earnings, highlighting opportunities for strategic pricing adjustments during shoulder and low seasons. Explore the typical Airbnb income in Mirandola across different performance tiers:
- Best-in-class properties (Top 10%) achieve $2,513+ monthly, often utilizing dynamic pricing and superior guest experiences.
- Strong performing properties (Top 25%) earn $1,903 or more, indicating effective management and desirable locations/amenities.
- Typical properties (Median) generate around $994 per month, representing the average market performance.
- Entry-level properties (Bottom 25%) see earnings around $592, often with potential for optimization.
Average Monthly Airbnb Earnings Trend in Mirandola
Mirandola Airbnb Occupancy Rate Trends (2025)
Maximize your bookings by understanding the Mirandola STR occupancy trends. Seasonal demand shifts significantly influence how often properties are booked. Typically, Junesees the highest demand (peak season occupancy), while October experiences the lowest (low season). Effective strategies, like adjusting minimum stays or offering promotions, can boost occupancy during slower periods. Here's how different property tiers perform in Mirandola:
- Best-in-class properties (Top 10%) achieve 63%+ occupancy, indicating high desirability and potentially optimized availability.
- Strong performing properties (Top 25%) maintain 44% or higher occupancy, suggesting good market fit and guest satisfaction.
- Typical properties (Median) have an occupancy rate around 26%.
- Entry-level properties (Bottom 25%) average 18% occupancy, potentially facing higher vacancy.
Average Monthly Occupancy Rate Trend in Mirandola
Average Daily Rate (ADR) Airbnb Trends in Mirandola (2025)
Effective short term rental pricing strategy in Mirandola involves understanding monthly ADR fluctuations. The Average Daily Rate (ADR) for Airbnb in Mirandola typically peaks in November and dips lowest during August. Leveraging Airbnb dynamic pricing tools or strategies based on this seasonality can significantly boost revenue. Here's a look at the typical nightly rates achieved:
- Best-in-class properties (Top 10%) command rates of $255+ per night, often due to premium features or locations.
- Strong performing properties (Top 25%) achieve nightly rates of $187 or more.
- Typical properties (Median) charge around $121 per night.
- Entry-level properties (Bottom 25%) earn around $44 per night.
Average Daily Rate (ADR) Trend by Month in Mirandola
Get Live Mirandola Market Intelligence 👇
Explore Real-time Analytics
Airbnb Seasonality Analysis & Trends in Mirandola (2025)
Peak Season (June, July, April)
- Revenue averages $2,042 per month
- Occupancy rates average 45.9%
- Daily rates average $116
Shoulder Season
- Revenue averages $1,193 per month
- Occupancy maintains around 31.4%
- Daily rates hold near $125
Low Season (February, October, December)
- Revenue drops to average $757 per month
- Occupancy decreases to average 23.2%
- Daily rates adjust to average $127
Seasonality Insights for Mirandola
- The Airbnb seasonality in Mirandola shows highly seasonal trends requiring careful strategy. While the sections above show seasonal averages, it's also insightful to look at the extremes:
- During the high season, the absolute peak month showcases Mirandola's highest earning potential, with monthly revenues capable of climbing to $2,418, occupancy reaching a high of 51.1%, and ADRs peaking at $148.
- Conversely, the slowest single month of the year, typically falling within the low season, marks the market's lowest point. In this month, revenue might dip to $716, occupancy could drop to 21.9%, and ADRs may adjust down to $114.
- Understanding both the seasonal averages and these monthly peaks and troughs in revenue, occupancy, and ADR is crucial for maximizing your Airbnb profit potential in Mirandola.
Seasonal Strategies for Maximizing Profit
- Peak Season: Maximize revenue through premium pricing and potentially longer minimum stays. Ensure high availability.
- Low Season: Offer competitive pricing, special promotions (e.g., extended stay discounts), and flexible cancellation policies. Target off-season travelers like remote workers or budget-conscious guests.
- Shoulder Seasons: Implement dynamic pricing that balances peak and low rates. Target weekend travelers or specific events. Offer slightly more flexible terms than peak season.
- Regularly analyze your own performance against these Mirandola seasonality benchmarks and adjust your pricing and availability strategy accordingly.
Best Areas for Airbnb Investment in Mirandola (2025)
Exploring the top neighborhoods for short-term rentals in Mirandola? This section highlights key areas, outlining why they are attractive for hosts and guests, along with notable local attractions. Consider these locations based on your target guest profile and investment strategy.
| Neighborhood / Area | Why Host Here? (Target Guests & Appeal) | Key Attractions & Landmarks |
|---|---|---|
| Historical Center | The heart of Mirandola, filled with historical landmarks and charming architecture. Ideal for tourists exploring the rich history and culture of the town. | Castello di Mirandola, Piazza della Repubblica, San Francesco Church, Palazzo comunale, Museo Civico |
| Parco della Resistenza | A beautiful park area with green spaces, perfect for families and outdoor enthusiasts. Attracts visitors looking to relax and enjoy nature. | Walking paths, Playgrounds, Picnic areas, Outdoor sports facilities |
| Mirandola's Local Markets | Experience the local lifestyle through vibrant markets. A great place for tourists to taste local cuisine and buy unique handmade products. | Weekly markets, Local artisans, Food stalls, Craft fairs |
| Museum of Mirandola | A cultural hub showcasing local art and history. Attracts visitors who are interested in learning about the town's heritage. | Art exhibitions, Historical artifacts, Cultural events |
| Nearby Countryside | The beautiful countryside surrounding Mirandola offers a tranquil escape with picturesque landscapes. Perfect for nature lovers and those seeking peace. | Vineyards, Farmhouses, Nature trails, Biking routes |
| Festivities Area | Mirandola is known for its vibrant festivals throughout the year. Visitors are drawn to experience the local culture and traditions during these events. | Local festivals, Food festivals, Cultural parades |
| Culinary Hub | Mirandola offers exquisite dining options that celebrate local Emilia-Romagna cuisine. Attracts food enthusiasts and culinary tourists. | Local trattorias, Wine bars, Cooking classes, Food tours |
| Family Fun Zone | This area is perfect for family-oriented activities, featuring amusement options that appeal to kids and parents alike. | Amusement parks, Family entertainment centers, Cinemas, Kid-friendly restaurants |
Understanding Airbnb License Requirements & STR Laws in Mirandola (2025)
With 29% of listings showing registration in 2025, understanding potential Airbnb license requirements is crucial in Mirandola. Always verify the latest short term rental regulations and Airbnb license requirements directly with local government authorities for Mirandola to ensure full compliance before hosting.
(Source: AirROI data, 2025, based on 29% licensed listings)
Top Performing Airbnb Properties in Mirandola (2025)
Benchmark your potential! Explore examples of top-performing Airbnb properties in Mirandolabased on Trailing Twelve Month (TTM) revenue. Analyze their characteristics, revenue, occupancy rate, and ADR to understand what drives success in this market.
![[Casa Pico]-Central with parking Netflix Wi-Fi](https://a0.muscache.com/im/pictures/hosting/Hosting-U3RheVN1cHBseUxpc3Rpbmc6NjQxODg0MTc0ODMxMzIzODg5/original/d09414af-1afd-46c1-9981-1834fa92aff4.jpeg?im_w=480&im_format=avif)
[Casa Pico]-Central with parking Netflix Wi-Fi
Entire Place • 2 bedrooms
Stanza 11 in Villa La Personala
Private Room • 1 bedroom
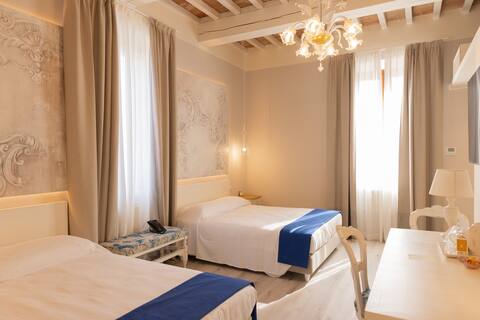
![[Piazza della Constituente] Double room & bathroom](https://a0.muscache.com/im/pictures/miso/Hosting-792631493859984888/original/b9da7317-e04b-4ce4-bd15-cc10923f939b.jpeg?im_w=480&im_format=avif)
[Piazza della Constituente] Double room & bathroom
Private Room • N/A
The Rooms of the Pico-Passador Costituent bathroom and WiFi
Private Room • N/A

Verdi Valli B&B Mirandola
Entire Place • 1 bedroom
-The Pico-Centro Rooms A/C Private WC Wi-Fi
Private Room • N/A
Note: Performance varies based on location, size, amenities, seasonality, and management quality. Data reflects the past 12 months.
Top Performing Airbnb Hosts in Mirandola (2025)
Learn from the best! This table showcases top-performing Airbnb hosts in Mirandola based on the number of properties managed and estimated total revenue over the past year. Analyze their scale and performance metrics.
| Host Name | Properties | Grossing Revenue | Stay Reviews | Avg Rating |
|---|---|---|---|---|
| Villa | 10 | $63,838 | 11 | 0.50/5.0 |
| HILL.CO Di Ferrari Riccardo | 4 | $62,218 | 32 | 4.92/5.0 |
| Tibi Valentin | 1 | $25,729 | 58 | 4.78/5.0 |
| Valentina | 1 | $14,437 | 6 | 5.00/5.0 |
| Host #229846799 | 1 | $7,494 | 1 | 0.00/5.0 |
| Host #128387087 | 1 | $3,449 | 16 | 5.00/5.0 |
| Antonio | 1 | $2,843 | 64 | 4.83/5.0 |
| Host #40670037 | 1 | $2,578 | 38 | 4.92/5.0 |
| Antonella | 1 | $217 | 13 | 4.77/5.0 |
Analyzing the strategies of top hosts, such as their property selection, pricing, and guest communication, can offer valuable lessons for optimizing your own Airbnb operations in Mirandola.
Dive Deeper: Advanced Mirandola STR Market Data (2025)
Ready to unlock more insights? AirROI provides access to advanced metrics and comprehensive Airbnb data for Mirandola. Explore detailed analytics beyond this report to refine your investment strategy, optimize pricing, and maximize your vacation rental profits.
Explore Advanced MetricsMirandola Short-Term Rental Market Composition (2025): Property & Room Types
Room Type Distribution
Property Type Distribution
Market Composition Insights for Mirandola
- The Mirandola Airbnb market composition is heavily skewed towards Private Room listings, which make up 81% of the 21 active rentals. This indicates strong guest preference for privacy and space.
- Looking at the property type distribution in Mirandola, Hotel/Boutique properties are the most common (47.6%), reflecting the local real estate landscape.
- Houses represent a significant 23.8% portion, catering likely to families or larger groups.
- The presence of 47.6% Hotel/Boutique listings indicates integration with traditional hospitality.
- Smaller segments like others (combined 4.8%) offer potential for unique stay experiences.
Mirandola Airbnb Room Capacity Analysis (2025): Bedroom Distribution
Distribution of Listings by Number of Bedrooms
Room Capacity Insights for Mirandola
- The dominant room capacity in Mirandola is 1 bedroom listings, making up 61.9% of the market. This suggests a strong demand for properties suitable for couples or solo travelers.
- Together, 1 bedroom and 2 bedrooms properties represent 71.4% of the active Airbnb listings in Mirandola, indicating a high concentration in these sizes.
- With over half the market (61.9%) consisting of studios or 1-bedroom units, Mirandola is particularly well-suited for individuals or couples.
- Listings with 3+ bedrooms (4.8%) represent a smaller niche, potentially indicating an underserved market for larger group accommodations in Mirandola.
Mirandola Vacation Rental Guest Capacity Trends (2025)
Distribution of Listings by Guest Capacity
Guest Capacity Insights for Mirandola
- The most common guest capacity trend in Mirandola vacation rentals is listings accommodating 2 guests (47.6%). This suggests the primary traveler segment is likely couples or solo travelers.
- Properties designed for 2 guests and 4 guests dominate the Mirandola STR market, accounting for 61.9% of listings.
- A significant 52.4% of listings cater specifically to 1-2 guests, highlighting strong demand from couples and solo travelers in Mirandola.
- Listings for large groups (6+ guests) are relatively rare (4.8%), potentially indicating an opportunity for hosts targeting this segment in Mirandola.
- On average, properties in Mirandola are equipped to host 1.9 guests.
Mirandola Airbnb Booking Patterns (2025): Available vs. Booked Days
Available Days Distribution
Booked Days Distribution
Booking Pattern Insights for Mirandola
- The most common availability pattern in Mirandola falls within the 271-366 days range, representing 66.7% of listings. This suggests many properties have significant open periods on their calendars.
- Approximately 95.3% of listings show high availability (181+ days open annually), indicating potential for increased bookings or specific owner usage patterns.
- For booked days, the 1-30 days range is most frequent in Mirandola (38.1%), reflecting common guest stay durations or potential owner blocking patterns.
- A notable 9.5% of properties secure long booking periods (181+ days booked per year), highlighting successful long-term rental strategies or significant owner usage.
Mirandola Airbnb Minimum Stay Requirements Analysis
Distribution of Listings by Minimum Night Requirement
1 Night
13 listings
68.4% of total
2 Nights
2 listings
10.5% of total
7-29 Nights
3 listings
15.8% of total
30+ Nights
1 listings
5.3% of total
Key Insights
- The most prevalent minimum stay requirement in Mirandola is 1 Night, adopted by 68.4% of listings. This highlights the market's preference for shorter, flexible bookings.
- A strong majority (78.9%) of the Mirandola Airbnb data shows acceptance of very short stays (1-2 nights), indicating a dynamic, high-turnover market.
Recommendations
- Align with the market by considering a 1 Night minimum stay, as 68.4% of Mirandola hosts use this setting.
- Explore offering discounts for stays of 30+ nights to attract the 5.3% of the market seeking extended stays.
- Adjust minimum nights based on seasonality – potentially shorter during low season and longer during peak demand periods in Mirandola.
Mirandola Airbnb Cancellation Policy Trends Analysis (2025)
Flexible
8 listings
80% of total
Moderate
2 listings
20% of total
Cancellation Policy Insights for Mirandola
- The prevailing Airbnb cancellation policy trend in Mirandola is Flexible, used by 80% of listings.
- The market strongly favors guest-friendly terms, with 100.0% of listings offering Flexible or Moderate policies. This suggests guests in Mirandola may expect booking flexibility.
Recommendations for Hosts
- Consider adopting a Flexible policy to align with the 80% market standard in Mirandola.
- Given the high prevalence of Flexible policies (80%), offering this can enhance booking appeal, especially during shoulder seasons.
- Regularly review your cancellation policy against competitors and market demand shifts in Mirandola.
Mirandola STR Booking Lead Time Analysis (2025)
Average Booking Lead Time by Month
Booking Lead Time Insights for Mirandola
- The overall average booking lead time for vacation rentals in Mirandola is 33 days.
- Guests book furthest in advance for stays during October (average 107 days), likely coinciding with peak travel demand or local events.
- The shortest booking windows occur for stays in August (average 11 days), indicating more last-minute travel plans during this time.
- Seasonally, Fall (50 days avg.) sees the longest lead times, while Summer (17 days avg.) has the shortest, reflecting typical travel planning cycles.
Recommendations for Hosts
- Use the overall average lead time (33 days) as a baseline for your pricing and availability strategy in Mirandola.
- For October stays, consider implementing length-of-stay discounts or slightly higher rates for bookings made less than 107 days out to capitalize on advance planning.
- During August, focus on last-minute booking availability and promotions, as guests book with very short notice (11 days avg.).
- Target marketing efforts for the Fall season well in advance (at least 50 days) to capture early planners.
- Monitor your own booking lead times against these Mirandola averages to identify opportunities for dynamic pricing adjustments.
Popular & Essential Airbnb Amenities in Mirandola (2025)
Amenity Prevalence
Amenity Insights for Mirandola
- Essential amenities in Mirandola that guests expect include: Hot water, Essentials, Heating, TV. Lacking these (any) could significantly impact bookings.
- Popular amenities like Free parking on premises, Air conditioning, Wifi are common but not universal. Offering these can provide a competitive edge.
- Warning: Wifi is not universally provided but is considered essential globally. Ensure reliable Wifi is offered.
Recommendations for Hosts
- Ensure your listing includes all essential amenities for Mirandola: Hot water, Essentials, Heating, TV.
- Prioritize adding missing essentials: Essentials, Heating, TV.
- Consider adding popular differentiators like Free parking on premises or Air conditioning to increase appeal.
- Highlight unique or less common amenities you offer (e.g., hot tub, dedicated workspace, EV charger) in your listing description and photos.
- Regularly check competitor amenities in Mirandola to stay competitive.
Mirandola Airbnb Guest Demographics & Profile Analysis (2025)
Guest Profile Summary for Mirandola
- The typical guest profile for Airbnb in Mirandola consists of a mix of domestic (40%) and international guests, with top international origins including Germany, typically belonging to the Post-2000s (Gen Z/Alpha) group (50%), primarily speaking English or Italian.
- Domestic travelers account for 39.6% of guests.
- Key international markets include Italy (39.6%) and Germany (18.8%).
- Top languages spoken are English (32.6%) followed by Italian (17.4%).
- A significant demographic segment is the Post-2000s (Gen Z/Alpha) group, representing 50% of guests.
Recommendations for Hosts
- Focus marketing internationally, particularly towards travelers from Germany.
- Tailor amenities and listing descriptions to appeal to the dominant Post-2000s (Gen Z/Alpha) demographic (e.g., highlight fast WiFi, smart home features, local guides).
- Highlight unique local experiences or amenities relevant to the primary guest profile.
- Consider seasonal promotions aligned with peak travel times for key origin markets.
Nearby Short-Term Rental Market Comparison
How does the Mirandola Airbnb market stack up against its neighbors? Compare key performance metrics like average monthly revenue, ADR, and occupancy rates in surrounding areas to understand the broader regional STR landscape.
| Market | Active Properties | Monthly Revenue | Daily Rate | Avg. Occupancy |
|---|---|---|---|---|
| Brenzone sul Garda | 19 | $4,128 | $335.25 | 52% |
| Crespina | 16 | $3,526 | $493.64 | 48% |
| Venice | 6,405 | $3,454 | $238.80 | 53% |
| Tignano | 10 | $3,391 | $500.31 | 36% |
| Luni Mare | 11 | $3,102 | $169.59 | 40% |
| Buonconvento | 59 | $3,068 | $456.70 | 46% |
| Cazzago San Martino | 14 | $3,018 | $474.20 | 28% |
| Castelfranco di Sotto | 47 | $2,881 | $294.54 | 38% |
| Florence | 9,598 | $2,833 | $208.48 | 52% |
| Marcialla | 25 | $2,788 | $236.61 | 54% |