Ferrara Airbnb Market Analysis 2025: Short Term Rental Data & Vacation Rental Statistics in Emilia-Romagna, Italy
Is Airbnb profitable in Ferrara in 2025? Explore comprehensive Airbnb analytics for Ferrara, Emilia-Romagna, Italy to uncover income potential. This 2025 STR market report for Ferrara, based on AirROI data from April 2024 to March 2025, reveals key trends in the market of 342 active listings.
Whether you're considering an Airbnb investment in Ferrara, optimizing your existing vacation rental, or exploring rental arbitrage opportunities, understanding the Ferrara Airbnb data is crucial. Navigating the high regulation landscape is key to maximizing your short term rental income potential. Let's dive into the specifics.
Key Ferrara Airbnb Performance Metrics Overview
Monthly Airbnb Revenue Variations & Income Potential in Ferrara (2025)
Understanding the monthly revenue variations for Airbnb listings in Ferrara is key to maximizing your short term rental income potential. Seasonality significantly impacts earnings. Our analysis, based on data from the past 12 months, shows that the peak revenue month for STRs in Ferrara is typically May, while January often presents the lowest earnings, highlighting opportunities for strategic pricing adjustments during shoulder and low seasons. Explore the typical Airbnb income in Ferrara across different performance tiers:
- Best-in-class properties (Top 10%) achieve $2,617+ monthly, often utilizing dynamic pricing and superior guest experiences.
- Strong performing properties (Top 25%) earn $1,879 or more, indicating effective management and desirable locations/amenities.
- Typical properties (Median) generate around $1,170 per month, representing the average market performance.
- Entry-level properties (Bottom 25%) see earnings around $548, often with potential for optimization.
Average Monthly Airbnb Earnings Trend in Ferrara
Ferrara Airbnb Occupancy Rate Trends (2025)
Maximize your bookings by understanding the Ferrara STR occupancy trends. Seasonal demand shifts significantly influence how often properties are booked. Typically, Septembersees the highest demand (peak season occupancy), while January experiences the lowest (low season). Effective strategies, like adjusting minimum stays or offering promotions, can boost occupancy during slower periods. Here's how different property tiers perform in Ferrara:
- Best-in-class properties (Top 10%) achieve 76%+ occupancy, indicating high desirability and potentially optimized availability.
- Strong performing properties (Top 25%) maintain 60% or higher occupancy, suggesting good market fit and guest satisfaction.
- Typical properties (Median) have an occupancy rate around 37%.
- Entry-level properties (Bottom 25%) average 17% occupancy, potentially facing higher vacancy.
Average Monthly Occupancy Rate Trend in Ferrara
Average Daily Rate (ADR) Airbnb Trends in Ferrara (2025)
Effective short term rental pricing strategy in Ferrara involves understanding monthly ADR fluctuations. The Average Daily Rate (ADR) for Airbnb in Ferrara typically peaks in December and dips lowest during April. Leveraging Airbnb dynamic pricing tools or strategies based on this seasonality can significantly boost revenue. Here's a look at the typical nightly rates achieved:
- Best-in-class properties (Top 10%) command rates of $162+ per night, often due to premium features or locations.
- Strong performing properties (Top 25%) achieve nightly rates of $117 or more.
- Typical properties (Median) charge around $88 per night.
- Entry-level properties (Bottom 25%) earn around $69 per night.
Average Daily Rate (ADR) Trend by Month in Ferrara
Get Live Ferrara Market Intelligence 👇

Explore Real-time Analytics
Airbnb Seasonality Analysis & Trends in Ferrara (2025)
Peak Season (May, June, April)
- Revenue averages $1,716 per month
- Occupancy rates average 39.8%
- Daily rates average $101
Shoulder Season
- Revenue averages $1,414 per month
- Occupancy maintains around 42.2%
- Daily rates hold near $106
Low Season (January, February, November)
- Revenue drops to average $1,084 per month
- Occupancy decreases to average 34.8%
- Daily rates adjust to average $105
Seasonality Insights for Ferrara
- The Airbnb seasonality in Ferrara shows moderate seasonality with distinct peak and low periods. While the sections above show seasonal averages, it's also insightful to look at the extremes:
- During the high season, the absolute peak month showcases Ferrara's highest earning potential, with monthly revenues capable of climbing to $1,788, occupancy reaching a high of 48.0%, and ADRs peaking at $118.
- Conversely, the slowest single month of the year, typically falling within the low season, marks the market's lowest point. In this month, revenue might dip to $926, occupancy could drop to 26.8%, and ADRs may adjust down to $100.
- Understanding both the seasonal averages and these monthly peaks and troughs in revenue, occupancy, and ADR is crucial for maximizing your Airbnb profit potential in Ferrara.
Seasonal Strategies for Maximizing Profit
- Peak Season: Maximize revenue through premium pricing and potentially longer minimum stays. Ensure high availability.
- Low Season: Offer competitive pricing, special promotions (e.g., extended stay discounts), and flexible cancellation policies. Target off-season travelers like remote workers or budget-conscious guests.
- Shoulder Seasons: Implement dynamic pricing that balances peak and low rates. Target weekend travelers or specific events. Offer slightly more flexible terms than peak season.
- Regularly analyze your own performance against these Ferrara seasonality benchmarks and adjust your pricing and availability strategy accordingly.
Best Areas for Airbnb Investment in Ferrara (2025)
Exploring the top neighborhoods for short-term rentals in Ferrara? This section highlights key areas, outlining why they are attractive for hosts and guests, along with notable local attractions. Consider these locations based on your target guest profile and investment strategy.
| Neighborhood / Area | Why Host Here? (Target Guests & Appeal) | Key Attractions & Landmarks |
|---|---|---|
| Centro Storico | The historic center of Ferrara, known for its Renaissance architecture and cultural landmarks. Ideal for tourists wanting to experience the rich history and art of the city. | Estense Castle, Cathedral of Ferrara, Palazzo dei Diamanti, Piazza Trento e Trieste, Museo Nazionale dell'Antartide, Via delle Volte |
| Este | A vibrant neighborhood close to the city center, Este is popular among visitors for its local dining and shopping experiences. Great for those wanting a blend of history and modern culture. | Parco Massari, Church of San Giorgio, Basilica di Sant'Antonio, Via Garibaldi, Local Market |
| Via Bologna | Lively area ideal for both business and leisure travelers. Known for its proximity to transport links and commercial activities, attracting a mix of short and long-term stays. | Basilica di San Giuseppe, Shopping streets, Restaurants and cafés, Transportation hub |
| Corso Ercole I d'Este | A picturesque street lined with historical buildings and art galleries. Great for tourists who appreciate architecture and want to enjoy local cultural events. | Palazzo dei Diamanti, Art galleries, Historical events, Scenic views |
| Barco | A residential yet vibrant area, Barco offers a more authentic local experience. Attracts visitors looking to immerse themselves in local life away from the main tourist paths. | Parco della Rimembranza, Local restaurants, Community events |
| Via Carri | A quieter area known for its charming streets and authentic local eateries. Offers a more relaxed atmosphere while still being close to the main attractions of Ferrara. | Parco Pareschi, Traditional restaurants, Cafés |
| San Giorgio | This area features a mix of historical buildings and modern amenities. It's well-suited for visitors who want easy access to both leisure activities and local culture. | Church of San Giorgio, Parks, Nearby market spots |
| Villa Fulvia | A residential district with spacious accommodations and family-friendly attractions. Ideal for longer stays and families traveling with children. | Playgrounds, Local parks, Nearby supermarkets |
Understanding Airbnb License Requirements & STR Laws in Ferrara (2025)
Yes, Ferrara, Emilia-Romagna, Italy enforces high STR regulations. Obtaining a license and ensuring compliance is almost certainly required according to current 2025 STR laws. Always verify the latest short term rental regulations and Airbnb license requirements directly with local government authorities for Ferrara to ensure full compliance before hosting.
(Source: AirROI data, 2025, based on 69% licensed listings)
Top Performing Airbnb Properties in Ferrara (2025)
Benchmark your potential! Explore examples of top-performing Airbnb properties in Ferrarabased on Trailing Twelve Month (TTM) revenue. Analyze their characteristics, revenue, occupancy rate, and ADR to understand what drives success in this market.
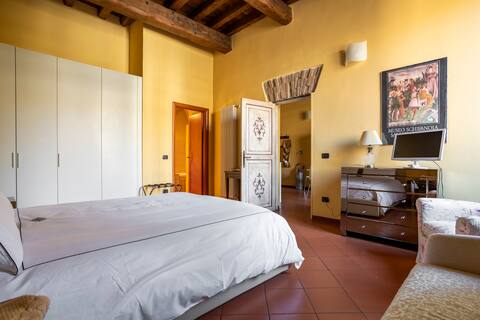
Duchesse house in the center of Ferrara
Entire Place • 1 bedroom

Certosa di Ferrara Wonderful Villa x12!
Entire Place • 5 bedrooms
![[LikeHome San Romano]3Rooms-1/10persone -Ferrara](https://a0.muscache.com/im/pictures/miso/Hosting-1010786663920689099/original/d9b5f2c3-e1d6-4952-9418-792815039288.jpeg?im_w=480&im_format=avif)
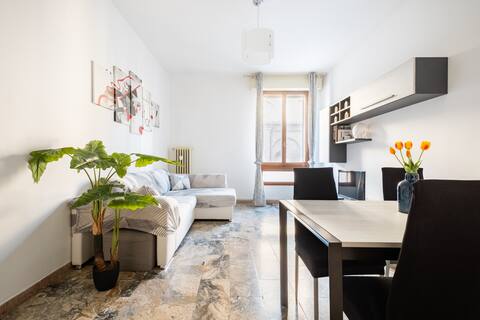
[LikeHome San Romano]3Rooms-1/10persone -Ferrara
Entire Place • 3 bedrooms
![[LikeHome San Romano] 1 Rooms-5 people](https://a0.muscache.com/im/pictures/hosting/Hosting-U3RheVN1cHBseUxpc3Rpbmc6MTAxMDc4NjY2MzkyMDY4OTA5OQ%3D%3D/original/b91e0905-a1b2-4bb0-8d07-bc8a3c097d23.jpeg?im_w=480&im_format=avif)
[LikeHome San Romano] 1 Rooms-5 people
Entire Place • 1 bedroom
>Centro Storico|Castle< Parking in front of the house
Entire Place • 2 bedrooms
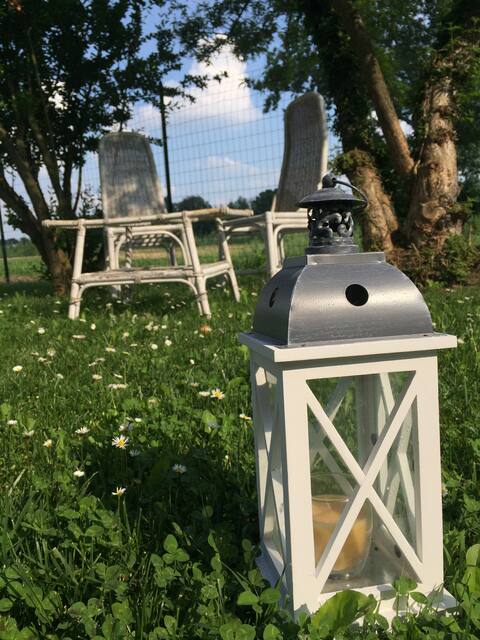
the "Green" in the garden
Entire Place • 2 bedrooms
Note: Performance varies based on location, size, amenities, seasonality, and management quality. Data reflects the past 12 months.
Top Performing Airbnb Hosts in Ferrara (2025)
Learn from the best! This table showcases top-performing Airbnb hosts in Ferrara based on the number of properties managed and estimated total revenue over the past year. Analyze their scale and performance metrics.
| Host Name | Properties | Grossing Revenue | Stay Reviews | Avg Rating |
|---|---|---|---|---|
| Welcome To Emilia Romagna & Ma | 44 | $887,060 | 1260 | 4.57/5.0 |
| Alessandro | 3 | $155,157 | 56 | 4.93/5.0 |
| Luca | 8 | $105,770 | 342 | 4.66/5.0 |
| Doris Natalina | 1 | $92,189 | 13 | 4.92/5.0 |
| Affitti Turistici/Brevi Ferrar | 6 | $78,265 | 48 | 3.69/5.0 |
| Emma | 5 | $71,618 | 250 | 4.90/5.0 |
| Matteo | 5 | $68,632 | 78 | 3.64/5.0 |
| Le Stanze Del Savonarola | 3 | $59,328 | 24 | 5.00/5.0 |
| Le Case Cavallini Sgarbi | 2 | $55,908 | 32 | 4.91/5.0 |
| Riccardo | 1 | $55,880 | 53 | 4.85/5.0 |
Analyzing the strategies of top hosts, such as their property selection, pricing, and guest communication, can offer valuable lessons for optimizing your own Airbnb operations in Ferrara.
Dive Deeper: Advanced Ferrara STR Market Data (2025)
Ready to unlock more insights? AirROI provides access to advanced metrics and comprehensive Airbnb data for Ferrara. Explore detailed analytics beyond this report to refine your investment strategy, optimize pricing, and maximize your vacation rental profits.
Explore Advanced MetricsFerrara Short-Term Rental Market Composition (2025): Property & Room Types
Room Type Distribution
Property Type Distribution
Market Composition Insights for Ferrara
- The Ferrara Airbnb market composition is heavily skewed towards Entire Home/Apt listings, which make up 82.7% of the 342 active rentals. This indicates strong guest preference for privacy and space.
- Looking at the property type distribution in Ferrara, Apartment/Condo properties are the most common (76.6%), reflecting the local real estate landscape.
- The presence of 8.5% Hotel/Boutique listings indicates integration with traditional hospitality.
- Smaller segments like others, outdoor/unique (combined 0.9%) offer potential for unique stay experiences.
Ferrara Airbnb Room Capacity Analysis (2025): Bedroom Distribution
Distribution of Listings by Number of Bedrooms
Room Capacity Insights for Ferrara
- The dominant room capacity in Ferrara is 1 bedroom listings, making up 54.4% of the market. This suggests a strong demand for properties suitable for couples or solo travelers.
- Together, 1 bedroom and 2 bedrooms properties represent 79.0% of the active Airbnb listings in Ferrara, indicating a high concentration in these sizes.
- With over half the market (54.4%) consisting of studios or 1-bedroom units, Ferrara is particularly well-suited for individuals or couples.
- Listings with 3+ bedrooms (6.7%) represent a smaller niche, potentially indicating an underserved market for larger group accommodations in Ferrara.
Ferrara Vacation Rental Guest Capacity Trends (2025)
Distribution of Listings by Guest Capacity
Guest Capacity Insights for Ferrara
- The most common guest capacity trend in Ferrara vacation rentals is listings accommodating 4 guests (26%). This suggests the primary traveler segment is likely small families or groups.
- Properties designed for 4 guests and 2 guests dominate the Ferrara STR market, accounting for 50.3% of listings.
- 13.1% of properties accommodate 6+ guests, serving the market segment for larger families or group travel in Ferrara.
- On average, properties in Ferrara are equipped to host 3.4 guests.
Ferrara Airbnb Booking Patterns (2025): Available vs. Booked Days
Available Days Distribution
Booked Days Distribution
Booking Pattern Insights for Ferrara
- The most common availability pattern in Ferrara falls within the 271-366 days range, representing 43.9% of listings. This suggests many properties have significant open periods on their calendars.
- Approximately 73.4% of listings show high availability (181+ days open annually), indicating potential for increased bookings or specific owner usage patterns.
- For booked days, the 91-180 days range is most frequent in Ferrara (31%), reflecting common guest stay durations or potential owner blocking patterns.
- A notable 27.5% of properties secure long booking periods (181+ days booked per year), highlighting successful long-term rental strategies or significant owner usage.
Ferrara Airbnb Minimum Stay Requirements Analysis
Distribution of Listings by Minimum Night Requirement
1 Night
106 listings
34.1% of total
2 Nights
72 listings
23.2% of total
3 Nights
50 listings
16.1% of total
4-6 Nights
9 listings
2.9% of total
7-29 Nights
33 listings
10.6% of total
30+ Nights
41 listings
13.2% of total
Key Insights
- The most prevalent minimum stay requirement in Ferrara is 1 Night, adopted by 34.1% of listings. This highlights the market's preference for shorter, flexible bookings.
- A significant segment (13.2%) caters to monthly stays (30+ nights) in Ferrara, pointing to opportunities in the extended-stay market.
Recommendations
- Align with the market by considering a 1 Night minimum stay, as 34.1% of Ferrara hosts use this setting.
- Explore offering discounts for stays of 30+ nights to attract the 13.2% of the market seeking extended stays.
- Adjust minimum nights based on seasonality – potentially shorter during low season and longer during peak demand periods in Ferrara.
Ferrara Airbnb Cancellation Policy Trends Analysis (2025)
Super Strict 60 Days
1 listings
0.4% of total
Flexible
99 listings
35% of total
Moderate
140 listings
49.5% of total
Strict
43 listings
15.2% of total
Cancellation Policy Insights for Ferrara
- The prevailing Airbnb cancellation policy trend in Ferrara is Moderate, used by 49.5% of listings.
- The market strongly favors guest-friendly terms, with 84.5% of listings offering Flexible or Moderate policies. This suggests guests in Ferrara may expect booking flexibility.
Recommendations for Hosts
- Consider adopting a Moderate policy to align with the 49.5% market standard in Ferrara.
- Regularly review your cancellation policy against competitors and market demand shifts in Ferrara.
Ferrara STR Booking Lead Time Analysis (2025)
Average Booking Lead Time by Month
Booking Lead Time Insights for Ferrara
- The overall average booking lead time for vacation rentals in Ferrara is 38 days.
- Guests book furthest in advance for stays during June (average 52 days), likely coinciding with peak travel demand or local events.
- The shortest booking windows occur for stays in March (average 31 days), indicating more last-minute travel plans during this time.
- Seasonally, Summer (50 days avg.) sees the longest lead times, while Winter (37 days avg.) has the shortest, reflecting typical travel planning cycles.
Recommendations for Hosts
- Use the overall average lead time (38 days) as a baseline for your pricing and availability strategy in Ferrara.
- For June stays, consider implementing length-of-stay discounts or slightly higher rates for bookings made less than 52 days out to capitalize on advance planning.
- Target marketing efforts for the Summer season well in advance (at least 50 days) to capture early planners.
- Monitor your own booking lead times against these Ferrara averages to identify opportunities for dynamic pricing adjustments.
Popular & Essential Airbnb Amenities in Ferrara (2025)
Amenity Prevalence
Amenity Insights for Ferrara
- Essential amenities in Ferrara that guests expect include: Heating, Wifi. Lacking these (any) could significantly impact bookings.
- Popular amenities like TV, Hot water, Kitchen are common but not universal. Offering these can provide a competitive edge.
Recommendations for Hosts
- Ensure your listing includes all essential amenities for Ferrara: Heating, Wifi.
- Prioritize adding missing essentials: Heating, Wifi.
- Consider adding popular differentiators like TV or Hot water to increase appeal.
- Highlight unique or less common amenities you offer (e.g., hot tub, dedicated workspace, EV charger) in your listing description and photos.
- Regularly check competitor amenities in Ferrara to stay competitive.
Ferrara Airbnb Guest Demographics & Profile Analysis (2025)
Guest Profile Summary for Ferrara
- The typical guest profile for Airbnb in Ferrara consists of a mix of domestic (47%) and international guests, with top international origins including France, typically belonging to the Post-2000s (Gen Z/Alpha) group (50%), primarily speaking English or Italian.
- Domestic travelers account for 46.9% of guests.
- Key international markets include Italy (46.9%) and France (8%).
- Top languages spoken are English (36.4%) followed by Italian (24.2%).
- A significant demographic segment is the Post-2000s (Gen Z/Alpha) group, representing 50% of guests.
Recommendations for Hosts
- Balance marketing efforts between domestic and international channels based on the guest mix.
- Tailor amenities and listing descriptions to appeal to the dominant Post-2000s (Gen Z/Alpha) demographic (e.g., highlight fast WiFi, smart home features, local guides).
- Highlight unique local experiences or amenities relevant to the primary guest profile.
- Consider seasonal promotions aligned with peak travel times for key origin markets.
Nearby Short-Term Rental Market Comparison
How does the Ferrara Airbnb market stack up against its neighbors? Compare key performance metrics like average monthly revenue, ADR, and occupancy rates in surrounding areas to understand the broader regional STR landscape.
| Market | Active Properties | Monthly Revenue | Daily Rate | Avg. Occupancy |
|---|---|---|---|---|
| Brenzone sul Garda | 19 | $4,128 | $335.25 | 52% |
| Crespina | 16 | $3,526 | $493.64 | 48% |
| Venice | 6,405 | $3,454 | $238.80 | 53% |
| Tignano | 10 | $3,391 | $500.31 | 36% |
| Luni Mare | 11 | $3,102 | $169.59 | 40% |
| Buonconvento | 59 | $3,068 | $456.70 | 46% |
| Cazzago San Martino | 14 | $3,018 | $474.20 | 28% |
| Castelfranco di Sotto | 47 | $2,881 | $294.54 | 38% |
| Florence | 9,598 | $2,833 | $208.48 | 52% |
| Marcialla | 25 | $2,788 | $236.61 | 54% |